Literature values for density of the binary Na2O and K2O alkali germanate glasses compared to the value for the Na2O•K2O•GeO2. This chapter will provide an overview of the literature regarding the mixed alkali effect and the germinated anomaly.
Mixed Alkali Effect
The most challenging aspect of the mixed alkali effect (MAE) is the development of a theoretical model. The magnitude of the mixed alkali effect is not the same for every alkali pair.
Alkali Germanate Anomaly
Ivanov, Evstropiev, Murthy and Ip Theory
The anomalous properties are attributed to a coordination change, similar to that proposed for alkali borate glasses. GeO2 crystals can contain germanium ions in both tetrahedra and octahedra.127,128 As a result, it was assumed that germanium can exist in 4-fold and 6-fold coordination sites in glasses. Theories state that additions of alkali oxide beyond the maximum in density (~15 to 20 mol %) results in conversion of six-coordinate germanium ions to four-coordinate germanium ions.
Henderson and Fleet Theory
Current Theory
Concentrations of alkali oxide greater than 30 mol% result in the transformation of the five-coordinated germanium ions back to the four-coordinated ones. Large amounts of alkali oxide (35 to 40 mol %) cause transformation of some of the five-coordinated germanium ions back to four-coordinated germanium ions and two NBOs.
Russ, “A new interpretation of the dynamic structure model of ion transport in molten and solid glasses,” Phys. Henderson, "The effects of alkali cation mass and radii on the density of alkali germanate and alkali germanophosphate glasses," J.
Experimental Procedures 20
Glass Melting
Cutting, Grinding and Polishing
General Properties 20
Literature Review
- Glass Transition Temperature
- Density
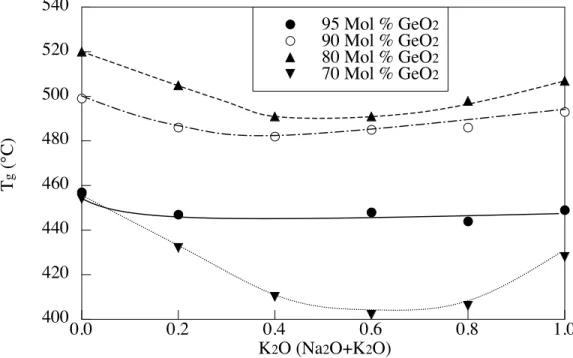
The glass transition temperature is one of the most commonly reported values for alkali germanate glasses. The x Cs2O•(100-x) GeO2 glasses are the least studied alkali germanate binary system; Tg values for the glasses are shown in Figure 4-8.

Experimental Procedure
- Glass Transition Temperature
- Density
Results
- Glass Transition Temperature
- Density
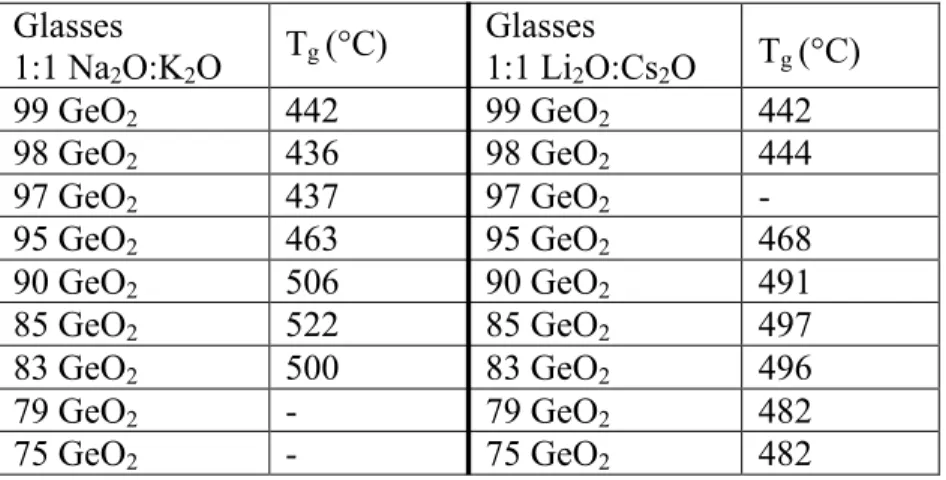
When the ratios of alkali oxides are kept constant at 1:1 and the germanium concentration is reduced, the ternary alkali-germanate glasses behave similarly to the binary alkali-germanate glasses discussed earlier. Germanic anomaly, shown for Tg data from the Na2O•K2O•GeO2 system, along the 1:1 Na2O:K2O line. Germanic anomaly, shown for Tg data of the Li2O•Cs2O•GeO2 system, along the 1:1 Li2O:Cs2O line.
As with the x Na2O•(10-x) K2O•90 GeO2 glass, the molar volume increases when lithium oxide replaces cesium oxide, as shown in Figure 4-39. The effect of mixed alkalis strongly influences the density and molar volumes of binary alkali germanate glasses. The densities of the mixed alkali germanate glasses are also the highest, while the molar volumes show the minimum.
Discussion
- Glass Transition Temperature
- Density
Glass transition temperature for the binary Na2O and K2O germanate glasses (from the literature17) and for the mixed alkali Na2O•K2O•GeO2. Glass transition temperature for the binary Li2O and Cs2O germanate glasses (from the literature5,17) and for the mixed alkaline Li2O•Cs2O•GeO2. As the total amount of alkali in the mixed alkali glasses is increased, the minimum typical of the germanate anomaly appears in the molar volume (Figure 4-55).
The densities of the mixed alkali glasses are compared with the binary alkali germanate glasses in Figures 4-55 and 4-56. Literature values for density of the binary Na2O and K2O alkali-germanate glasses compared to the value for the Na2O•K2O•GeO2 mixed alkali glasses. Literature values for density of the binary Li2O and Cs2O alkali germanate glasses compared to the value for the Li2O•Cs2O•GeO2 mixed alkali glasses.

Conclusion
Catauro, "Glass transition temperature and devitrification behavior of glasses in the Na2O• 4 GeO2-K2O• 4 GeO2 composition range,". Composition of glasses in silicate, borate, and germanate systems with group Ia-IIa element oxides,” Fiz.
Infrared Spectra 63
- Literature Review
- Experimental Procedures
- Results
- Mixed Alkali Glasses
- Germanate Anomaly
- Discussion
- Conclusion
- References
Band Positions of Infrared Absorption Water Bands of Germanate Glasses Band Position (cm-1) Vibrational Assignment of Hosono and Abe8. In both systems, the effect of alkali addition in the region near the multiphonon edge is obvious and independent of the identity of the cations. Line drawn to aid the eye, error bars generated based on instrument precision are smaller than the data points.
In Li2O•Cs2O•GeO2 glasses, bands II and III are an important aspect of the infrared spectra in glasses with only 15 mol% alkali oxide. Currently, the infrared spectra bands of the germanate glasses in the range from 4000 to 1500 cm-1 have been assigned by analogy with the band position of silicate glasses. An experiment was conducted to confirm that these bands are actually the result of the presence of water in the glass and not the glass structure.

Electrical Conductivity 64
Literature Review
- Ionic Conductivity in Glasses
- Mixed Mobile Ion Effects on Conductivity
- Germanate Anomaly
After the overview of ionic conductivity, there is a brief discussion of the mixed mobile ion effect in the context of ionic conductivity. The last section of the literature review summarizes previous electrical conductivity studies on alkali germanate glasses. The weak electrolyte theory assumes that the mobility of the ion is constant with increasing concentration.
The relatively small amount of literature on the electrical conductivity of alkali germanate glasses allows a thorough review of the existing work. For the Li2O•GeO2 system, most pre-exponentials fall within an order of magnitude of the calculated value of ≈ 10. The electrical conductivities of the Rb2O•GeO2 and Cs2O•GeO2 glasses are similar and will be discussed simultaneously.
Experimental Procedures
- Sample Preparation
- Electrical Conductivity Measurements
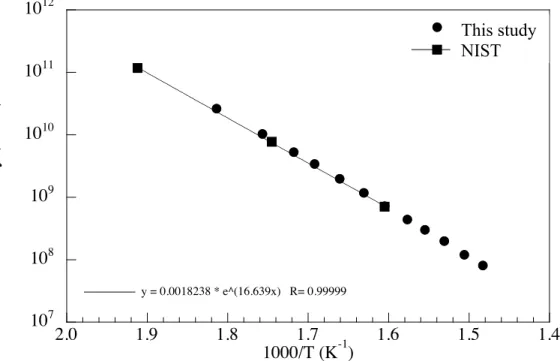
- Comparing to NIST Standards
Electrical conductivity measurements were performed using the three-probe DC approach shown in Figure 6-22. The inner electrode is placed in the center of the ring as shown in Figure 6-22. Electrical conductivity measurements are performed by heating the furnace to the temperature at which the sample first begins to conduct at the measurement level.
The oven is kept at this temperature for 30 minutes so that the glass can reach the temperature of the oven. The oven temperature is then increased in 10 K increments, with 10 minute intervals between measurements. An estimate of the accuracy of activation energies measured under ideal conditions can be calculated.
Results
- Mixed Alkali Germanate Glasses
- Germanate Anomaly
Deviation from additivity of activation energy for DC conductivity for mixed alkali x Li2O•(10-x) Cs2O•90 GeO2 glasses. Pre-exponential factor (σ0) of the Arrhenius equation for mixed alkaline x Li2O•(10-x) Cs2O•90 GeO2 glasses. Log deviation from additivity for DC electrical conductivity for x Na2O•(10-x) K2O•90 GeO2 glasses at glass transition temperature (Tg) and 300 °C.
Deviation from additivity of the activation energy for DC conduction for the mixed alkali x Na2O•(10-x) K2O•90 GeO2 glasses. Log of the deviation from additivity for the DC electrical conductivity x Na2O•(15-x) K2O•85 GeO2 glasses at the glass transition temperature (Tg) and 300 °C. Deviation from additivity of the activation energy for DC conduction for the mixed alkali x Na2O•(15-x) K2O•85 GeO2 glasses.
Discussion
- Mixed Alkali Effect
- Germanate Anomaly
Difference between the log of the conductivity at 300 °C and the log of the addition line for Li2O•Cs2O•GeO2 glasses with 90 and 85 mol % GeO2. Difference between the log of the conductivity at 300 °C and the log of the addition line for Na2O•K2O•GeO2 glasses with 90 and 85 mol % GeO2. Difference between the log of the conductivity at 300 °C and the log of the addition line for mixed alkali glasses with 90 mol % GeO2.
Difference between log of conductivity at 300 °C and log of additive line for alkali glasses mixed with 85 mol % GeO2. Difference between conductivity log at 300 °C and additive line log for mixed alkali glasses for all Na2O•K2O•GeO2 glasses. Difference between log of conductivity at 300 °C and log of additive line for mixed alkali glasses for all Li2O•Cs2O•GeO2 glasses.
Conclusions
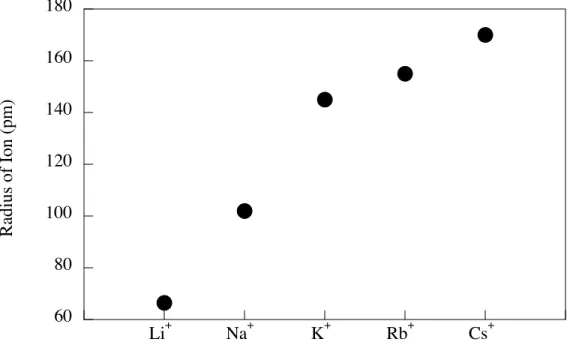
When mixed alkali germanate glasses contain 10 mol% alkali oxide, the largest deviation from additivity occurs for the ions with the closest radius ratio. The curves for the glasses with more lithium than cesium resemble the binary Li2O•GeO2 glasses. The curves for the glasses with more cesium than lithium resemble the binary Cs2O•GeO2 glasses.
The findings of this study reiterate the caution needed when assuming models for transport phenomena based on silicate glasses. In some cases they are even separated into phases, which prevents observation of the effect of small amounts of smaller alkali on conductivity. 2.
Moynihan, “Molecular dynamics simulations of the dynamics of ions in single and mixed alkali glasses” J. Jain, “Local structure and electrical response of Rb and (Rb, Ag) Germanate glasses: relaxation of electrical conductivity”, J. Correlation of the ion Conductivity with the chemical potential of alkali oxide in oxide glasses.," Phys.
A statistical model for the variations of the chemical potential of the constituents in binary alkali oxide glasses.," Phys. Mehrer, "molar volume, glass transition temperature and ionic conductivity of Na and Rb borate glasses compared to mixed Na -Rb Borate Glasses,” J. Pogodaev, “Ion-Exchange Interaction between Germanate Glasses and Molten Alkali Nitrate and Refractive-Index Gradient Glasses,” Fiz.
Crystallization 150
- Literature Review
- Crystallization Kinetics
- Previous Work
- Experimental Procedure
- Sample Preparation
- Differential Scanning Calorimetry
- X-Ray Diffraction
- Environmental Scanning Electron Microscopy
- Results
- DSC Studies
- High Temperature X-Ray Diffraction
- Discussion
- Kissinger Study
- Effect of Particle Size
- X-ray Diffraction
- Comparison to Literature Data
- Conclusion
- References
The fundamental theory behind isothermal crystallization studies was developed by Johnson and Mehl,7 and Avrami,8-10 and is commonly referred to as the JMA approach. Because Kissinger11,12 developed much of the theory behind nonisothermal crystallization, this method is commonly referred to as the Kissinger approximation. A discussion of the fundamental kinetics and thermodynamics of nucleation and crystal growth in glass will follow the discussion of isothermal and non-isothermal crystallization kinetics.
An important specific case of isothermal crystallization occurs when the nucleation frequency and growth rate are independent of time. Comparing Equation 7-2 with 7-4, it can be seen that Kn ∝ Ivum, which is important because it shows mathematically that the temperature dependence of the effective overall reaction rate, K, is Arrhenian in nature when the temperature dependences of Iv and u are Arrhenic in nature. For more details on other approaches, please refer to Yinnon and Uhlmann.16 In summary, a non-isothermal crystallization study involves DSC or DTA experiments, where the heating rate (φ) is varied, resulting in the following equation.
Conclusions 236
O•(100- x) GeO 2 Glasses
O:Cs 2 O•85 GeO 2 Glasses