Significant influence of grain orientations on the thermal expansion, magnetostrictive and magnetomechanical damping properties of TbDy was observed. Furthermore, the effects of magnetic phase transitions on thermal expansion through the Curie and N neel points of TbDy revealed thermal expansion anisotropy between grain orientations in the rolling and transverse directions of deformation.
List of Tables
Chapter 1
Mechanisms of Magnetostriction
- Microscopic Theory of Magnetostriction
- Macroscopic Approach
- Magnetocrystalline Anisotropy
- Domain Influence on Magnetoelasticity
- Magnetoelastic Dissipation - Transformation of Elastic Energy into Magnetic Energy
- TbDy - Magnetoelastic Properties
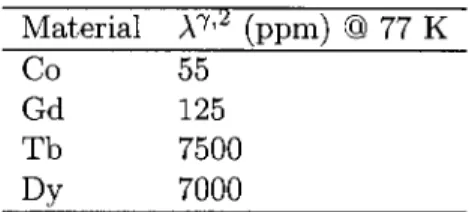
The result can be further simplified to the case of magnetization confined within the basal plane (as we assume for terbium-dysprosium (TbDy) alloys), generally eliminating the magnetostriction terms outside the basal plane directions a and b. Due to the strong c -axis hexagonal structure of TbDy, the domains are assumed to always lie in the basal plane.
Bibliography
Chapter 2
Preparation and Thermal
Expansion of Polycrystalline TbDy Samples
Technical Advantages of Polycrystalline TbDy
- Preparation of Textured Polycrystalline TbDy Samples
- Thermal Expansion measurements of TbDy
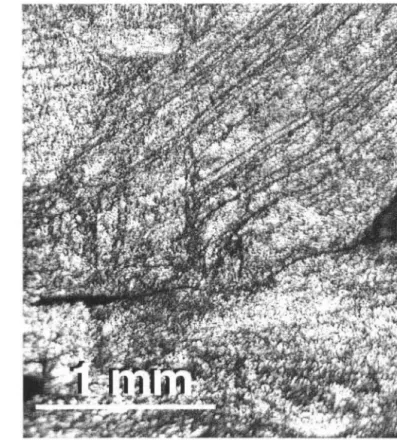
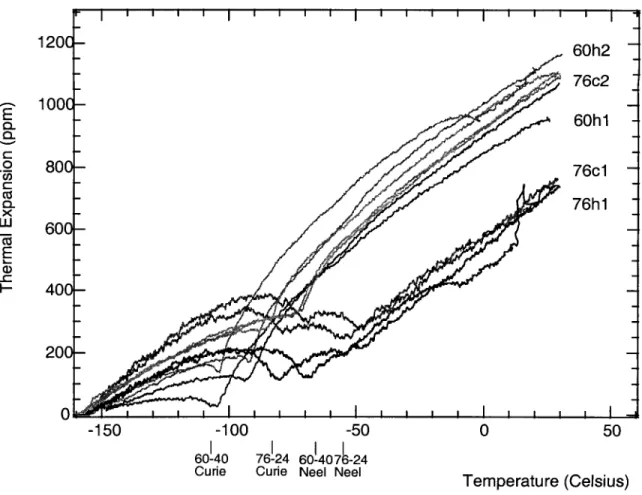
Such slip lines can be seen in the upper part of Figure 2.2 as faint lines of contrast within a grain of TbDy. In the case of our rolled TbDy samples, several effects of texture can be easily seen from cold thermal expansion measurements. Most striking was the difference between expansion in the rolling direction (x-axis) in Figure 2.4 and expansion in the direction transverse to rolling and applied stress (y-axis) in Figure 2.5.
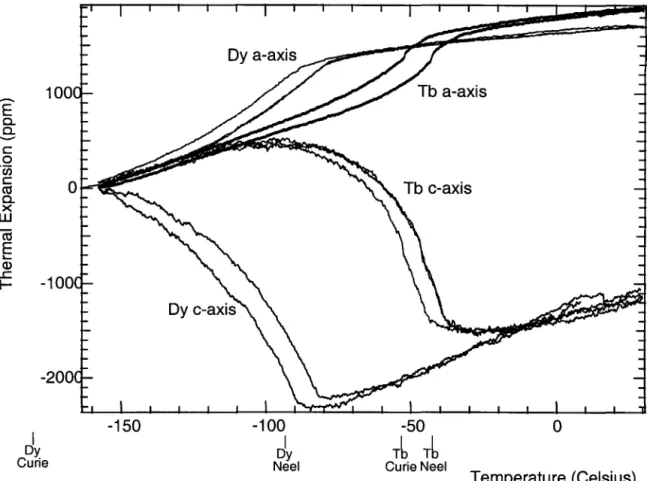
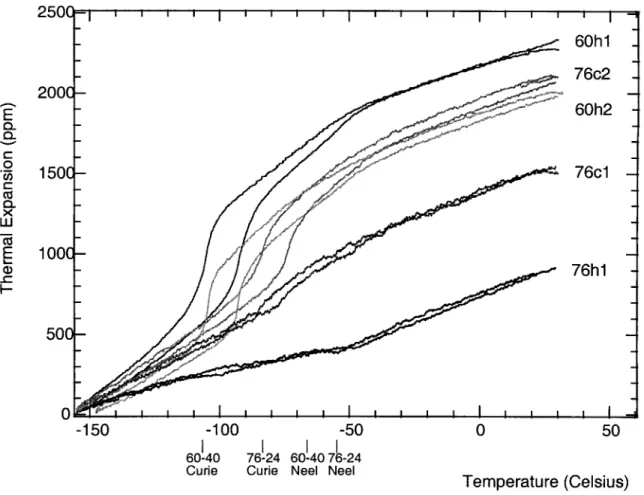
In particular, the x-axis shows a behavior very similar to the basal plane expansion of a single crystal, whereas. Nevertheless, there appears to be a more preferred orientation of the grains on the x-axis compared to the texture on the y-axis. Thermal expansion measurements in the z-axes of our samples, shown in Figure 2.6, reveal a large thermal contraction just below the Neel point, very similar to single-crystal c-axis behavior.
This result further confirms the strong tendency for the grains in our samples to orient their c-axes in the direction of applied strain of deformation.
Chapter 3
Magnetostriction of Textured TbDy Alloys
Magnetostriction Measurements of TbDy
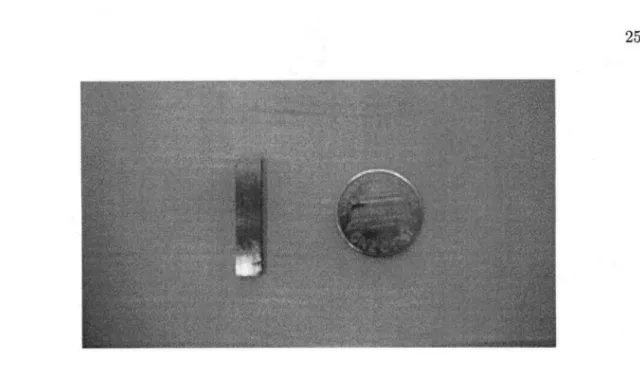
The sample fits into a slot drilled in one arm of the fiberglass foam brackets shown in Figures 3.1-3.2. The ends of the sample were in contact with aluminum plates attached to each arm of the measuring device. Thus, as the calipers closed, the sample was held in place with a normal force at each point of the sample.
A high-tension cord attached to one arm of the calipers pulled the arms together when the cord was pulled away from the calipers, applying a force to the sample. This applied load interacts with the magnetoelastic coupling of the sample to induce domain alignment perpendicular to the long axis of the sample [1]. The ends of the calipers were placed in an LN2 dewar such that the sample was completely submerged.
Opposite each end of the sample were the poles of an electromagnet capable of changing fields up to 4.5 kOe.
Load
Pivot
Magnetostrictive Performance over Multiple Cycles
An important property of any candidate material for actuator applications is its resistance to wear over multiple duty cycles. To assess the magnetoelastic fatigue of polycrystalline TbDy, we measured the magnetostrictive stress over multiple expansion cycles. The results of 155 expansion cycles of a sample of Tbo.6Dyo.4 are shown in Figure 3.7.
A 1st cycle
Magnetostriction vs. Thermal Expansion Anisotropy
As discussed in Chapter 2, thermal expansion measurements of TbDy polycrystals provide information on grain alignment. In particular, the extent to which the c-axes of grains align in a particular direction in a sample can be determined by comparing thermal expansion with known single crystalline values. Of particular interest in our study is the ratio of thermal expansions in the z and x directions, as these provide a measure of grain alignment along the direction of magnetostriction, the x axis.
Influence of grain orientation on magnetic energy
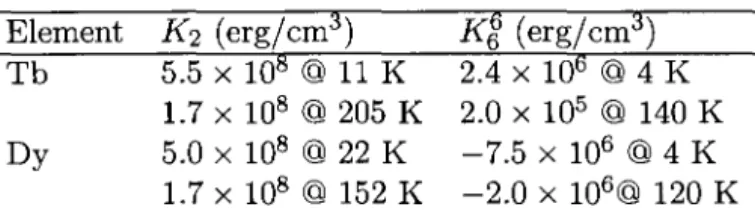
Therefore, the energy required to magnetize TbDy alloys depends on the texture and its effects on the magnetocrystalline anisotropy. For hexagonal materials with a dominant first-order coefficient K2 of c-axis hard magnetic anisotropy, as in TbDy, the magnetization energy can be approximated as [6]. The estimated internal magnetic energy of the sample at magnetic saturation can therefore be calculated by knowing the angular distribution of the grains.
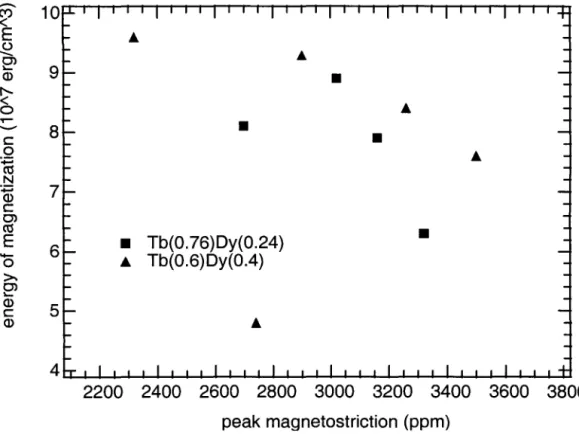
We can use the thermal expansion anisotropy to estimate the angular distribution of grains in TbDy polycrystals. The probability density w (()) of grains at an angle () from the z-axis is rigorously calculated with several terms of WZmn, but the two terms used here are the only ones that can be derived from thermal expansion. We normalized w (()) and integrated the grain distribution multiplied by the magnetization energy in equation 3.1 to obtain an estimate of the magnetic energy due to magnetocrystalline anisotropy.
The first trend in our results generally shows lower intrinsic magnetization energies corresponding to higher magnetostriction, consistent with our measured relationship between magnetostriction and thermal expansion anisotropy.
Magnetomechanical damping by polycrystalline TbDy
Introduction
Previous studies of materials with large magnetostrictives show significant mechanical hysteresis due to magnetoelastic effects, which in the case of polycrystalline Terfenol-D often dissipate more than 25% of the mechanical energy at zero applied field [1]. In particular, the elastic modulus of modulus at zero applied field of textured polycrystalline Tbo.6Dyo.4 samples was measured as 15 GPa at 77K and applied stresses of 7 to 13 MPa [2]. It is much lower than the elastic modulus of Tb and Dy above the Curie point, typically between 20 and 70 GPa for single crystals depending on crystallographic direction [3, 4].
It is clear that ferromagnetism has a large influence on the elastic properties of TbDy, an issue that will be addressed in this chapter.
Measurement of Stress-Strain Relations of Polycrystalline TbDy
Crossbeam Dewar
Sample Strain
Results of Polycrystalline TbDy Damping
Cyclic stress-strain curves measured on a polycrystalline Tbo.76DYo.24 sample of commercial purity (sample 76c1) are shown in Figure 4.2. The effects of magnetoelastic coupling during the 77 K measurements are clearly visible from the pronounced hysteresis in the stress-strain curve. The local strains provided by domain reorientation occur at much lower stresses than required by working against the interatomic force constants, which are expected to be approximately the same at 77 K as at 300 K.
Corresponding measurements performed on a high purity sample of polycrystalline Tbo.76DYO.24 (sample 76hl) are shown in Figure 4.3. In each case, intermediate cyclic stress-strain curves were also measured at 77 K, giving the smaller loops shown in Figures 4.2 and 4.3. The width of the hysteresis loops in the stress–strain curves is reduced at higher applied stresses for both samples, indicating saturation of magnetization and a resulting decrease in damping.
1000 Strain (ppm)
By measuring the current in a solenoid around a magnetostrictive sample subjected to an applied load, the change in magnetic field and hence the change in magnetization of the sample can be determined. The sample and solenoid were placed in the same dewar used in the Instron tests, and the sample was supported on an aluminum plate while immersed in LN2. A typical result is shown in Figure 4.4, with the signal voltage (proportional to current) plotted against time.
Since the applied force is not well controlled in this experiment, the data are of limited use, but some aspects of the sample's magnetoelastic behavior are nevertheless clear. Because the sample is magnetized by an impact force, we assume that the solenoid's signal is reduced by the dissipation of vibrations within the sample. This strongly suggests that each peak in the signal represents one cycle of vibration of the sample.
By fitting the peaks of the oscillations to the decomposed exponential curves as in Figure 4.4, we observe a decay in the amplitude of the signal peaks of -23% per cycle.
Analysis
Unfortunately, Cc is difficult to determine in the case of our samples, because plastic deformation begins to occur at stresses of 40 MPa. Under this stress, the elastic modulus is not close to room temperature values and mechanical hysteresis is still evident. While typical measured distributions per cycle are 2 x 10⁻³ J for full stress-strain cycles of both our samples, the model predicts distributions about an order of magnitude too large.
Because the model neglects the effects of grain boundaries and other microstructures of polycrystalline TbDy as barriers to domain rearrangement, it is also not surprising that we obtain an overestimation of mechanical dissipation. A number of models of magnetomechanical damping have been developed to accurately account for jumping of the magnetic domain between easy axes of anisotropy. However, because applied stresses will not cause magnetization jumps around 1800, this model is not useful for hexagonal TbDy or any other uniaxial material.
Although this model is promising for the analysis of damping in polycrystalline TbDy, it presents formidable barriers in the calculation of local stress barriers (Tloc). Further discussion of this approach will be presented in Chapter 5.
Chapter 5
Future Research
Grain orientation measurements
From such information, polar diagrams of the texture can be obtained and a more thorough bulk texture analysis of the effects of bulk texture on the magnetoelastic properties of TbDy alloys can be performed. The standard technique of X-ray diffraction polar figure analysis is possible, but our own work shows that this is difficult for two reasons: the necessarily large grains of TbDy samples that require the use of averaging over many samples, and the ability to make only surface measurements. texture. Because X-rays at 30 keV only penetrate 100 microns into Tb and Dy, measurements of the bulk grain texture of the interior of TbDy alloys using this method are problematic.
Unfortunately, neutron diffraction measurements, which are also commonly used to characterize the texture of alloys, are frustrated by a large neutron absorption cross section of Dy nuclei. Another technique using backscattered electrons from a scanning electron microscope beam has been shown to provide surface texture information for cubic polycrystals; further development of analysis software will enable texture determination of hexagonal materials such as TbDy in the future.
Domain interaction with grain boundaries
The basis of the Smith-Birchak model can be further refined by measuring the local dissipative effects of grain boundaries. The induced domain wall oscillations are modeled as a damped harmonic oscillator and reveal the effects of small-scale structures on domain motion and the resulting dissipations [6]. Such information would be valuable in assessing the microstructural influences of different deformation and annealing procedures on the damping properties of TbDy polycrystalline alloys.
![Figure 1.1: Electron cloud configuration of terbium in a hexagonal lattice. From Chikazumi [9]](https://thumb-ap.123doks.com/thumbv2/123dok/11039165.0/22.865.266.681.343.931/figure-electron-cloud-configuration-terbium-hexagonal-lattice-chikazumi.webp)