1 . C h a p t e r 7
REAL-TIME KINETICS AND HIGH-RESOLUTION MELT CURVES IN SINGLE-MOLECULE DIGITAL LAMP TO DIFFERENTIATE AND STUDY SPECIFIC AND NONSPECIFIC AMPLIFICATION
J.C. Rolando, E. Jue, J. Barlow, and R.F. Ismagilov. 2020. Nucleic Acids Research. 48(1):42.
doi:10.1093/nar/gkaa099
Abstract
Isothermal amplification assays, such as loop-mediated isothermal amplification (LAMP), show great utility for the development of rapid diagnostics for infectious diseases because they have high sensitivity, pathogen-specificity, and potential for implementation at the point of care. However, elimination of nonspecific amplification remains a key challenge for the optimization of LAMP assays. Here, using chlamydia DNA as a clinically relevant target and high throughput sequencing as an analytical tool, we investigate a potential mechanism of nonspecific amplification. We then develop a real-time digital LAMP (dLAMP) with high-resolution melting temperature (HRM) analysis and use this single-molecule approach to analyze approximately 1.2 million amplification events. We show that single-molecule HRM provides insight into specific and nonspecific amplification in LAMP that are difficult to deduce from bulk measurements. We use real-time dLAMP with HRM to evaluate differences between polymerase enzymes, the impact of assay parameters (e.g., time, rate, or florescence intensity), and the effect background human DNA. By differentiating true and false positives, HRM enables determination of the optimal assay and analysis parameters that leads to the lowest limit of detection (LOD) in a digital isothermal amplification assay.
Introduction
Isothermal methods, such as loop-mediated isothermal amplification (LAMP), are attractive for nucleic acid amplification tests (NAATs) in point-of-care and limited-resource settings (1,2). LAMP in particular shows promise as a NAAT with fewer hardware requirements compared with PCR (3). Despite advancements, the ability to optimize LAMP NAATs for a specific target sequence and primer set (specific to a target organism) remains constrained by a limited understanding of how amplification is affected by myriad factors, including polymerase choice, primer design, temperature, time, and ion concentrations. In particular, addressing nonspecific amplification remains a core problem as it constrains an assay’s limit of detection (LOD). In reactions containing template target molecules, both specific and nonspecific amplification reactions may occur. Unlike PCR, LAMP lacks a temperature- gating mechanism, so nonspecific reactions consume reagents and compete with specific amplification impacting its kinetics. The presence of nonspecific amplicons therefore adversely impacts both the assay’s analytical sensitivity (the fewest template molecules that can be detected) and its analytical specificity (ability to detect the target template in the presence of competing reactions). Classifying reactions as either specific or nonspecific amplification would therefore be invaluable both during assay optimization and assay deployment in clinical diagnostics.
Substantial research is focused on using isothermal amplification chemistries for diagnosis of infectious disease. For example, chlamydia (caused by the pathogen Chlamydia trachomatis, CT) is the most common sexually transmitted infection worldwide, with more than 110 million cases reported annually (4). Diagnosis of CT infections is challenged by a lack of standard symptoms (many infections are asymptomatic) (5) and the presence of mixed flora (particularly in the female reproductive tract) (6). Thus, rapid NAATs with high sensitivity and specificity are critically needed, especially NAATs that can deal with the high levels of host or background DNA likely to be present in clinical samples such as urine samples and swabs (7,8).
Optimizing LAMP for CT and other infectious pathogens requires addressing and reducing nonspecific amplification or a method for separating nonspecific reactions from specific amplification. Reactions run in bulk (i.e., in a tube) in the absence of template can be informative to provide information on performance of nonspecific amplification. Another method to identify nonspecific amplification includes mathematical modeling in conjunction with electrophoresis to distinguish between nonspecific and specific banding patterns(9).
However, in the presence of template, although specific and nonspecific reactions occur simultaneously, they cannot be monitored simultaneously. Thus, bulk reactions have three important limitations with regard to assay optimization: (i) differences in the kinetics of specific and nonspecific reactions cannot be separated; (ii) rare but significant events, such as early but infrequent nonspecific amplification, cannot be easily characterized; and (iii) testing the full design space requires many hundreds of replicates to obtain statistically significant data. To improve an assay’s analytical specificity and sensitivity, one strategy is to eliminate the detection of nonspecific amplification. In bulk LAMP experiments, nonspecific amplification can be excluded from detection by using probes, beacons, FRET, or reporter-quencher schemes that show only specific amplification of the target (10-19).
Although these methods improve the assay, they do not capture nonspecific reactions and thus cannot give insights into the origin of nonspecific amplification or the conditions that led to nonspecific amplicons. Moreover, probes and beacons do not eliminate nonspecific amplification; nonspecific amplification still competes for reagents and can limit the extent of the signal generated by specific amplification events (20). Hence, it is highly desirable to distinguish specific from nonspecific amplification.
In this study, we combined sequencing and digital single-molecule LAMP (dLAMP) with high-resolution melting temperature (HRM) to probe the fundamental mechanics of amplification reactions. We used dLAMP to extract real-time kinetic information to identify the digital threshold data-processing parameters that minimize nonspecific amplification events and elucidate how an interfering molecule impacts amplification. Digital single- molecule methods separating individual amplification events into discrete compartments, eliminating interference among individual amplification events (21,22). Furthermore, digital experiments consist of thousands of reactions that run in parallel and thus provide valuable
statistical information (21-23). We used real-time imaging to monitor the kinetics of 20,000 dLAMP reactions per experiment and observe ~ 1.2 x 10⁶ reactions in total. We hypothesized that high-resolution melting analysis (HRM) could be a tool for separating specific from nonspecific amplification events and for identifying the optimal digital threshold data- processing parameters to distinguish specific and nonspecific amplification events (even when an assay is deployed without HRM). To test this hypothesis, we used a dLAMP assay with CT DNA as the target (combined with sequencing to identify the products of bulk reactions) to analyze both specific and nonspecific amplification under conditions that include clinically relevant concentrations of background human DNA.
Materials and Methods LAMP reagents
IsoAmp I (#B0537S), IsoAmp II (#B0374S), MgSO4 (#B1003S), deoxynucleotide solution (#N0447S), Bovine Serum Albumen (BSA, #B9000S0), Bst 2.0 (8,000 U/mL, #M0537S), and Bst 3.0 (8,000 U/mL, #M0374S) were purchased from New England Biolabs (Ipswich, MA, USA). Ambion RNase Cocktail (#AM2286), Ambion nuclease-free water (#AM9932), Invitrogen SYTO 9 (S34854), and Invitrogen ROX Reference Dye (#12223012) were purchased from Thermo Fisher Scientific (Waltham, MA, USA). We found it important to use SYTO 9 dilutions within one week of preparation.
Primers sequences were targeted against the Chlamydia trachomatis 23S ribosomal gene using Primer Explorer V5 (Eiken Chemical, Tokyo, Japan) and checked in SnapGene (GSL Biotech, Chicago, IL, USA) to ensure the sequences were in a mutation-free region from the available Genebank sequences of CT. Primers were purchased from Integrated DNA Technologies (San Diego, CA, USA) and suspended in nuclease-free water. For all experiments, the final concentrations of primers were 1.6 µM FIP/BIP, 0.2 µM FOP/BOP, and 0.4 µM LoopF/LoopB. Primer sequences are listed in Supplementary Materials and Methods.
LAMP experiments using Bst 2.0 were amplified at 68 °C in nuclease-free water, with final concentrations of: 1x IsoAmp I Buffer, 7mM total MgSO4 (5 mM additional), 1.4 mM each dNTP, 1.25 uM ROX Reference Dye, 1 mg/mL BSA, 320 U/mL Bst 2.0, 1x Ambion RNase Cocktail, and 2 uM SYTO 9.
LAMP experiments using Bst 3.0 were amplified at 69 °C in nuclease-free water, with final concentrations of: 1x IsoAmp II Buffer, 8mM total MgSO4 (6 mM additional), 1.4 mM each dNTP, 1.25 uM ROX Reference Dye, 1 mg/mL BSA, 320 U/mL Bst 2.0, 1x Ambion RNase Cocktail, and 2 uM SYTO 9.
For both enzymes, after 90 min of amplification, reactions were ramped to 95°C at maximum output and held for 30 sec to inactivate the enzymes. Chips were cooling to 55°C and the melt performed at a ramp rate of 1 °C per image from 55–90 °C, and a ramp rate of 0.5 °C per image from 90–95 °C.
Extraction of spiked Chlamydia trachomatis (CT) from a relevant clinical matrix
A frozen stock of live CT (D-UW3, Z054, Zeptometrix, Buffalo, NY, USA) was re- suspended in pre-warmed (37 °C) SPG buffer (219 mM sucrose, 3.7 mM KH2PO4, 8.5 mM NA2HPO4, and 4.9 mM L-glutamate) to 1E8 IFU/mL. It was then diluted 10-fold into a freshly donated urine sample to 1x10⁷ IFU/mL. Urine from a healthy human donor (>18 years of age) was acquired and used in accordance with approved Caltech Institutional Review Board (IRB) protocol 15-0566. Written informed consent was obtained from all participants, donations were never tied to personal identifiers, and all research was performed in accordance with relevant institutional biosafety regulations. A 250 µL aliquot from this CT-spiked urine sample was then extracted following the ZR Viral DNA/RNA Kit protocol (#D7020, Zymo Research, Irvine, CA, USA). Briefly, 250 µL of CT-spiked urine was mixed with 250 µL DNA/RNA shield and 1000 µL DNA/RNA Viral Buffer. 1500 µL (750 µL x 2) was added to the column and centrifuged at 16,000 xg for 1 min. Then, 500 µL Viral Wash buffer was added to the column and centrifuged at 16,000 xg for 2 min. Lastly, 60 µL
DNAse/RNAse-free water was added directly to the column and centrifuged at 16,000 xg for 30 s. The eluent was treated by adding 2.5 µL Ambion RNAse Cocktail (#AM2286, Thermo Fisher Scientific) to 47.5 µL template. Stocks were prepared in 0.5x TE buffer and dilutions quantified using the QX200 droplet digital PCR system (Bio-Rad Laboratories, Hercules, CA, USA), outer primers at 500 nM each, and 1x EvaGreen Supermix (Bio-Rad).
Fabrication of thermoelectric unit and mount
A Thermoelectric Module (VT-127-1.4-1.5-72), Thermister (MP-3022), Controller (TC- 720), and 12V Power Supply (PS-12-8.4; TE Tech, Traverse City, MI, USA) were wired according to the manufacturer’s instructions.
While the Peltier can be used out of the box, we manufactured a heat plate and sink to improve the efficiency in the cooling mode. Instructions for fabrication can be found in the Supplementary Materials and Methods, “Fabrication of thermoelectric unit mount.” The ability of the embedded thermocouple to accurately assess temperature of the aluminum block was verified with an independent K-type mini-thermcouple read through a General IRT659K [IR] Thermometer.
Shearing of genomic DNA
Human genomic DNA from buffy coat leukocytes (Roche (via Sigma Aldrich), Reference 11691112001) was fragmented using a Covaris Focused Ultrasonicator M220 (Woburn, MA, USA) equipped with 130 µL microTUBE AFA Fiber Snap-Cap at 50W peak power, 5% duty factor, 200 cycles per burst, for 80 sec. Fragment concentration was determined using a Qbit 3 Fluorimiter (Thermo Fisher, Ref # Q33216) with dsDNA HS assay kit (ThermoFisher, Ref #Q32851), and mean fragment size determined as 365 bp using an Agilent 4200 TapeStation (#G2991AA, Agilent, Santa Clara, CA, USA) and High Sensitivity D5000 ScreenTape (#5067-5592) with ladder (#5190-7747), and D100
ScreenTape (#5067-5584) with High Sensitivity D1000 Reagents (#5067-5585). Dilutions were prepared with a final concentration of 0.5x TE buffer.
Microfluidic chips
Microfluidic chips for dLAMP (#A26316; Applied Biosystems, Foster City, CA, USA) were loaded as we have described previously (23) at a concentration where ~40% of partitions would fluoresce (corresponding to the Poisson maximum single template per partition loading of 660 cp/µL). We estimated the volume of each partition to be 750 pL. To achieve this concentration of template molecules, we diluted template stocks from storage in 0.5x TE to ~0.03x TE for all experiments. Genomic DNA (gDNA) stocks, also stored in 0.5x TE, were diluted to a final concentration of 0.077x. Thus, the total final concentration of TE for all experiments of was approximately 0.1081x TE buffer.
Microscopy data collection
Data were collected in 30-sec intervals using a DMI-6000B microscope (Leica, Buffalo Grove, IL, USA) equipped with a 1.25x 0.04NA HCX PL FLUOTAR Objective and 0.55x coupler (Leica C-mount 11541544). The response from SYTO 9 was recorded using a 1.5- sec exposure through an L5 (GFP) Nomarski prism, while the ROX Reference Dye was collected using a 1-sec exposure through a Texas Red prism. Images were collected using a Hamamatsu ORCA-ER CCD camera (Hamamatsu Photonics K.K., Hamamatsu City, Japan) at 100 gain. Temperature was recoded using the built-in features of the TC-720 Controller in approximately one second intervals and correlated to the images via image metadata.
In these experiments, we chose to use a microscope, instead of the custom real-time amplification instrument we used previously (23,24), because the microscope has superior optical properties (greater pixels per partition and lower exposure time requirements) to access higher temporal resolution and enhanced kinetic measurements.
MATLAB script processing
The MATLAB script processes a .txt file with temperature-time data generated from the TE Tech Controller and a TIF stack containing 2-channel images of the LAMP and melt curve from the LEICA microscope. Partitions are identified using a custom iterative thresholding algorithm, and labels are propagated throughout the TIF stack using a custom labeling algorithm. Average well intensity is tracked over time to generate LAMP curves and plotted against temperature to generate the melt curves. Complete details of the script are in the Supplementary Materials and Methods, “MATLAB script.”
Bulk LAMP reactions were conducted in 10 µL volumes within a well plate on a CFX96 Real-time Thermocycler (Bio-Rad) at buffer conditions and temperatures matching the dLAMP reactions.
Enzymatic digestions of bulk LAMP products were conducted using CAC8I (Ref #R0579S), Hpy166II (Ref #R0616S), ACCI (Ref #R0161S), AciI (Ref #SR0551S), MseI (Ref
#R0525S), and HpyCH4III (Ref #R0618S) purchased from New England Biolabs and were conducted in 50 µl reaction volumes containing 1 µL enzyme, 1 µg DNA, in 1 x Cut Smart Buffer, and incubated for 1 h at 37 °C. Samples were inactivated for 1 h at 80 °C and diluted to 1 ng/µL (~1:300) to run on an Agilent 4200 TapeStation using High Sensitivity D5000 ScreenTape (#5067-5592) with ladder (#5190-7747), and D100 ScreenTape (#5067-5584) with High Sensitivity D1000 Reagents (#5067-5585).
Library preparation and sequencing
300-500 ng of amplified DNA products were fragmented to the average size of 200 bp with Qsonica Q800R sonicator (power: 20%; pulse: 15 sec on/15 sec off; sonication time: 12 min), and libraries were constructed using NEBNext Ultra™ II DNA Library Prep Kit (NEB,
#E7645) following manufacturer’s instructions. Briefly, fragmented DNA was end-repaired,
dA tailed, and ligated to NEBNext hairpin adaptors (NEB, #E7335). After ligation, adapters were converted to the ”Y” shape by treating with USER enzyme and DNA fragments were size selected using Agencourt AMPure XP beads (Beckman Coulter, Ref #A63880) to generate fragment sizes between 250 and 350 bp. Adaptor-ligated DNA was PCR amplified with 5 cycles followed by AMPure XP bead clean up. Libraries were quantified with Qubit dsDNA HS Kit (ThermoFisher Scientific, #Q32854), and the size distribution was confirmed with High Sensitivity DNA Kit for Bioanalyzer (Agilent Technologies, #5067). Libraries were sequenced on Illumina HiSeq2500 in single-read mode with the read length of 50 nt to the sequencing depth of 10 million reads per sample, following manufacturer's instructions.
Base calls were performed with RTA 1.18.64 followed by conversion to FASTQ with bcl2fastq 1.8.4.
Sequencing analysis
Raw FASTQ files were first analyzed with FastQC v0.11.8. Overrepresented sequences were compared with input primer sequences to find reads consisting of potential products from the LAMP reactions. To verify that all adjoining products were accounted for, the FASTQ files were aligned to the predicted products using Bowtie2 v2.3.4.3 with global very-sensitive settings. Unaligned reads were checked for any remaining possible amplification products.
All regions consisting of sequences from multiple primers were tallied by counting the reads with a substring of n=11 from the end of each primer. One adjoining region between primers contained a random insertion of nucleotides and was analyzed by first extracting all reads containing the primer before and after the random nucleotides. The length and sequence distribution of random inserts was then analyzed from the extracted reads.
Results and Discussion
Bulk LAMP studies reveal nonspecific products with high melting temperature (Tm)
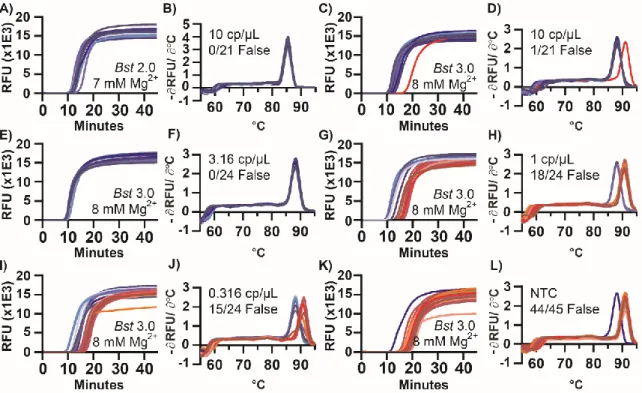
We first wished to test whether melting temperature (Tm) could be used to separate specific and nonspecific amplification in a LAMP assay run in bulk. To start, we selected a concentration near the LOD where we might observe both specific and nonspecific amplification. We used extracted CT genomic DNA in the presence of two commercially available polymerases, Bst 2.0 and Bst 3.0, with CT 23S as the amplification target. At target molecule concentrations of 10 copies per µL (cp/µL), amplification using Bst 2.0 polymerase began between 10-11 min (Figure 1.1A) and had uniform Tm (Figure 1.1B). Amplification using Bst 3.0 polymerase (Figure 1.1C), also yielded amplification from 10-11 min;
however, we also observed a nonspecific amplification at 15 min, defined as having a different Tm than the specific amplification events (Figure 1.1D). This indicated Bst 3.0 could be a useful model for studying nonspecific amplification. We observed that early amplifying products corresponded to specific amplification events, and the later products corresponded to nonspecific amplification, supporting our prediction that we could use Tm as a proxy for sequence identity, as is common with PCR, and has been used previously in LAMP (25-29).
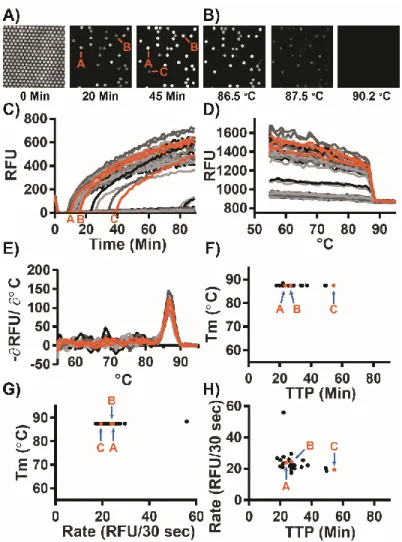
Figure 1.1: Amplification and melting temperature (Tm) curves of Chlamydia trachomatis in a bulk reaction show nonspecific amplification products with high Tm.
Plots of fluorescence as a function of time during a LAMP reaction (A,C,E,G,I,K) and the derivative plot of fluorescence as a function of temperature for the corresponding melting curves (B,D,F,H,I,J). Reactions using Bst 2.0 at 10 copies per microliter (cp/µL) (A,B), and using Bst 3.0 at 10 cp/µL (C,D), 3.16 cp/µL (E,F), 1 cp/µL (G,H), 0.316 cp/µL (I,J), and without template (K,L). Reactions of specific amplification are different shades of blue; nonspecific amplification is different shades of red. The number of false-positive reactions is reported within each panel as N/Nreaction False. NTotal for all conditions = 159 reactions.
Using Bst 3.0 at low concentrations of target is a useful system to study nonspecific amplification. To investigate the role of the concentration of the target on the incidence of nonspecific amplification, we performed half-log dilutions of template from 10 to 0.316 cp/µL. At 3.16 cp/µL (Figure 1.1E-F), only specific amplification occurred (24 replicate
wells/plate). However, once template concentrations reached 1 cp/µL (Figure 1.1G-H), nonspecific amplification occurred with greater frequency than specific amplification (18 of the 24 replicates generated false positives). Similarly, for 0.316 cp/µL (Figure 1.1I-J) 15 of the 24 replicates generated false positives. We next ran the same assay in the absence of template (no-template control, NTC) (Figure 1.1K-L). Even though we did not expect amplification, we observed all reactions amplified. 44 of 45 replicates amplified at a Tm of 91 °C, consistent with the Tm of nonspecific amplification in the presence of template.
Although it is possible for a reaction to generate multiple different nonspecific amplification products, even ones with Tm matching to the specific products, the single amplicon observed at 88 °C in the NTC was a contaminant that appeared to have the same sequence as the specific products (Figure 1.2A [well F8]). In general, when the specific target was present, it amplified sooner and outcompeted the nonspecific amplification, thereby reducing the number of observations of nonspecific amplification. To determine if the nonspecific amplification was inherent to the polymerase or a consequence of buffer selection, we conducted additional studies using both Bst polymerases (Supplementary Figure 1.11 and Table 1-1).
To better understand nonspecific amplification in LAMP, we investigated the sequence identity of the nonspecific products with high Tm using sequencing and gel analysis and compared them with the specific products. The Tm of specific amplification differed between the two polymerases tested. Specific amplification for Bst 2.0 had a Tm of 85.5 °C, whereas specific amplification using Bst 3.0 had a Tm of 88 °C, and demonstrated nonspecific amplification at Tm of 91 °C. The nonspecific amplification had identical Tm to amplification in absence of template (Figure 1.1K,L). Despite the specific amplification products of Bst 2.0 and Bst 3.0 producing similar gel banding patterns (Figure 1.3) and the same sequencing results (see Figure 1.2B), they had different Tm (Figure 1.1B,D respectively). We determined the difference in Tm was due to differences in buffer conditions (Supplementary Figure 1.11 and Table 1-1).
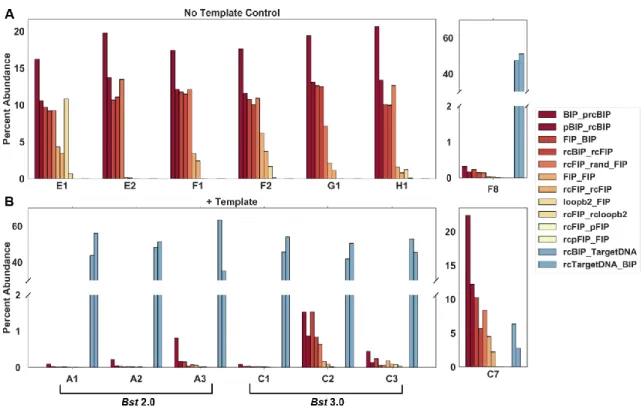
Figure 1.2: Quantification of junctions using next-generation sequencing of select Chlamydia trachomatis amplification products from bulk reactions.
Nonspecific amplification from the no-template control using Bst 3.0 (A), including amplification of a specific target contamination (well F8) corresponding to Figure 1.1K,L. Amplification in the presence of 10 cp/µL template (B), using Bst 2.0 (wells A1-A3) corresponding to Figure 1.1A,B, and Bst 3.0 (wells C1-C3) corresponding to Figure 1.1C,D. Nonspecific amplification in the presence of 10 cp/µL template and Bst 3.0 (well C7) corresponding to Figure 1.1C,D. For a complete list of abbreviations used in this figure, see Supplementary Table 1-2.
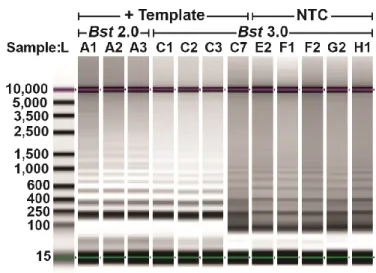
In all bulk reactions, we observed nonspecific products with high Tm. This was surprising because in PCR, primer dimers have low Tm; moreover, in previous demonstrations of LAMP, Tm was lower for nonspecific compared with specific products (27). Thus, we investigated the sequence identity of the nonspecific product with high Tm. We ran the LAMP products on a gel and observed that the characteristic pattern of the specific
amplification products differed substantially from the banding pattern seen in the high-Tm nonspecific products (Figure 1.3). Interestingly, the high-Tm nonspecific product had a ladder pattern resembling that of specific LAMP products.
To determine the identity of the high-Tm nonspecific products, we performed next generation sequencing (NGS). We observed that the nonspecific products lacked the corresponding target sequence and identified the product as a mixture of full-length FIP, BIP, and their complements, as well as fragments of BIP (Figure 1.2A).
To confirm the sequence identity of the amplicon, we targeted the FIP and BIP regions using several restriction endonucleases. Digestion of the specific and nonspecific products resulted in different banding patterns than the undigested samples, and was consistent with the presence of both FIP and BIP endonuclease recognition sites within the sequence (Supplementary Figure 1.12). Specific amplification products were 47% GC; nonspecific amplification products were 53% GC.
Figure 1.3: Composite image of select Chlamydia trachomatis amplification products from a bulk reaction.
Products were collected using D5000 tape on Agilent TapeStation. Amplification in the presence of 10 cp/µL template using Bst 2.0 (lanes A1-A3) corresponding to
Figure 1.1A,B, and Bst 3.0 (lanes C1-C3, C7) corresponding to Figure 1.1C,D.
Nonspecific amplification in the no-template control (NTC; lanes E2-H1) corresponds to Figure 1.1K,L. Contrast was determined using the automatic “scale to sample” feature in the Agilent TapeStation analysis software.
A proposed mechanism for formation of nonspecific product
We hypothesize a mechanism for the formation of the nonspecific product with high Tm originating as a consequence of interactions of the Bst polymerase and LAMP inner primers.
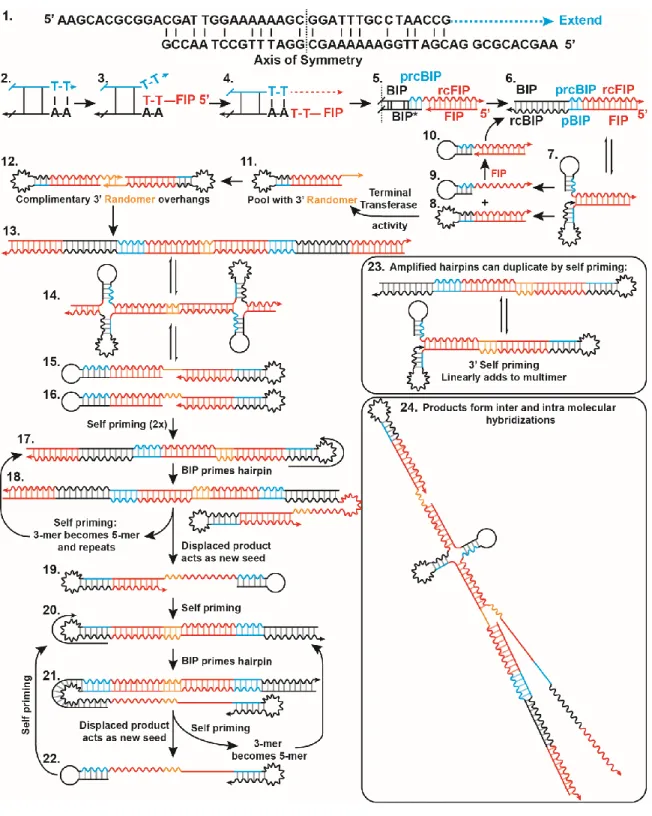
Other potential mechanisms include LIMA (30) and UIMA (31), but are inconsistent with our sequencing results, which observe nearly equal reads of the forward and reverse strand as measured by counting the complementary sequences between each junction. Our proposed mechanism requires properties that have been observed with Bst enzymes: a strand- displacing polymerase lacking 3’-5’ exonuclease activity—common to polymerases from thermophilic bacteria (32,33), template switching ability to allow synthesis across a discontinuous template (33), terminal transferase activity, or the ability to perform non- templated synthesis (32,34,35). Briefly, the nonspecific product likely arises from extension of a low probability homo-dimerization of the Backward Inner Primer (BIP), followed by elongation across a discontinuous junction (“template switching”) to form a double-stranded product incorporating Forward Inner Primer (FIP). Through breathing of the molecule, the 3’ of one strand may form a second hairpin and amplify. Some of these amplification events incorporate several random nucleotides via terminal nucleotidyl transferase activity resulting in a pool of hairpins with 3’ randomers. Sequences with complementary randomers are selected in vitro to amplify. The double-stranded product of this amplification can, through intramolecular hydrogen bonding, form two dumbbell-like structures and amplify in a fashion similar to the standard LAMP mechanism, but primed by BIP. Repetitive cycles of self-priming and hairpin priming by BIP result in numerous sequences with complementarity and the possibility of multiple replication loci within a single molecule. This process can give rise to very long amplicons, and even a branched, mesh-like network from the multimeric
sequences annealing to their neighbors or in a self-complementary fashion. A simplified version of this mechanism, annotated with sequencing data, can be found in Supplementary Figure 1.13.
In more detail, a potential mechanism of formation of nonspecific products is as follows:
Initially, a double-stranded amplicon is generated by homo-dimerization of BIP, and 3’
extension of the homodimer to produce a partial reverse complement of BIP (prcBIP) (Figure 1.4-1). Bst polymerase is highly prone to mismatched extension (36), and the two base pairs of CG provide a sufficient anchoring in the 3’ to start elongation. Multiple Primer Analyzer (ThermoFisher) does not identify the BIP homodimer, unless maximum sensitivity is used. Alternatively, BIP-prcBIP product may arise from a single stranded BIP-hairpin, as has been observed by others (37), although UNAfold (IDT) does not predict the formation of the hairpin for this primer. These structures may not need to be abundant at equilibrium, but as long as they are extended by the polymerase, the product will be stabilized and will accumulate.
Upon accumulation of the BIP-prcBIP construct, the reverse complement of FIP (rcFIP) is incorporated by template switching (Figure 1.4-2). The 3’ of FIP is within spatial proximity of the homo-BIP sequence due to microhomology of to 5’ end of the double-stranded sequence coupled with rapid breathing of two base pairs of TA. This allows temporary insertion and hybridization of FIP with the double-stranded BIP-prcBIP sequence (Figure 1.4-3). When the polymerase is also in proximity of this reaction, FIP slips out of the junction, and the polymerase elongates across the 3’ discontinuous junction (33,35) templated by FIP (Figure 1.4-4). We confirmed the interaction of FIP and BIP produced the high-Tm nonspecific amplification, and that elimination of 3’ microhomology could significantly reduce high-Tm nonspecific amplification (Supplementary Figure 1.14-16, Table 1-3, Table 1-4). After elongation, the FIP which has served as template, is poised to prime in the opposite direction (Figure 1.4-5). This either displaces the initial BIP mispairing (BIP*) or opens the hairpin, resulting in a double-stranded BIP-prcBIP-FIP product (Figure 1.4-6).
This three-part junction is observed as a complete product in NGS data. Breathing of double- stranded BIP-prcBIP-FIP is prone to formation of an intramolecular self-priming hairpin of
rcBIP-pBIP (Figure 1.4-7). Elongation of the 3’ hairpin results in a double-stranded FIP- pBIP-rcBIP-rcFIP hairpin (Figure 1.4-8) and displacement of a BIP-prcBIP-rcFIP hairpin (Figure 1.4-9), which may be primed by FIP to restart this cycle (Figure 1.4-10). With each amplification, and re-prime by FIP, a single product is generated. This process of hairpin accumulation would cause the linear “rinsing” baseline observed by other researchers (37).
Within this pool of linear amplifying products, the Bst enzyme will randomly incorporate additional nucleotides at the 3’ end of FIP-pBIP-rcBIP-rcFIP via terminal transferase activity (Figure 1.4-11). Our sequencing methods are unable to observe a FIP-randomer hairpin because adapter ligation requires double-stranded products. This pool of hairpins with random sequences will accumulate until LAMP selects for sequences that amplify by sharing complementary 3’ “toe holds” (Figure 1.4-12). Much like in vitro evolution, those sequences with the highest probability of amplification are selected (32). The lack of a thermal gating mechanism in LAMP and lack of 3’–5’ exonuclease activity makes the amplification reaction especially prone to in vitro evolution of self-amplifying products. When considered in this light, it is unsurprising that nonspecific amplification could arise from mechanisms similar to the specific products. Within a given bulk reaction, variation in randomer sequence length and identity was low. However, between different samples, randomer sequences of multiple lengths and identities were observed. These two results further suggest that in bulk reactions amplification occurs from one or a few sequences (Supplementary Table 1-5, Table 1-6, Table 1-7).
Elongation from the randomer overhang results in a double-stranded products, leading to dumbbell structures, and LAMP-like amplification. First, elongation of hairpins with complementary randomer toe holds produces a dimer of FIP-BIP-prcBIP-rcFIP coupled through the randomer (Figure 1.4-13). Breathing of the molecule can result in formation of intramolecular hairpins, and eventual disassociation into two separate self-priming, dumbbell shaped hairpins (Figure 1.4-15 and -16). The products of elongation from self-priming amplification doubles the amount of dsDNA present and forms sequences with internal hairpins capable of priming by BIP (Figure 1.4-17). Elongation from BIP priming creates a new double-stranded product and reveals a self-priming 3’ hairpin of the original strand
(Figure 1.4-18), which upon elongation, displaces the sequence primed by BIP (Figure 1.4- 19) while transforming the trimer of FIP-BIP-prcBIP-rcFIP to a pentamer (more than tripling the amount of ds products from structures 15 and 16). The pentamer still contains an rcBIP hairpin, and may amplify in a functionally similar method as previously (Figure 1.4-17). The displaced product Figure 1.4-19 is similar to Figure 1.4-16 but missing 5’-FIP. However, much as with Figure 1.4-16, this products is self-priming and produces a structure with an internal rcBIP hairpin (Figure 1.4-20). A second priming of the hairpin by BIP of the rcBIP- pBIP hairpin and subsequent elongation, creates a new double-stranded product and reveals a self-priming 3’ hairpin of the original strand (Figure 1.4-21). As previously, upon elongation, the sequence primed by BIP is displaced (Figure 1.4-22). Simultaneously, the self-priming event turns the FIP-BIP-prcBIP trimer to a pentamer, which may continue to be amplified by BIP. The released sequence (Figure 1.4-22) is again self-priming, and its product is equivalent to Figure 1.4-20 to restarts the cycle. Further, amplified hairpins may, in addition to BIP priming of the hairpin, duplicate through self-priming by breathing and formation of a 3’ rcBIP-pBIP hairpin (Figure 1.4-23).
The products of these reactions are capable of forming a branched, mesh-like network resulting in the observed high temperature melting. Products may experience random internal priming by through hairpin formation (e.g. Figure 1.4-13,-17,-20), or 3’ self-priming (Figure 1.4-23). Consequently, multiple replication loci may exist within a single strand, and products may have internal stem loop structures (Figure 1.4-24). Furthermore, in addition to intramolecular bonding, the highly repetitive nature of these products allows for melting of fragment, which reanneals to self in a different conformation, or a neighboring strand.
Though the initial steps of generating a double-stranded hairpin will be unique to our particular primer set, once a seed is generated, the processes of template switching and terminal transferase activity should be a general phenomenon associated with nonspecific amplification of thermophilic polymerase resulting in exponential amplification. As evidenced, when the mechanism of seed formation is disrupted through elimination of the microhomology, amplicons with high Tm still occur, albeit with lower frequency and delayed occurrence (Supplementary Figure 1.14-16, Table 1-3, Table 1-4). Template
switching and non-template synthesis are 100x slower than template extension (33).
However, once the self-amplifying products are selected, the reaction follows standard exponential LAMP enrichment. Thus, accumulation of a sufficient pool of randomers may take time, but still result in a delayed bulk exponential amplification event. Furthermore, should a hairpin with attached randomer form, it is possible that the rising baseline, attributed to hairpin formation (37), may also be in vitro selection of the products, leading to and resulting in spontaneous exponential amplification.
Figure 1.4: Illustration of a mechanism for formation of nonspecific amplification products in LAMP reactions.
Putative structures and intermediates are labeled with numbers. Forward sequences are illustrated as a straight line, and the reverse compliment as a wavy line of
matching color. Abbreviations used in this figure: BIP, Backward Inner Primer;
rcBIP, Reverse compliment of BIP; FIP, Forward Inner Primer; rc FIP, Reverse Compliment of FIP; prcFIP, Partial Reverse Compliment of FIP.
Melting temperature differentiates specific and nonspecific reactions in dLAMP
To study specific and nonspecific amplification events at the digital single-molecule level, we developed a new approach that enabled HRM analysis (obtaining “melt curves”) to be performed on each partition. We used a commercially available microfluidic chip with 20,000 partitions and a previously published open-source dLAMP method accessible to most standard laboratories (23) with the following improvements: incorporation of an off-the-shelf thermoelectric unit to both heat and cool the chips, and an enhanced MATLAB script to allow for multicolor tracking. We used the temperature-independent fluorophore ROX to track each partition’s location and the dsDNA intercalating fluorophore SYTO 9 to follow amplification and hybridization status. This two-channel approach is required to follow a partition through both amplification and the entirety of the HRM when fluorescence from SYTO 9 is lost.
As an illustration of the capabilities of our approach, we first used real-time dLAMP to study the kinetic parameters of individual reactions, and we used Tm to classify reaction outcome (Figure 1.5). Using real-time dLAMP, we followed individual partitions as they amplified as a function of time (Figure 1.5A) and then by temperature as they went through HRM (Figure 1.5B). Real-time imaging of individual partitions enables us to reconstruct the standard amplification curves of intensity for each partition as a function of time (Figure 1.5C), and plotting the fluorescence intensity as a function of temperature yields an HRM trace (Figure 1.5D); the negative derivative plot (Figure 1.5E) of this melt trace is the standard melt curve. Analogous to bulk measurements, the standard melt curve is used to classify reactions as specific or nonspecific. We used these classifications to identify important patterns in the kinetics of each type of amplification (Figure 1.5F-H).
We next used real-time dLAMP with HRM to determine whether differences in time to positive (TTP) were due to a difference in amplification initiation or in rate. We expect this information would be valuable for elucidating whether the molecules that lead to bulk amplification are the ones that are first to initiate or the ones that initiate with the fastest rates.
We found that TTP can be heterogeneous while Tm is constant (28.6±8.9 min with 87.5±0.2
°C), indicating that the same product may initiate at different times (Figure 1.5F). This is consistent with our knowledge of the stochastic initiation of LAMP (23,38,39). Further, we observed some variability in the maximum rate despite similar Tm (23.7±6.8 RFU/30 sec, with 87.5±0.2 °C Tm), which indicates the same product may amplify at different velocities.
(Figure 1.5G). In general, we observed that maximum rate often corresponds to the point when the reaction first began to amplify. Finally, by plotting rate as a function of TTP (Figure 1.5H), we observed little fluctuation in rate across a range of different TTPs (23.7±6.8 RFU/30 sec with 28.6±8.9 min), indicating that the differences in TTP are mostly delays in the initiation of amplification rather than differences in the rate of amplification.
The use of real-time data revealed heterogeneity in the timing of amplification initiation and the amplification rate, but homogeneity in Tm, indicating stochasticity in initiation of amplification. In some cases, outlier data points for rate occurred. To determine whether removing these outliers impacted the distribution of enzymatic rates, we performed a non- parametric test (Supplementary Figure 1.17) and found no significant differences in enzymatic rates when these outliers were excluded.
Figure 1.5: Specific amplification in digital single-molecule experiments using Bst 2.0. (A) Fluorescence micrographs of individual partitions are traced over time.
For simplicity, we illustrate a subset of 250 of 20,000 possible partitions at three time points (0, 20, and 45 min). Of the 250 partitions in this micrograph, 30 partitions amplified. Partitions A and B are visible at 20 min; partition C becomes visible at 45 min. (B) Fluorescence micrographs of individual partitions are traced across temperatures during an HRM experiment. As the double-stranded DNA in each partition de-hybridizes, the intercalating dye is released and fluorescence decreases.
(C) Plotting the fluorescence intensity as function of time generates the standard amplification traces of individual partitions generated during a 90-min LAMP experiment. Orange curves correspond to partitions A–C from panel A. (D) Traces
of fluorescence intensity as a function of temperature for individual partitions during melting experiments. By quantifying real-time intensity of individual partitions as temperature increases, melting traces are obtained. Temperature resolution is 1 °C from 55–90 °C, and 0.5 °C from 90–95 °C. (E) The derivative plot of panel d generates the standard melting curve. The temperature at which the derivative maximum occurs corresponds to the “melting point” of the LAMP products in the individual partition. (F) The time each partition reached a fluorescence intensity of 250 RFU (TTP) as a function of temperature. (G) Maximum rate as a function of Tm for each partition. (H) TTP as a function of maximum rate for each partition.
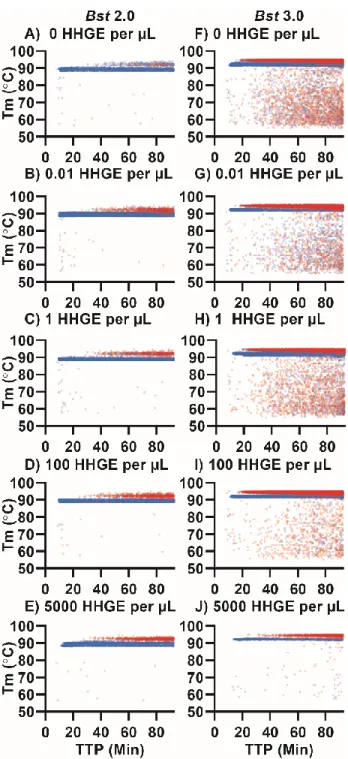
We next asked whether we could observe in dLAMP the same pattern of high-Tm nonspecific amplification and low-Tm specific amplification that we observed in bulk. We performed dLAMP using three chips containing template, and three chips lacking template (NTC), and observed ~55,000 partitions for each condition. Although 60,000 partitions are possible, not all partitions filled nor can all partitions be tracked for the full duration of an experiment. For the melt curve, fluorescence readings were taken at 1 °C increments from 55-90 °C; and at 0.5 °C increments from 90–95 °C to give higher resolution. Due to slight differences in the timing between the heating element and the image collection, some chips were observed at slightly different temperatures (<0.5 °C).
Our approach enabled us to differentiate specific and nonspecific amplification events using HRM. When using the polymerase Bst 2.0 and template (Figure 1.6A, blue points), we observed a large band of amplification in the temperature range 88.5–90.3 °C, in agreement with the Tm observed when performing the reaction in bulk (Figure 1.1). In contrast, the NTC (Figure 1.6A, red points) had very few amplification events in that temperature range (68 out of 51,279 partitions). Hence, we defined events that occurred in the Tm range 88.5–
90.3°C as true positives (specific amplification events), and we defined those that occurred outside this range (in both the NTC and in the presence of template) as false positives (nonspecific amplification events). When using the polymerase Bst 3.0, we observed a large
band of amplification from 91.25–92.75 °C in the presence of template (Figure 1.6B, blue points) that did not correspond with amplification in the NTC (Figure 1.6B, red points), so we defined these as specific amplification events. As with bulk measurements, we determined the difference in Tm between specific amplification events between Bst 2.0 and Bst 3.0 was due to the difference in buffer composition (Supplementary Figure 1.11, Table 1-1).
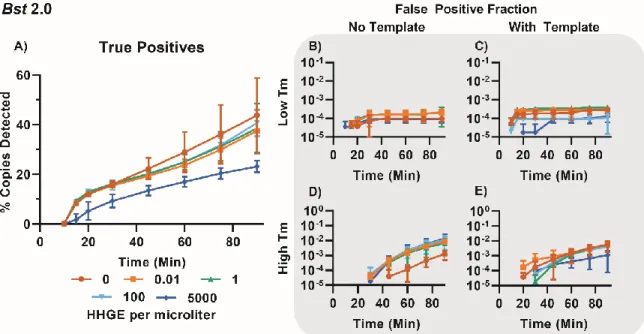
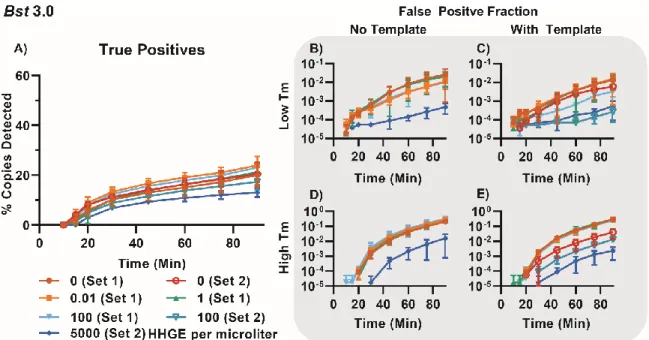
During these experiments, we observed two common patterns. First, the Tm for specific amplification events was 3–5 °C lower in digital compared with bulk measurements. We attribute this difference to temperature calibration; the thermocycler is calibrated to the liquid temperature, whereas the thermoelectric element measures the temperature of the heating element. Second, false positives in the NTC had predominantly high Tm, which we attribute to the nonspecific product we identified in the bulk reactions. We also observed differences in total amplification events between the two polymerases. Assays with Bst 3.0 resulted in substantially more nonspecific amplification than those with Bst 2.0 and confirmed this was not an issue with buffer selection (Supplementary Figure 1.11, Table 1-1). After 90 min, Bst 3.0 yielded 15,200 nonspecific events (out of 54,337 observed paritions) in the NTC, whereas Bst 2.0 yielded only 74 nonspecific events (out of 51,279) in the NTC. Occasionally, outliers occurred in the NTC and would be misidentified as positives by fluorescence and Tm. For Bst 3.0 this occurred in 29 partitions; for Bst 2.0, it occurred in only 3 out of ~55,000 partitions.
Next, we tested whether TTP is different for specific and nonspecific amplification. Because LAMP follows a “winner-takes-all” format, frequent and early nonspecific amplification events may dominate bulk amplification. In general, for both Bst 2.0 and Bst 3.0, specific amplification had earlier TTP than nonspecific amplification, although there was some overlap, mostly >90.5 °C (Figure 1.6A-B). We were able to distinguish the clustering of high-Tm nonspecific products separately from specific amplification using a threshold of 88.5–90.3 °C (Figure 1.6C and Supplementary Figure 1.18A). We illustrate each partition with only partial opacity so that when false positives in the NTC (red) overlap with false positives in the template-containing sample (blue), the overlap of multiple colors appears
purple (Figure 1.6D). Color intensity indicates the abundance of paritions at a given TTP and temperature. To further illustrate how this approach can be used to differentiate specific and nonspecific amplification, we next selected a region where both specific and nonspecific products were observed. For Bst 3.0, we were able to distinguish the clustering of high-Tm nonspecific products separately from specific amplification using the threshold of 91.25–
92.75 °C (Figure 1.6E), and we observed better separation of specific and nonspecific amplification than with Bst 2.0 (Figure 1.6F and Supplementary Figure 1.18B). Both enzymes had highly variable TTP, which we have observed previously (23), and attribute to stochastic initiation of LAMP. Bst 2.0 had both earlier specific amplification and later nonspecific amplification than Bst 3.0. Bst 2.0 reactions containing template generally started at 10 min, whereas nonspecific amplification began at ~40 min. In contrast, Bst 3.0 reactions containing template began at 11.5 min, and nonspecific amplification began at ~20 min.
Next we asked whether there is a difference between the maximum rates of specific and nonspecific amplification. Previously, we demonstrated that rate could be used to correct for some nonspecific amplification using E. coli 23S primers (23), so we wished to test whether we could use maximum rate as a way to differentiate specific and nonspecific amplification.
Generally, specific and nonspecific amplification reactions did not have the same maximum rate. For Bst 2.0, nonspecific amplification tended to have a slower max rate than specific amplification, although there was some overlap (Figure 1.6G). At high Tm, the clustering of nonspecific amplification in both the presence of template and in the NTC were observed at >90.5 °C and below approximatley 50 RFU/30 sec (Figure 1.6H). For Bst 3.0, although there was substantial overlap, we again observed that nonspecific amplification tended to have slower maximum rate than specific amplification (Figure 1.6I). Examining the high- Tm amplification events, nonspecific amplification collects above 92.75 °C and has maximum rate extending out to 75 RFU/30 sec (Figure 1.6J). For both enzymes, overlap between specific and nonspecific amplification was similar, and specific amplification tended to be faster. However, the maximum rate of specific amplification between the two enzymes differed; Bst 2.0 had a maxium rate of 150 RFU/30 sec, whereas Bst 3.0 did not exceed 100 RFU/30 sec. Bst 2.0 performing faster than Bst 3.0 is consistent with our previous observations using an E. Coli 23S primer set (23). Additionally, the maximum rate of
nonspecific amplification in Bst 2.0 tended to be lower than nonspecific amplification in Bst 3.0 (50 and 75 RFU/30 sec, respectively). Consequently, the extent of overlap of specific and nonspecific amplificaiton was greater for Bst 3.0 than Bst 2.0.
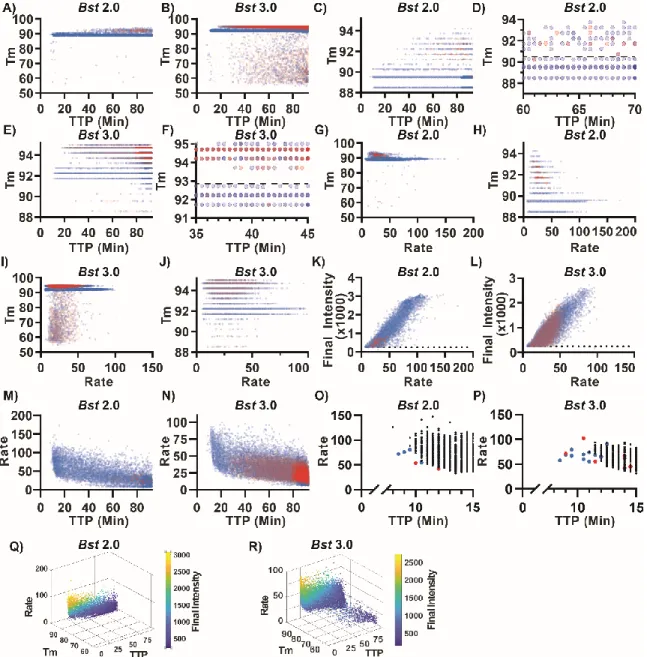
Figure 1.6: Properties of specific and nonspecific amplification using real-time kinetics and Tm.
Blue indicates amplification events in the presence of template, red indicates amplification in the absence of template (NTC). Among these amplification events, true positives were identified using Tm (88.5–90.3 °C for Bst 2.0 and 91.25–92.75
°C using Bst 3.0). Color intensity indicates the abundance of paritions at a given TTP and temperature (partitions in panels A,C,D,G,H,K,M using Bst 2.0 are rendered at 20% opacity in the NTC and in the presence of template; panels B,E,F,I,J,L,N using Bst 3.0 are rendered at 5% opacity in the NTC and 20% in the presence of template.
(A) Tm of individual amplification events as a function of TTP using Bst 2.0. (B) Tm of individual amplification events as a function of TTP using Bst 3.0. (C) Individual partitions with Tm between 88 and 95°C as a function of TTP using Bst 2.0. (D) Individual partitions with Tm between 88 and 95°C and TTP between 60 and 70 min using Bst 2.0. Dashed line at 90.3 °C indicates the upper threshold separating specific and nonspecific amplification. (E) Individual partitions with Tm between 91 and 95°C as a function of TTP using Bst 3.0. (F) Individual partitions with Tm between 91 and 95°C and TTP between 35 and 45 min using Bst 3.0. Dashed line at 92.75 °C indicates the upper threshold separating specific and nonspecific amplification. (G) Tm of individual amplification events as a function of maximum rate using Bst 2.0.
(H) Tm of individual amplification events between 88 and 95°C as a function of maximum rate using Bst 2.0. (I) Tm of individual amplification events as a function of maximum rate using Bst 3.0. (J) Tm of individual amplification events between 88 and 95°C as a function of maximum rate using Bst 3.0. (K) The final intensity of individual amplification events as a function of maximum rate using Bst 2.0. (L) The final intensity of individual amplification events as a function of maximum rate using Bst 3.0. (K-L) Partitions with a final intensity less than 250 RFU (dotted line) were excluded from analyses. (M) The maximum rate of individual amplification events as a function of TTP using Bst 2 and (N) using Bst 3.0. (O) Plot of maximum rate from false-positive amplifications in NTC (red), false positives amplifications in the presence of template (blue) and true-positive amplifications by Tm (black) as a function of TTP using Bst 2.0 and (P) using Bst 3.0. (Q) 3D plot comparing maximum
rate, Tm, TTP, and final intensity of individual partitions using Bst 2.0 and (R) using Bst 3.0.
We observed an unexpected relationship between the final intensity of each partition and the maximum rate of that partition. After 90 min of amplification, a partition should theoretically reach a fluorescence maximum whereby all reagents are consumed, amplification plateaus, and thus the final intensity would be independent of the maximum rate of amplification.
However, surprisingly, we observed a general scaling between the maximum rate and the final intensity of the partition. For Bst 2.0, all amplification in the NTC has final intensity less than 1017 RFU and maximum rate less than 53.4 RFU/30 sec. In the presence of template, 79.7% of nonspecific amplification and 52.3% of specific amplification had final intensity and maximum rate less than these thresholds. For Bst 3.0, 87.7% of amplification in the NTC has final intensity less than 1017 RFU and maximum rate less than 53.4 RFU/30 sec. In the presence of template, 89.0% of nonspecific amplification but only 45.6% of specific amplification fell within these thresholds using Bst 3.0. Thus, false positives were generally dimmer and had slower maximum rates than most true‐positive events. When examining the brightest partitions, Bst 2.0 (Figure 1.6K) and Bst 3.0 (Figure 1.6L) exhibit a similar maximal final intensity near 3000 RFU. These maxima are also surprising, considering our 12-bit camera is capable of imaging up to 4096 RFU (the detector was not at saturation). We suspect that this maxima corresponds to consumption of one of the reagents; while scaling between maximum rate and final intensity occurs when stochastically initiated reactions have not completely amplified, resulting in partitions dimmer than the maxima and proportional to their rate of amplification.
During these dLAMP experiments, we also observed a relationship between maximum rate and TTP. In bulk reactions, the first and fastest amplification event determines the reaction outcome by consuming all of the reagents. Thus, we hypothesized that reaction conditions that promote fast and early amplification in the NTC would lead to a high false-positive rate in bulk and thus misidentification of amplification. In both Bst 2.0 (Figure 1.6M) and Bst 3.0 (Figure 1.6N) we observed a general trend of fast amplification events occurring earlier,
and slow events occurring later. In Bst 2.0, we observed greater heterogeneity in TTP and rate than in Bst 3.0. Furthermore, nonspecific amplicons in the NTC tended to produce slower and later amplification events. Occasional outliers occurred at both fast and early times.
Next, to explicitly test whether fast and early events correspond to specific amplification, we analyzed the relationship between a partition’s TTP, its maximum rate, and Tm. In the first 12 min of amplification, we observed six nonspecific amplification events in Bst 2.0 (four in the presence of template; two in the NTC; Figure 1.6O), and we observed 13 nonspecific events in Bst 3.0 (10 in the presence of template; three in the NTC; Figure 1.6P). For both polymerases, we were able to distinguish the rare, fast, and early nonspecific amplicons from true positives. For Bst 2.0, these nonspecific amplifications were slower than the fastest true positives, and occurred at similar times. In contrast, for Bst 3.0, the earliest amplification events were false positives and tended to have similar rates to the true positives. We hypothesize that in bulk reactions, the fast and early nonspecific amplification events (as seen in Bst 3.0 Figure 1.6P) lead to nonspecific measurements, whereas nonspecific amplification that coincides with specific amplification, but proceeds at a slower rate (as seen in Bst 2.0 Figure 1.6O), would still produce specific amplification in bulk. This hypothesis is corroborated by sequencing of bulk LAMP reactions (Figure 1.2). Though individual bulk reactions may be assigned a homogeneous label as “true positive” or “false positive” by Tm, sequencing identifies multiple products within each reaction, and the Tm is determined by the dominant product. For example, we observed a “false positive” by Tm (Figure 1.1C-D), despite the presence of template. The sequencing of this product, contained nonspecific product sequences, similar to those observed in the NTC, at high prevalence, as well as the specific target sequences in low abundance (Figure 1.2 [well C7]). Similarly, though “true positive” is assigned to other bulk reactions in the presence of template, the nonspecific products are still observed at low abundance (Figure 1.2 [well F8]). Further, a greater number of nonspecific partitions in digital using Bst 3.0 as compared to Bst 2.0, is correlated with a greater number of nonspecific reads despite the presence of template in the sequencing data (Comparing Figure 1.6A-B and Figure 1.2B group A vs C). We hypothesize that the combination of real-time parameters (such as rate and TTP), combined with the ability of
digital assays to yield probabilities and to assign reaction identity through HRM, may ultimately help researchers optimize bulk reaction conditions.
A complex interplay exists among TTP, max rate, final intensity, and Tm
To better visualize how TTP, max rate, final intensity, and Tm data are interrelated, we next plotted these data in a four-dimensional (4D) space (Figure 1.6Q-R, Supplementary Videos S1 and S2 available online). We observed that among all partitions, regarless of if the product was specific or nonspecific amplificiation, fluorescence was brighter when amplification occurred earlier and faster. This was true for both polymerases. Additionally, we observed two types of nonspecific amplification. The first type of nonspecific was the traditional “primer-dimer” cloud, which is characterized by a low Tm, low final fluorescence intensity, a slow max rate, and a generally late TTP. The second type of nonspecific cloud matches only in its high Tm, and spans a wide range of rates, TTP, and final intensities. The high-Tm nonspecific amplification occurs with greater frequency than the low-Tm nonspecific amplification. The major differences between the polymerases can also be resolved with this visualization. The number of nonspecific amplification events is much fewer for Bst 2.0 than for Bst 3.0. Further, these nonspecific events in Bst 2.0 never achieve same fluorescene intensity or maximum rate as with Bst 3.0. We include the 4D representation as part of our MATLAB code, and as videos in the SI.
Classification of true or false positives enables optimal analysis parameter selection
We next asked whether using a combination of digital real-time parameters, in conjunction with Tm, could be used to improve the performance (LOD) of a dLAMP assay. For any given assay, there is a large combination of possible parameters (e.g. amplification rate, TTP, fluorescence intensity) that are used to determine when a digital partition is ”on” or ”off.”
Use of these parameters and selection of thresholds will influence assay performance
(analytical specificity and sensitivity). Assay performance is affected by amplification time and the combination of choices of parameters used to process the data impacting LOD, the probability of detecting a molecule (efficiency), and the clinical sensitivity and specificity.
Having established that there is a direct relationship between Tm, sequence identity, and structure, we determined that Tm allows us to explicitly differentiate specific and nonspecific amplification in dLAMP, and thus, differentiate true from false positives.
We foresee two separate situations of dLAMP analysis using HRM. The first is where HRM is not incorporated in the final assay, but is used during assay development. Second is the ideal situation for quantitative performance, where HRM is incorporated into the final LAMP assay. We expect the first group of LAMP assays to exist because collecting Tm data adds additional time to an assay and requires more advanced hardware to run. This may be unideal in situations requiring more rapid diagnostics or limited-resource and field settings where the hardware may be impractical. Nonetheless, running HRM is still useful during LAMP assay development to select the optimal combination of parameters for end-point or real-time LAMP without using Tm. Hence, Tm allows one to identify the correct combination of assay parameters, and how to analyze the data for best LOD.
LOD is a key parameter when optimizing clinical assays because pathogen load is low in many infections (e.g. in blood infections or asymptomatic sexually transmitted infections).
We thus illustrated the optimization of parameters using improved LOD as the selection criteria. The combination of real-time dLAMP with HRM can uniquely define LOD because of the combination of digital and Tm. Unlike bulk assays, which require a concentration titration curve (and are thus dependent on integrated signal intensity and enzymatic turnover), digital assays only require that an event (target molecule) is or is not observed, and can be counted relative to the partition volume (40,41). The minimum LOD for any digital assay corresponds to one target or amplification event per partition volume. Hence, we can define LOD from a single concentration point by Eq. 1:
Equation 1-1
where CTrueis theconcentration of target molecules loaded by ddPCR counts in copies per microliter, NTrue is the number of true positive (specific) amplification events observed on a chip, NFalse is the number of nonspecific amplification events observed on a chip, and NCI is the number of expected molecules for a given confidence interval. In this equation, the NTrue
and NFalse are chip-specific, and take into account the total volume of the chip, the number of partitions, and the volume of partitions. Furthermore, in Eq. 1, amplification efficiency is implicitly taken into account via the NTrue parameter (in other words, for a less efficient amplification process, a given CTrue on a given chip would lead to a lower value of NTrue).
Finally, for simplicity, Eq. 1 makes the assumption that the measurements are performed at sufficiently low concentrations (as is typical for LOD experiments) that only a very small fraction of occupied partitions contain more than one molecule, and therefore, there is a linear relationship between CTrue and NTrue.
The concentration loaded, CTrue, generates N total counts of both true- and false-positive events. We can divide this concentration by the minimal number of counts needed to identify a specific amplification event and define this as the LOD. The minimum number of counts needed to guarantee a specific amplification event is observed is determined by NTrue, NFalse, and NCI. NTrue and NFalse are determined empirically, whereas NCI is calculated from the desired expected number of molecules that will yield at least one detection event for a given confidence interval (NCI) from the Poisson equation. If we require a 95% CI to observe a true positive across an entire chip, the minimum number of counted events is 3 (i.e. 5% of the time, the Poisson expected loading of 3 target molecules will still measure zero events). For a 98% CI, NCI would be 4 counts. Hence, all true-positive counts in excess of NCI are counts observed above the LOD. Uncertainty in the LOD is given by Supplementary Equations S1- S2.
Counting only true positives does not account for interference from false positives. In order to meet our minimum counts for detection, our equation must remove false counts (NFalse.) The generally accepted procedure for LOD calculations with a 99.7% CI is to assign NTrue
only when the counts exceed the background plus three standard deviations of the background (𝑁𝐹𝑎𝑙𝑠𝑒 + 3 × √𝑁𝐹𝑎𝑙𝑠𝑒). We approximate the variance in the background using the counting error as three times the square root of the number of false-positive events counted and subtract those counts from the true-positive counts to yield the equation.
Using this calculation of LOD to optimize an assay has three limitations. First, Eq. 1 fails to produce a number with physical meaning when the number of true-positive events (NTrue) is less than the number of false-positive events plus three times the standard deviation in false amplification (𝑁𝐹𝑎𝑙𝑠𝑒 + 3 × √𝑁𝐹𝑎𝑙𝑠𝑒). In this case, it is not possible to conclusively observe a true positive, and the LOD becomes irrelevant. Second, Eq. 1 gives an absolute LOD. The numerator (concentration of template molecules loaded on the chip, as determined by PCR) is corrected for the probability of observing a molecule amplify (efficiency) by the true- positive counts. NFalseaccounts for the nonspecific amplification, and NCI accounts for the Poisson probability associated with loading a target molecule. Third, this equation is specific to digital assays.
We first sought to demonstrate the selection of optimal parameters for situations where HRM is not incorporated into the final assay. Using this process, one can pick any threshold and use Tm to determine the optimal trade-off between true and false positives. All initial experiments testing the utility of LOD, juxtaposed against receiver operating characteristic (ROC) curves, to identify optimal parameters were done using Bst 3.0. We began by determining the optimal thresholds for max rate, fluorescence intensity, and amplification time. We demonstrate optimization of all three parameters, using Tm as the arbiter, to illustrate the utility of our method.
We tested the use of ROC curves (commonly used to indicate clinical sensitivity and specificity) to compare the performance in response to a given parameter. ROC curves provide a visual representation of the ability to distinguish between a true-positive and false-
positive event, as a function of a given threshold, but can be difficult to use for optimal selection of LOD. ROC curves show the fractions of true and false positives, where the true- positive fraction is the number of true positives at a given threshold out of the total number of true positives observed by Tm; and the false-positive fraction is the number of false positives counted at the given threshold, divided by the total number of false positives observed by Tm. A perfect classifying test will yield the largest true-positive fraction and smallest false-positive fraction.
When plotting the ROC curve for maximum rate (Figure 1.19A), we observed that rate initially performs very well for eliminating false positives (the false-positive fraction is very small for very high rates). However, as the digital threshold (analogous to ROC “cut-point”) for rate decreases, a greater number of both false and true-positive values are counted. Closer examination of this range of thresholds (Figure 1.19B) emphasizes the Youden Index at 34.6 true-positive fraction and 4.6 false-positive fraction as a possible choice for optimum threshold, although the assay performance in terms of LOD is unclear. The choice for optimal final-intensity threshold is even less clear with the ROC curve (Figure 1.19C), as the ROC curves do not give clear indication of the optimal LOD (the ROC curve is a gentle concave slope). Even relatively high fluorescence thresholds do not give indications of the optimal cut-point (Figure 1.19D).
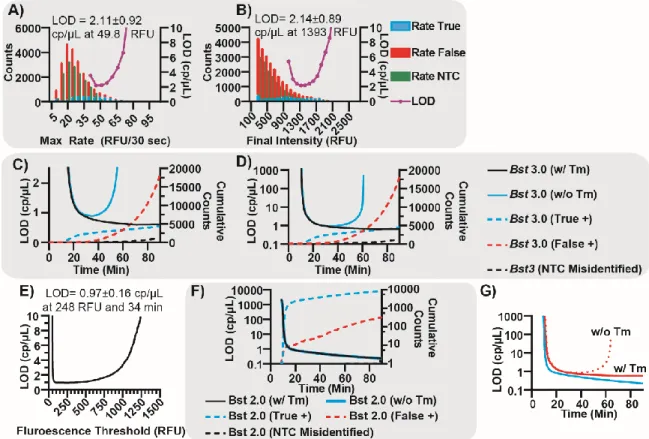
Filtering using LOD revealed a clear optimum. We plot the total number of events for both true and false positives and LOD as a function of maximum rate (Figure 1.7A). The LOD curve revealed a clear minima, corresponding to the optimal cut-point using rate. Selecting the threshold of 49.8 RFU/30 seconds generated an LOD of 2.11±0.92 cp/µL. Similarly, plotting LOD against final intensity resulted in a clear minima, despite the histogram appearing as a continuum and the cut-point being thus ambiguous (Figure 1.7B). Using final intensity, an LOD of 2.14±0.89 cp/µL can be achieved at 1393 RFU.
The ROC curve for TTP presented a narrow range of thresholds, with ~50% true-positive fraction and 2% false-positive fraction, although the precise optimal threshold was not obvious (Figure 1.19E). To refine this threshold, we plotted the LOD and the cumulative