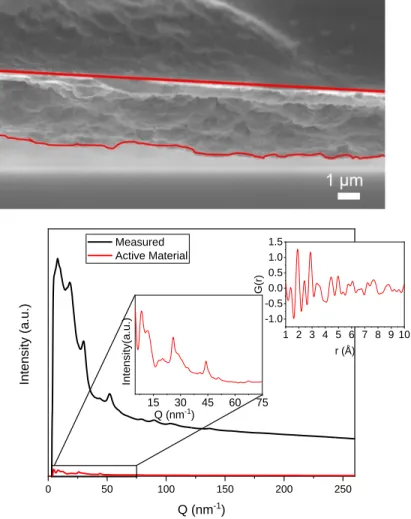
Images of the MnO2 flake cross section and FIB section were provided by Dr. K. Wang of Alfred University performed. Significant changes to the spectra occurred during cycling, specifically broadening of the 650 cm-1 band and increase in the intensity of the 720 cm-1 band.
INTRODUCTION
M OTIVATION
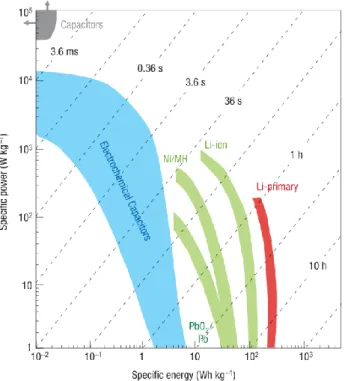
Supercapacitors currently have higher power densities than batteries.8 However, improvements in the capacitance and voltage windows of cathode materials are needed to achieve higher power densities. The higher energy density will allow supercapacitor devices to operate on comparable time scales to current battery devices.
E NERGY STORAGE DEVICES
- Batteries
- Supercapacitors
Supercapacitors, also known as electrochemical capacitors or ultracapacitors, are energy storage devices that provide higher energy density than traditional capacitors, provide more energy than batteries, and can be replaced hundreds to thousands of times while still retaining much of their original capacitance . Typical lithium-ion batteries have an energy density of 200 Wh/kg, while EDLCs and pseudocapacitors have an energy density of less than 10 Wh/kg and 30 Wh/kg, respectively.15 EDLCs have better capacitance retention at high cycle counts.
S UPERCAPACITOR MATERIALS
- EDLCs: activated carbon
- Pseudocapacitors: transition metal oxides, dichalcogenides, and MXenes
The porous nature of activated carbon increases the specific surface area of the material, and since these materials store charge through electrostatic charges at the interface, the pores generally improve capacitance. The redox-active nature of ruthenium combined with the high theoretical capacitance of both RuO2 (1450 F/g) and RuO2 • 0.5H2O (1360 F/g) has captured the interest of the energy storage community in recent years.17 RuO2 remains the basis for.
Pyrolusite consists of corner- and edge-shared octahedra forming 1 x 1 tunnels and is isostructural with TiO2 (rutile). Romanechite and todorokite are also composed of edge-shared octahedra that form 3 x 2 and 3 x 3 tunnels, respectively.
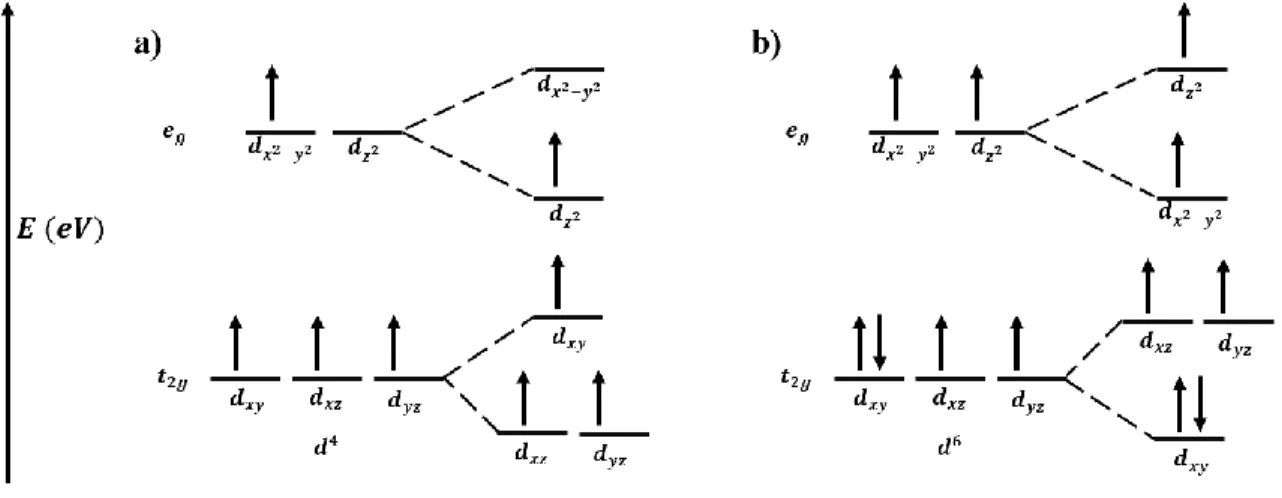
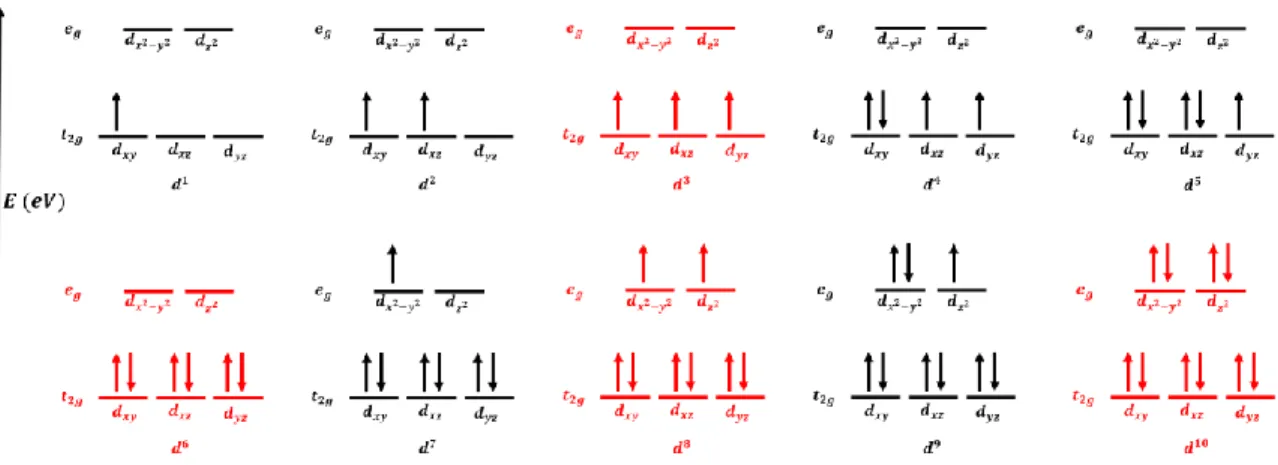
J AHN -T ELLER EFFECT
When orbitals without a z dependence are stabilized by lowering their energy state, and the M – O bonds contract in the z direction. Such elongation in the z direction is caused by the greater electronic repulsion in the orbitals along.
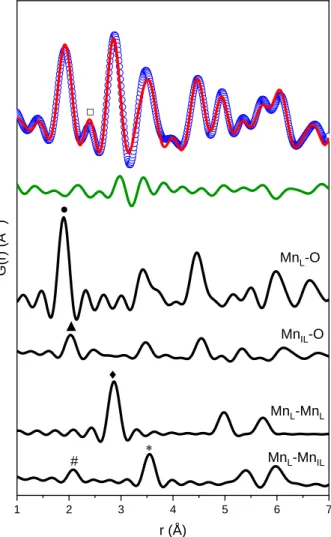
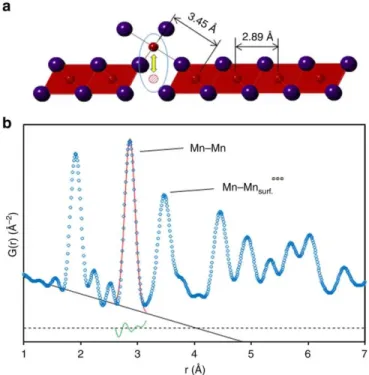
The in-plane Mn - Mn in-plane distance of 2.89 Å and the in-plane Mn - Mn out-of-plane distance of 3.45 Å are well within the range of resolution. These mechanical changes have a negative impact on the electrochemical properties where the capacity of MnO2 electrodes made with α-MnO2 decreased compared to -MnO2.59.
L AYERED PEROVSKITE NANOSHEETS
I N - SITU CHEMICAL AND STRUCTURAL CHARACTERIZATION METHODS FOR
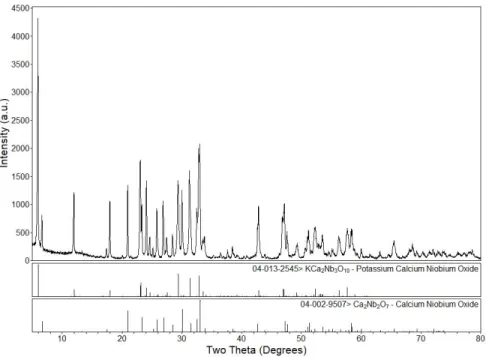
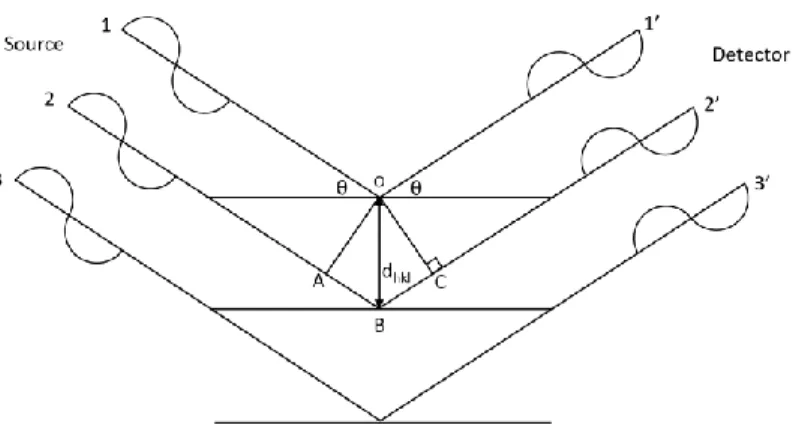
- X-ray Diffraction
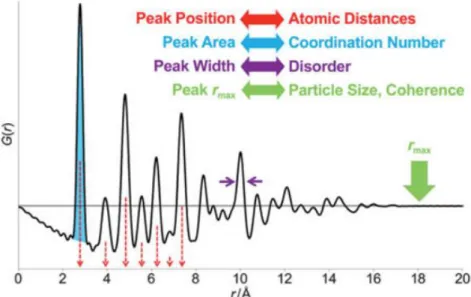
- Pair Distribution Function
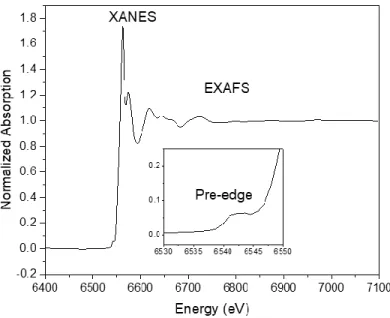
- X-ray Absorption Spectroscopy (XAS)
- Raman Spectroscopy
These modulations are characteristic of the binding environment and ligands coordinated to the atom of interest. The Stokes Raman band appears on the high-energy side of the Raleigh line in the Raman spectra.
SYNTHESIS AND PROCESSING OF DEFECT ENGINEERED -MNO 2
- I NTRODUCTION
- S YNTHESIS AND P ROCESSING
- Electrophoretic deposition (EPD) electrodes
- C HARACTERIZATION
- R ESULTS AND D ISCUSSION
- Controlling defects via equilibration in a pH controlled environment
- Controlling degree of restacking in flocculated nanosheets
- Surface morpology
- Pore structure of freeze-dried and air-dried at 60 °C floccules
- TBAOH removal from interlayer
- C ONCLUSIONS
Surface characteristics remained consistent between drying methods and defect content; however, changes in the degree of restacking of the flocs led to slightly different surface morphologies. Acid addition rate during flocculation does not change the degree of restacking as reflected in the FWHM of the (001) diffraction peak.
SOLID STATE SYNTHESIS AND WET CHEMICAL PROCESSING OF
I NTRODUCTION
Flocculation of nanosheet suspensions is often achieved by adding acid or base to remove the surface charge on the colloids. Materials with a higher atomic mass generally have a lower isoelectric point.82 Flocculation can also be achieved by adding salt solution, or by mixing different nanosheet suspensions with oppositely charged surfaces. Charged defects can also be introduced during flocculation by equilibrating the suspension in a pH-controlled environment.
S YNTHESIS & P ROCESSING
- Ca n+1 Mn n O 3n+1 (n= 1, 2, 3)
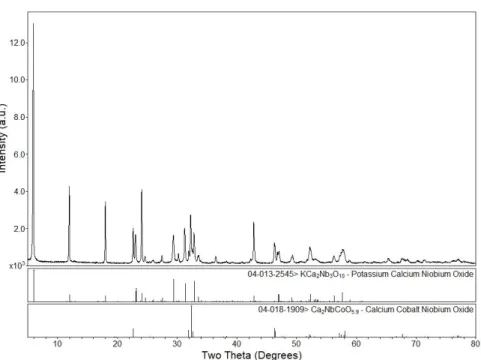
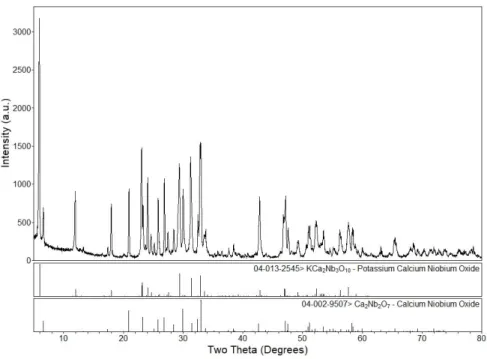
- KCa 2 A 3 O 10 (A = Ta, Nb)
- K(Ca 0.85 Ag 0.15 ) 2 Nb 3 O 9.85 and KCa 2 (Nb 0.85 B 0.15 ) 3 O ~10 (B = V, Cr, Mn, Co)
- K(Ti 0.85 Mn 0.15 )NbO 5 and K 3 (Ti 0.85 Mn 0.15 ) 5 NbO 14
- Ba 4 Mn 3 O 10
- Na 0.7 CoO 2
- Na 0.7 (Co 0.85 Mn 0.15 )O 2
- Carbon electrodes
After 4 h of proton exchange was completed, powders were washed three times in DI water (12,000 rpm for 10 min and decanted the rinse water) and dried on a hot plate at 55°C. After the third 4 h proton exchange, powders were washed three times in DI water and dried on a hot plate. These powders were mixed in isopropyl alcohol in a micronizer mill for 30 minutes and dried on a hot plate.
E XPERIMENTAL CHARACTERIZATION
R ESULTS AND D ISCUSSION
- Attempts to synthesize Dion-Jacobson K(Ca 0.85 Ag 0.15 ) 2 Nb 3 O 9.85 and
- Attempts to synthesize K(Ti 0.85 Mn 0.15 )NbO 5 and K 3 (Ti 0.85 Mn 0.15 ) 5 NbO 14
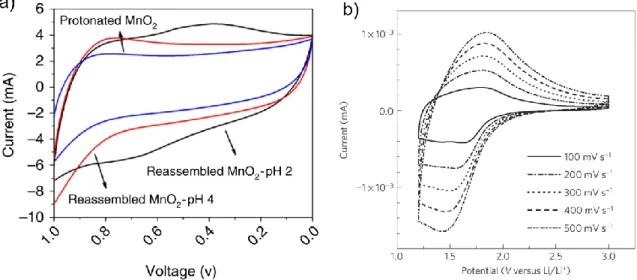
Because there was no increase in the interlayer spacing of the protonated powder, the increase in capacitance was probably caused by a reduction in the Mn from 4+ to 3+. CV loops contained no redox peaks and were mostly rectangular for both parent and proton-exchanged powder (Figure 42). As a result of proton exchange, there was an increase in the interlayer spacing and a reduction in oxidation state of the transition metal, which is known to improve electrochemical properties.
I NTRODUCTION
The unique design provides a higher mass of active material in the X-ray beam to address the challenge of thin film studies. 118 The thickness of the active material in button cells ranges from tens to hundreds of μm, which is much larger than the EPD supercapacitor electrode thickness of 4 μm used in the current study.122. The amount of active material in the beam is of the order of 20 μg, so the charge storage material during electrochemical cycling is very small.
T HE EXPERIMENTAL ELECTROCHEMICAL CELL
- Mounting plate
- Front and back face
- Working electrode
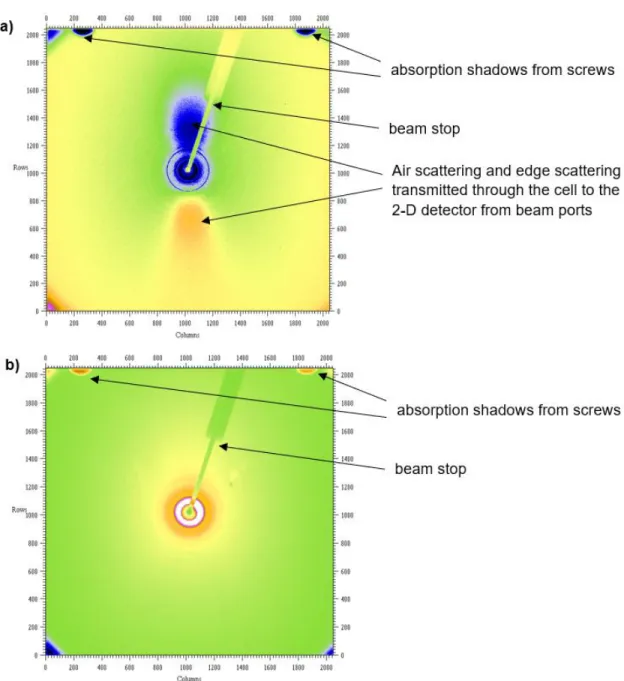
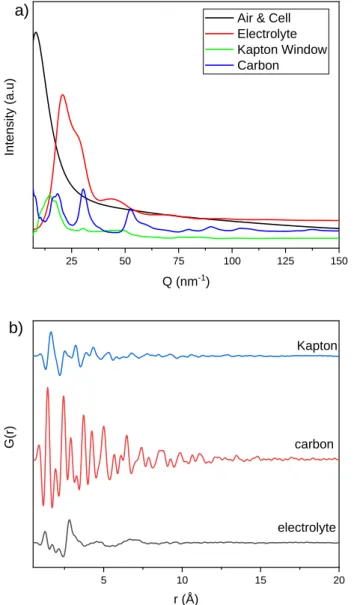
It is necessary to measure the scattering of all components in the beam path, preferably independently, due to the extremely small sample mass in the beam. For PDF work (and 2D XRD work), air scatter, edge scatter and scatter from any component of the sample cell in the beam path can be recorded on the 2D detector. The distance of the beam-defining slits and the front plate of the output port of the electrochemical cell was on the order of 2 cm, so some air scattering in front of the cell is expected.
E XPERIMENTAL DETAILS
Indeed, recent work has shown that dissolution of even interfacial hydration shells on nanoparticles127 and <2 nm solvent restructuring on colloidal nanoparticles is possible under optimized conditions.128 Time-resolved PDF studies of thin film electrodes are difficult due to the short measurement times, although they have been achieved on Pt thin film.129 . necessary to produce as little cell spreading as possible. The substrate and active material composite were attached to the stainless steel cell with Kapton tape and sealed to one side of the cell, while the other side of the cell was sealed with Kapton tape. Mn K-edge X-ray absorption data (active material) were collected at CHESS on beamline C1 using an ion chamber detector.
C ELL P ERFORMANCE
- Baseline electrochemical performance
- X-ray performance
Potassium was also added to the interlayer for in-situ data patterns in the charged state. In the discharged condition, the Mn oxidation state of the less recharged MnO2 flocs equilibrated at pH=2 was 3.50 (A/E). Such expansion and contraction in the basal direction occurred due to the low conductivity of transition metal oxides.
A PPLICATIONS TO IN - SITU STUDIES DURING CYCLING
ELECTROCHEMICAL STRAIN AND CHARGE STORAGE
I NTRODUCTION AND B ACKGROUND
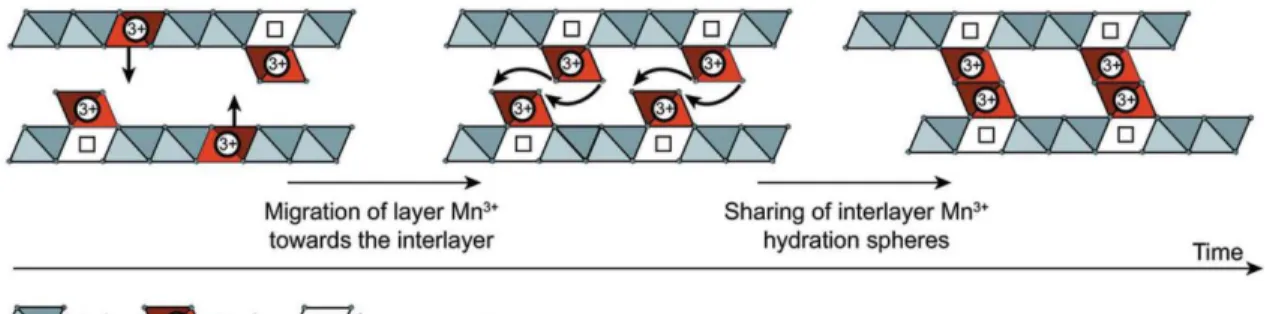
Charged cation defects and vacancies in MnO2 (ramsdellite – 2 x 1 tunnel) were first linked to electrochemical activity in the 1980s, where Mn reduction led to the formation of an α-MnOOH-like 2 x 1 tunnel structure with hydrogen atoms in the tunnels.52 - 54 Charge defects such as O2 vacancies or Mn depletion have been compensated. In the case of Mn3+ reduction, the Ruetschi protons combined with one oxygen to form OH- and replaced O2- in the lattice.52 In addition to the formation of the Ruetschi proton, the transformation to α-MnOOH also changed the shape of the tunnels due to Jahn-Teller. distorted Mn octahedra.55 First-principles calculations of the mineral γ-MnO2 (2 x 1 tunnels and 1 x 1 tunnels) revealed defects that stabilized the MnO2 structure and were more widespread in ramsdelite (2 x 1 tunnels) than in pyrolusite (1 x 1 tunnel), while the charge-compensating Ruetschi protons were characterized as unstable in birnessite.132 Recently, a defect model for δ-MnO2 revealed that reduction from Mn4+ to Mn3+ resulted in Jahn-Teller distorted Mn3+ octahedra moved O6 to the surface, leaving behind a vacancy in the previously pristine slab.56 This work was confirmed by Marafatto and co-workers who studied the photoreduction of δ-MnO2 while exposing Jahn-Teller Mn3+. It is possible that Mn3+ remains in the plate, which is considered a naturally occurring lithiophorite structure.
M ATERIALS AND M ETHODS
- Fabrication of δ-MnO 2 nanostructures
- Characterization of the samples
- Electrochemical measurements
In situ XANES measurements were collected to study the Mn oxidation state of fully charged and discharged electrodes inside a customized electrochemical cell. In situ measurements were performed in a custom electrochemical cell at the Advanced Photon Source at beamline 10-BM (APS, Argonne National Lab). High-cycle in situ Raman cyclic voltammetry measurements were performed at a scan rate of 2 mV/s.
R ESULTS AND D ISCUSSION
- In-situ and in-operando high energy X-ray diffraction
- In-situ pair distribution function studies
- In-situ manganese XANES
- Chemomechanical response to electrochemical stimuli
- In-situ Raman
- Potential conversion to cryptomelane at high cycle number
- In-situ rubidium EXAFS
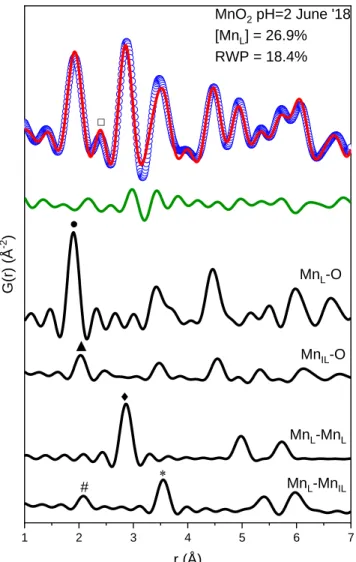
The remaining 40% of the total Mn in the sample was presumably Mn3+ in the slab (Table V). The average oxidation state of the sample equilibrated at pH = 9 decreased from 3.50 to 3.40 when the electrode was charged, a 10% decrease in total Mn4+ in the charged state. Pair distribution function measurements showed that the sample equilibrated at pH = 2 contained 27% Mn3+ charged surface defects.
C ONCLUSIONS
The disorder mainly occurs in the range of 5 Å-1 to at least 13 Å-1 of EXAFS on Rb in 1 M RbSO4 electrolyte. The expansion and contraction of the lattice was caused by Jahn-Teller deformation of the reduced Mn3+O6 octahedra. Finally, the lack of order above 5 Å-1 in EXAFS on Rb ion in RbSO4 electrolyte showed that charged defects do not necessarily serve as low energy adsorption sites, although they do improve electrochemical properties.
SUMMARY AND CONCLUSIONS
Fewer restacked flakes did not undergo this change to the basal direction during electrochemical cycling, suggesting that they may have a higher conductivity; However, -MnO2 flocs with little stacking order experienced an expansion of the lattice in the lateral direction with K+ intercalation at the charged state. This contraction of the basal direction at the charged state is consistent with literature on bulk -MnO2. Electrodes made with highly restacked and less restacked -MnO2 flocs equilibrated at a pH of 2 and 4 experienced a 17% and 13% reduction in oxidation state.
SUGGESTIONS FOR FUTURE WORK
A more complete understanding of this layer-to-tunnel transition would be achieved through HEXRD and PDF synchrotron studies. Although these HEXRD and PDF measurements might require a few weeks of synchrotron beam time, it would be useful to use such tools to better understand the electrochemical transition of layers into the tunnel.
G.; Kim, K.-B., In Situ Mn K-edge X-ray absorption spectroscopy studies of electrolytically deposited manganese oxide films for electrochemical capacitors. M; Jiang, N.; Lin, D.; Dai, L., In situ electrochemical high-energy X-ray diffraction using a capillary working electrode cell geometry. Chang, J.-K.; Lee, M.-T.; Tsai, W.-T., In situ Mn K-edge X-ray absorption spectroscopic studies of anodically deposited manganese oxide with relevance to supercapacitor applications.
APPENDIX
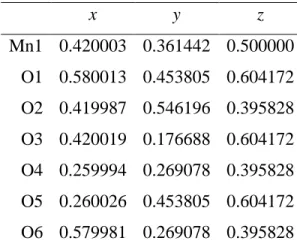
- R EFINED PDF PARAMETERS WITH ESD S FROM SECTION 2.4.1
- C ALCULATIONS FOR TOTAL AREA EXPANSION OF -M N O 2 NANOSHEET
- R EFINED PDF PARAMETERS WITH ESD S FROM SECTION 5.3.3
- I N - SITU R AMAN MEASUREMENT METHODS
This increase is probably caused by Jahn-Teller deformation of the Mn3+O6 octahedra in the sheet. Repeat the same process for other triangles that are part of the Mn4+O6 projection. Sum the area of the triangles that make up the projection on the x-y plane of the Mn4+O6.