Chiral Vibration Bands in104,106Mo and High Neutron Yields for Ba-Mo and Ce-Zr from Spontaneous Fission of252Cf
By
Brooks Musangu Musangu
Dissertation
Submitted to the Faculty of the Graduate School of Vanderbilt University
in partial fulfillment of the requirements for the degree of
DOCTOR OF PHILOSOPHY in
Physics March 31st, 2021 Nashville, Tennessee
Approved:
Professor Joseph Hamilton, Ph.D.
Professor Akunuri Ramayya, Ph.D.
Professor Sait Umar, Ph.D.
Professor David Ernst, Ph.D.
Professor William Holmes, Ph.D.
To my family, friends and mentors, and the whole scientific community.
ACKNOWLEDGMENTS
The work accomplished while at Vanderbilt University was made possible by the help of many people and it would be impossible to name them all. However, it would be very remiss of me if I don’t acknowledge certain key players.
First and foremost, I would like to acknowledge my privilege and opportunity to work with some of the world renown nuclear physicist; Profs. Joseph H. Hamilton and, now retired, Akunuri Ramayya. Their advise and mentorship has helped me grow into a well rounded scientist. I would also like to say thank you to Dr. William Brantley, my academic advisor from Furman University without whom I would not have met Prof. Hamilton. Not forgetting other committee members: Professor Sait Umar, Ph.D., Professor David Ernst, Ph.D. and Professor William Holmes, Ph.D.. Additionally, my former lab mates Drs. En- hong Wang, Christopher Zachary and Jonathan Eldridge. Their continued support fostered a great working environment. Thank you also to our collaborators; Drs. S. Jehangir, G. H.
Bhat, J. A. Sheikh, S. Frauendorf and A. C. Dai.
And lastly, I would like to thank my family for all the love and support their have shown to me. My friends for their support, especially Bubotu Hachitapika, and my church family.
The work at Vanderbilt University and Lawrence Berkeley National Laboratory are supported by the US Department of Energy under Grant No. DE-FG05-88ER40407 and Contract No. DE-AC03-76SF00098. The work at Tsinghua University was supported by the National Natural Science Foundation of China under Grant No. 11175095. The work at JINR was supported by the Russian Foundation for Basic Research Grant No. 08-02- 00089 and by the INTAS Grant No. 03-51-4496. S. F. acknowledges support by the US Department of Energy under Grant DF-FG02-95ER40934.
Thank you, also, to the reader of this thesis.
TABLE OF CONTENTS
Page
DEDICATION . . . ii
ACKNOWLEDGMENTS . . . iii
LIST OF TABLES . . . vi
LIST OF FIGURES . . . ix
1 Introduction: The Fundamentals of Nuclear Physics . . . 1
1.1 The Big Picture . . . 1
1.2 Motivation . . . 3
2 Nuclear Decay . . . 6
2.1 Decay Statistics . . . 6
2.2 Fission . . . 8
2.3 Types of Nuclear Decay . . . 12
2.4 γ-Decay . . . 13
2.4.1 Multipole Radiation and Magnetic Properties of Nuclei . . . 13
2.4.2 Reduced Transition Probabilities . . . 16
2.5 Internal Conversion . . . 19
3 Nuclear Theory . . . 23
3.1 Nuclear Models Describing Excited State Properties . . . 23
3.2 The Shell Model . . . 25
3.3 The Collective Model . . . 26
3.3.1 Rotational Bands . . . 27
3.3.2 Vibrational States . . . 28
4 Experimental Techniques . . . 30
4.1 Gammasphere Efficiency . . . 33
5 Chiral vibrations and Collective Bands in104,106Mo . . . 37
5.1 Introduction To Chirality . . . 37
5.2 Discussion and Results . . . 39
5.2.1 104Mo Spectra . . . 39
5.2.2 106Mo Spectra . . . 60
5.2.3 Angular Correlations . . . 64
5.2.4 TPSM Calculations . . . 67
5.2.5 PES Calculations . . . 80
5.3 Conclusion . . . 89
6 Anomalous Neutron Yields Confirmed for Ba-Mo and Newly Observed for Ce-Zr from Spontaneous Fission of252Cf . . . 90
6.1 Introduction . . . 90
6.2 Previous252Cf Neutron Studies . . . 91
6.3 Hot Fission Mode . . . 92
6.4 Method of Data Analysis . . . 96
6.5 Experimental Results and Discussion . . . 98
6.5.1 Xe-Ru Yields . . . 101
6.5.2 Te-Pd Yields . . . 103
6.5.3 Nd-Sr Yields . . . 105
6.5.4 Ce-Zr Yields . . . 109
6.5.5 Ba-Mo Yields . . . 114
6.5.6 Independent Yields . . . 123
6.6 Conclusion . . . 126
7 Conclusion . . . 127
BIBLIOGRAPHY . . . 129
LIST OF TABLES
Table Page
2.1 Properties and nomenclature for electromagnetic multipole radiation . . . 15
2.2 Correction factors forB(E2)values based on mixing ofγ, β, and ground state properties . . . 19
4.1 Parameters of energy calibration . . . 34
4.2 Parameters of efficiency calibration . . . 35
4.3 Parameters of efficiency calibration . . . 35
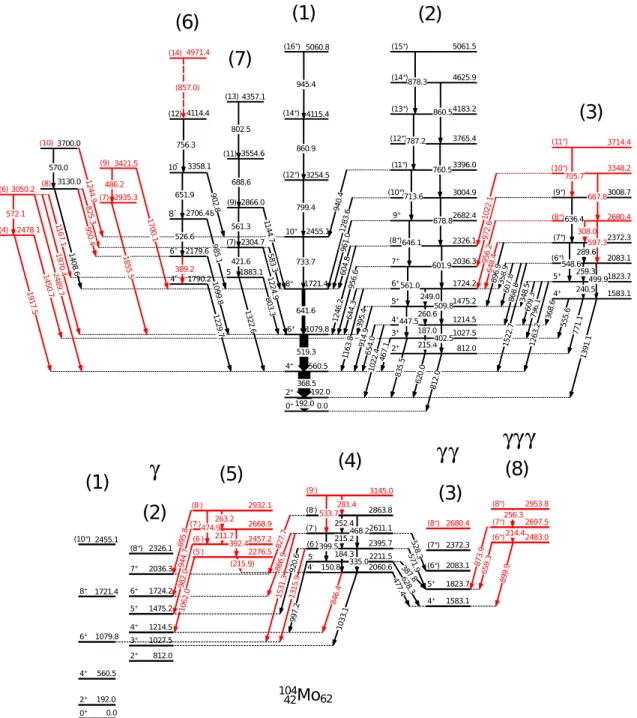
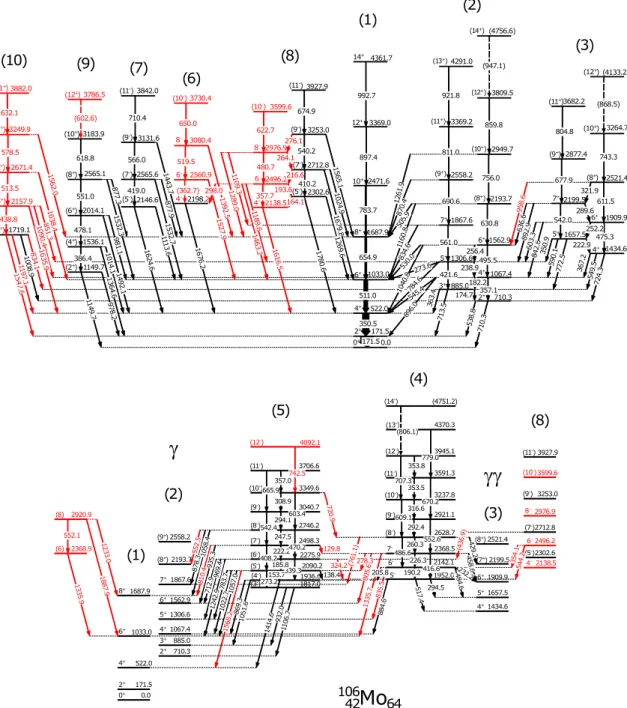
5.1 Level energies andγ-ray energies of104Mo obtained in the current work. Here Ei, Ef, Eγ, Iγ and B correspond to initial level energy, final level energy, γ-ray energy,γ-ray intensity and band number, respectively. Theγ-ray intensities are normalized to the 192.0 keV one. New levels and transitions are labeled with an asterisk. . . 42
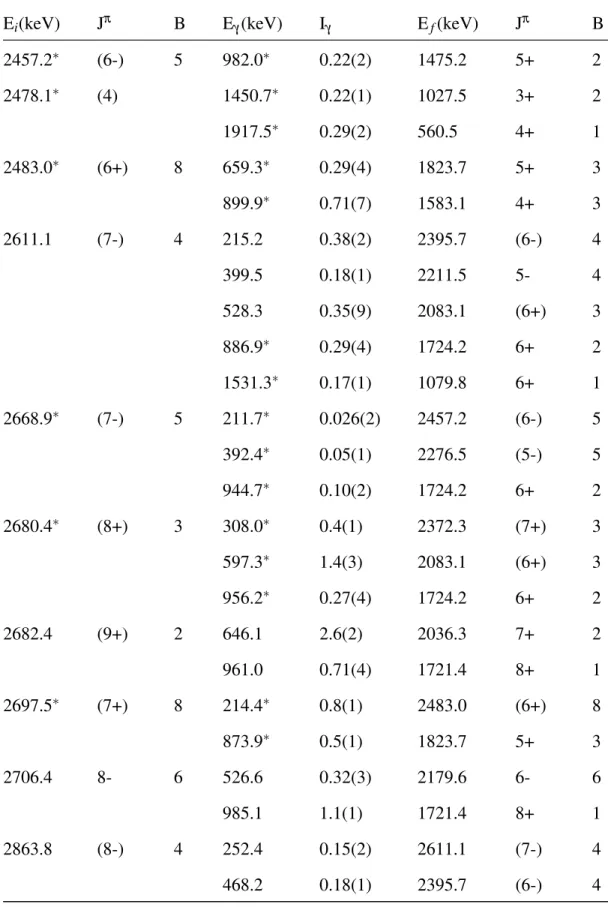
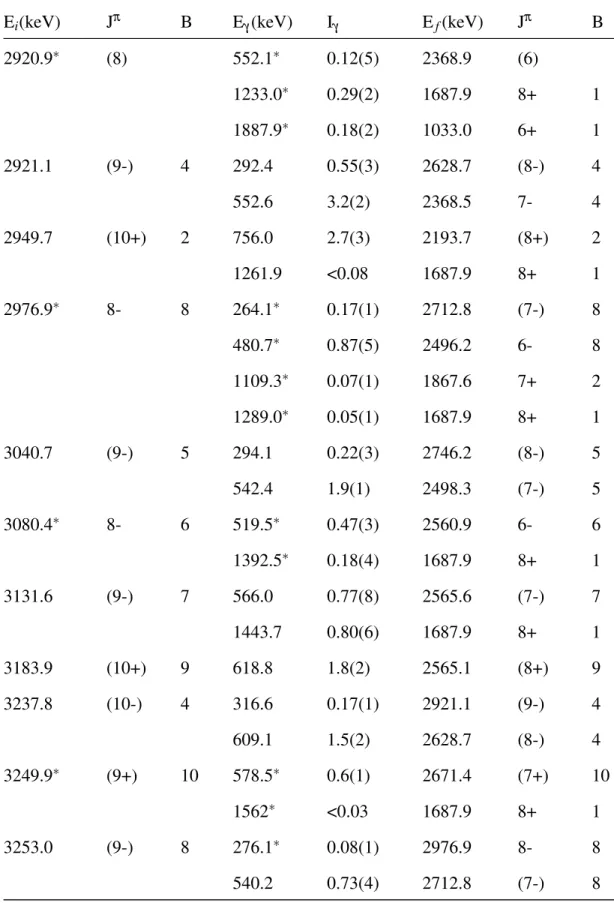
5.2 Level energies andγ-ray energies of106Mo obtained in the current work. Here Ei, Ef, Eγ, Iγ and B correspond to initial level energy, final level energy, γ-ray energy,γ-ray intensity and band number, respectively. Theγ-ray intensities are normalized to the 171.5 keV one. New levels and transitions are labeled with an asterisk. . . 49 5.3 Angular correlations of the104,106Mo nuclei. Here D represents a dipole tran-
sition and Q represents a quadrupole transition. The δ represents the E2/M1 mixing ratios. Other angular correlations from Ref [1] are indicated by an asterisk. 66
5.4 Comparison of the intensities of the expected I → I−1 transitions connect- ing bands 5 and 4 between TPSM calculations and experimental limit. Here B(E2)out corresponds to the calculated values for theI→I−1 transitions con- necting bands 5 and 4, B(E2)in corresponds to the calculated values for the I→I−2 transitions in band 5. . . 78 5.5 Variously lowly excited quasiparticle states in104Mo and 106Mo from the PES
calculations. . . 84 6.1 A list of isotopes whose ground state transition energies were difficult to mea-
sure (because of similar ground state energies or not clearly observed in our data) and what energy transition we measured instead in Nd-Sr fragment pairs. The scaling factor is the relative intensity of the measured transition to the ground state transition; we divided the yield of the transition by this factor to correct it. 99 6.2 A list of the average neutron multiplicities ( ¯ν) and the full width at half maxi-
mum (FWHM) for each pair shown in Fig. 6.6. The average neutron multiplicity distributions are very close to the accepted values of 3.8 for the spontaneous fis- sion of252Cf. . . 99 6.3 New yield matrix for xenon and ruthenium from the spontaneous fission of252Cf. 102 6.4 New yield matrix for tellurium and palladium from the spontaneous fission of
252Cf. . . 104 6.5 New yield matrix for neodymium and strontium from the spontaneous fission of
252Cf. . . 107 6.6 New yield matrix for cerium and zirconium from the spontaneous fission of
252Cf. The 8-11 neutron channels are labeled with neutron numbers as superscripts.110 6.7 New yield matrix for barium and molybdenum from the spontaneous fission of
252Cf. The 8-11 neutron channels are labeled with neutron numbers as superscripts.116
6.8 Part of the major overlapping energies transitions in Ba-Mo pairs that could result in contamination. See text for more instructions. . . 120
LIST OF FIGURES
Figure Page
1.1 Angular momentum configuration in chiral nuclei . . . 3
2.1 Spontaneous fission potential energy surface for252Cf . . . 11
2.2 Internal conversion coefficients vs. energy . . . 21
3.1 Energy level diagram of some excited state of12C . . . 24
4.1 Fragment Yields of252Cf from Spontaneous Fission . . . 31
4.2 Schematics of252Cf SF . . . 32
4.3 Cross section schematics of Gammasphere . . . 33
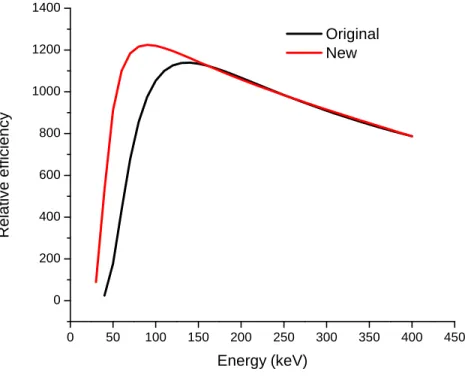
4.4 Figure comparing old and new efficiency curves . . . 36
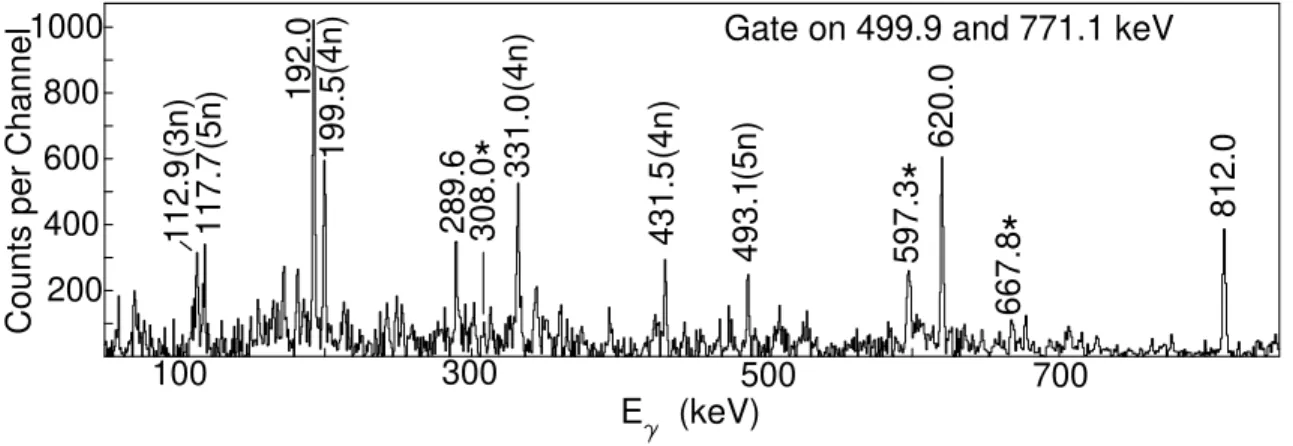
5.1 Partialγ-ray coincidence spectra by gating on 499.9 and 771.1 keV transitions in 104Mo. New transitions are labeled with an asterisk. Fission partner tran- sitions are labeled with neutron evaporation numbers. Here 3n, 4n, 5n denote 145Ba,144Ba and143Ba, respectively. . . 40
5.2 Partial level scheme of104Mo obtained in the current work. New energies and transitions are labeled in red. . . 41
5.3 Partial level scheme of106Mo obtained in the current work. New energies levels and transitions are labeled in red. Note the 1936.6 keV level is placed in band (5) but assigned to band (4) from the current calculation. . . 48
5.4 Partial γ-ray coincidence spectra by gating on (a) 192.0 and 914.9 keV tran- sitions and (b) 835.5 and 447.5 keV transitions in 104Mo. New transitions are labeled with an asterisk. Contamination transitions are labeled with a “c”. Note that the 1180 and 1195 keV transitions are not placed in the level scheme. . . . 58
5.5 Partialγ-ray coincidence spectra by gating on (a) 192.0 and 982.0 keV transi- tions and (b) 192.0 and 1022.4 keV transitions in104Mo. New transitions are labeled with an asterisk. Contamination transitions are labeled with a "c". Note that the 706.4 and 1085.7 keV transitions in part (b) are not placed in the level scheme. Here 2n, 3n, 4n, 5n and 6n denote146Ba to142Ba, respectively. . . 59 5.6 Partialγ-ray coincidence spectra by summing three gates on 171.5 and 350.5
keV, 350.5 and 511.0 keV, and 511.0 and 654.9 keV transitions in the ground state band of106Mo. Hererepresents the transitions populating the 4+ level of the g.s. band, ∆denotes the transitions populating the 6+ state of the g.s.
band,∇represents the transitions populating the 8+state of the g.s. band. New transitions are labeled with asterisks. Contamination transitions are labeled with a “c”. Here 2n represents transitions in144Ba. Note that the 1359.5 and 1633.4 keV transitions are not placed in the level scheme. . . 61 5.7 Partialγ-ray coincidence spectra in 106Mo (a) by gating on the 1780.6, 350.5
and 171.5 keV transitions, and (b) by gating on the 1616.5, 350.5 and 171.5 keV transitions. New transitions are labeled with an asterisk. Fission partner transitions are labeled with neutron evaporation numbers. Namely, 2n, 3n, 4n denote144Ba,143Ba,142Ba, respectively. . . 62 5.8 Partial γ-ray coincidence spectra by gating on 1527.9, 511.0 and 350.5 keV
transitions in 106Mo. New transitions are labeled with an asterisk. Fission partner transitions are labeled with neutron evaporation numbers. Here 2n, 3n, 4n, 5n denote144Ba,143Ba,142Ba and141Ba, respectively. . . 63 5.9 Partial γ-ray coincidence spectra by gating on 438.8, 1008.9 and 538.8 keV
transitions in106Mo. New transitions are labeled with an asterisk. . . 63 5.10 Theγ-γ angular correlations of 477.4 - 771.3 keV (top), and 387.8 - 796.2 keV
(bottom) in104Mo. . . 65
5.11 Comparison of the TPSM calculated energy level to the experimental data.
Energies are normalized to the 4−band head energies of104,106Mo, respectively. 71 5.12 Comparison of the measured energy levels E-0.015*I*(I+1) vs Spin (I) for
104,106Mo with TPSM Calculated values. Data for106Mo has been taken from Ref. [2] and the current work. Here E is normalized to the 4−band head energy in band 4 in104,106Mo, respectively. . . 72 5.13 Plots ofI−0.5 vs rotational frequency ¯hω = (E(I)−E(I−2))/2 for104,106Mo
from the experiment and TPSM calculations. . . 73 5.14 Level energy differencesE5(I)−E4(I)between chiral doublet bands in104,106Mo
from the experiment and TPSM calculations. . . 74 5.15 Comparison of the J(1) moments of inertia in band 4 and 5 between TPSM
calculations and experimental data. . . 75 5.16 Comparison of the measuredB(M1)(µN2)/B(E2)(e2b2)shown as square with
TPSM Calculated values shown as circle for104,106Mo nuclei. . . 76 5.17 B(E2,I →I−1)out values for the transitions connecting bands 5 and 4 from
TPSM calculation. . . 77 5.18 The expectation values of the squared angular momentum components for the
main band (B4) and partner band (B5) for the total nucleus in104Mo. The value γ =100◦was used in order to mitigate small errors caused by the truncation of the configuration space in the TSPM code. The change γ =20◦→100◦only inter changes the intrinsic order of the axes in the code. . . 79 5.19 PES calculations for the (a) ground state, (b) ν 3/2+[411] ⊗ 5/2−[532], (c)
ν 3/2+[411]⊗5/2+[413] and (d)ν 3/2−[541]⊗5/2−[532] configurations in
104Mo. . . 82 5.20 PES calculations for the (a) π 3/2+[301] ⊗ 5/2−[303], (b) ν 3/2+[411] ⊗
3/2−[541], (c) ν 5/2+[413] ⊗ 5/2−[532] and (d) π 1/2+[431] ⊗ 3/2−[301]
configurations in104Mo. . . 83
5.21 PES calculations for the (a) ground state, (b) ν 5/2+[413] ⊗ 5/2−[532], (c) ν 1/2+[411]⊗5/2−[532] and (d)ν 3/2+[411]⊗5/2+[413] configurations in
106Mo. . . 85
5.22 PES calculations for the (a) π 3/2−[301] ⊗ 5/2−[303], (b) ν 5/2−[532] ⊗ 3/2−[541], (c) ν 3/2+[411] ⊗ 1/2+[411] and (d) ν 1/2+[411] ⊗ 5/2+[413] configurations in106Mo. . . 86
5.23 PES calculations for the (a)ν 3/2+[411]⊗5/2−[532], (b)π5/2+[422]⊗5/2−[303], (c)ν 3/2−[541]⊗5/2+[413] and (d)ν 5/2+[402]⊗5/2+[413] configurations in106Mo. . . 87
5.24 PES calculations for the (a)ν 5/2+[402] ⊗5/2−[532] and (b)π 1/2+[431]⊗ 3/2−[301] configurations in106Mo. . . 88
6.1 Neutron multiplicity measurements from Ref. [3] . . . 93
6.2 Neutron multiplicity measurements from Ref. [3] . . . 94
6.3 Neutron multiplicity measurements from Ref. [4] . . . 95
6.4 Schematics of two coexisting fission modes in252Cf . . . 96
6.5 Gate on the 296 and 1279 keV transitions in134Te showing ground state tran- sitions from partner fission fragments of Pd in252Cf. . . 97
6.6 The experimental Ba-Mo, Ce-Zr, Te-Pd and Nd-Sr yield curves from the present analysis are shown above. There is no evidence for the 9, 10 and 11 neutron channels in pairs other than Ba-Mo and the newly observed Ce-Zr. A smooth Gaussian fit to the 0-8 neutron channels in Nd-Sr, Xe-Ru, Te-Pd, Ce-Zr and Ba- Mo is shown. The full width at half maximum (FWHM) was also calculated for each of the yields as shown in this figure. . . 100
6.7 Gamma-ray coincidence spectra by gating on (a) 373.7 and 574.5 keV transi- tions in110Pd to show that there is no evidence for the 9 and 10 neutron channel at 1150.6 keV in133Te and at 974.4 keV in132Te, respectively, whereas there is clear evidence of the 8 neutron channel at 1279.1 keV in134Te which fits to the curve. In (b) a triple gate on 129.7, 251.2 and 338.6 keV transitions in150Nd to show that there is no evidence for the 9 and 10 neutron channel at 986.1 keV in93Sr and at 858.9 keV in93Sr for the Nd-Sr pair, respectively, whereas there is weak evidence of the 8 neutron channel at 836.7 keV in94Sr. And in (c) a double gate on 161.5 and 999.4 keV transitions in 97Zr to show evidence for the 9 neutron channel at 410 keV in146Ce for the Ce-Zr pair. . . 106 6.8 Gamma-ray coincidence spectra by gating on (a) 397.2/541.2 keV, (b) 397.2/709.1
keV, (c) 397.2, 541.2 and 709.1 keV and (d) 541.2/709.1 keV transitions in
144Ce to show that there is evidence for the 10 neutron channel at 1222 keV in98Zr for the98Zr-144Ce pair. In (e), a double gate on 409.9/503.2 keV tran- sitions in 146Ce to show clear evidence of the 10 neutron for the 146Ce and
96Zr pair at 1750.4 keV by gating on 409.9/503.2 keV. And (f) gives further evidence for the presence of the 1750.4 keV transition by gating on 258.3/515 keV . . . 112 6.9 The second curve in Ce-Zr was fitted by fixing the width of the second curve
(presenting the second mode) to the width of the first curve (presenting the first modes) and also fixing the position to 8 neutron channel. It contributes
∼1.0(3)% of the first mode. The second curve in the Ba-Mo fit was also fitted by fixing the width of the second curve to the width of the first curve and fixing the position to 8 neutron channel. It contributes∼1.5(4)% of the first mode. . . 114
6.10 Gamma-ray coincidence spectra by gating on (a) 193.1 and 371.0 keV transi- tions in108Mo to show the neutron inelastic scattering platform, and (b) 602.4 and 529 keV transitions to show the 369 keV in104Mo and 371 keV in108Mo.
Part (b) shows difference between Fig. 1 in Ref. [5] using the same gate. See text for more details. . . 117 6.11 Gamma-ray coincidence spectra by gating on (a) 368.6 and 519.4 keV transi-
tions in 104Mo to show evidence for the 10 neutron channel at 1435.7 keV in
138Ba and in (b) another gate on 368.6 and 641.6 keV transitions in104Mo to give further evidence of the 10 neutron channel in the 138Ba-104Mo. In (c) a gate on 94.9 and 138.1 keV transitions in 105Mo to show evidence for the 9 neutron channel at 1435.7 keV in138Ba for the Ba-Mo pair. . . 121 6.12 Gamma-ray coincidence spectra by gating on (a) 102.8 and 135.5 keV transi-
tions in 103Mo to show evidence for the 11 neutron channel at 1435.7 keV in
138Ba and in (b) another gate on 102.8 and 363.1 keV transitions in103Mo to give further evidence of the 11 neutron channel in the138Ba-103Mo pair. . . 122 6.13 Fission fragments distributions deduced from the fragment pair independent
yields given Ref. [3]. The black filled symbols are from the experimental data in Ref. [3] and the open symbols are from data given in [6] . . . 123 6.14 Fission fragments distributions deduced from the fragment pair independent
yields given Tables 6.4, 6.3, 6.5, 6.6, 6.7. . . 124 6.15 Fission fragments distributions deduced from the fragment pair independent
yields given Ref. [3]. The black filled symbols are from the experimental data in Ref. [3] and the open symbols are from data given in [6] . . . 124 6.16 Fission fragments distributions deduced from the fragment pair independent
yields given Tables 6.4, 6.3, 6.5, 6.6, 6.7. . . 125
Chapter 1
Introduction: The Fundamentals of Nuclear Physics
1.1 The Big Picture
Understanding atomic nuclei is a quantum many-body problem of incredible richness and diversity, and studies of nuclei address some of the great challenges that are common throughout modern science. In this thesis, the role of nuclear physics in providing a better description of the nuclear model will be reviewed in the context of the nuclear structure.
Particular attention will be given to the high spin states of the neutron-rich104,106Mo nu- clei which have been reinvestigated by analyzing the γ-rays in the spontaneous fission of
252Cf with Gammasphere data. The results will show a definite form of a class of chiral vibrational bands. Furthermore, nuclear fission reaction processes will be reviewed in the context of neutron multiplicity yields of Ba-Mo, Ce-Zr, Te-Pd, and Nd-Sr fragment fission pairs. It will be demonstrated that the Ba-Mo and Ce-Zr fragment fission pairs exhibit a rare fission mode known as “extra-hot fission mode”.
The primary goal of science is to build knowledge about the natural world by studying and probing the systems in it, thereby, drawing meaning from it. This knowledge is open to question and revision upon the discovery of new ideas and new evidence. Nature has dealt us with some really complicated systems such as the brain and its complex neural networks, and in nuclear physics, it’s the nucleus. All these systems have so many moving parts, such that, when one probes into these systems, the data obtained are very complex and have high dimensionality. Consequently, making the analysis of the data very challenging. In nuclear physics, an ultimate goal is to understand the nucleus in terms of a nuclear model. Such a model would give a detailed description of what a nucleus is, it’s constituents and how it interacts with matter. In other words, the model would tell us everything there is to know about the nucleus.
We know that an atom is made of electrons, protons and neutrons. We understand fairly well how small nuclei (containing a couple of protons and neutrons) behave. However, what if there are hundreds protons and neutrons? How does this change the system? How does one go about analyzing such a system? These are the kinds of problems that nuclear physicists are thinking of. And if there was a model to provide answers to such questions simultaneously, that would be great. Unfortunately, such a model doesn’t exist. Therefore, nuclear physicists rethought the problem and broke it down to ask more specific questions, such as: (i) what happens to the shape of the nucleus as the number of protons and neutrons increases? (ii) what happens to the energy of the nucleus? (iii) what causes the nucleus to split into pieces? (iv) what happens after a nucleus splits? Such questions are asked to provide insights into what an ideal nuclear model would look like. This is achieved by relying on both experimental data and theoretical interpretation.
Theory recommends observables that are testable experimentally using various means.
In the present work, these observables are accessed by means of measuring theγ-rays emit- ted from excited states in a nucleus populated from spontaneous fission (see chapter 2.2 for more details on this process). Coincidence information is gathered, and with that informa- tion inferences are made regarding the quantized energy levels present in a nucleus. A level scheme is built and this picture can lend itself to a structure interpretation. It is also possi- ble to measure the quantum mechanical character of the radiation emitted from a nucleus.
The γ radiation can be classified as electric or magnetic and carries angular momentum away from the nucleus. Measurement of these properties can also help identify the spins and parities of nuclear states. However, the question becomes: why should anyone care about such knowledge? There are a few reasons as to why one should care: (a) because it is science (we do it because we love science)–however, in a more practical sense, (b) it is useful for designing better nuclear research facilities, (c) building nuclear energy facilities, and (d) useful in the field of nuclear medicine.
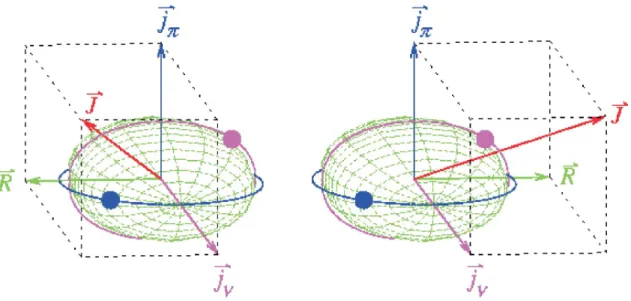
Figure 1.1: The possible alignments of the angular momentum vector in a chiral nucleus.
The two alignments result in a pair of nearly degenerate odd-parity bands.
1.2 Motivation
Unlike molecules, nuclei were long thought to be achiral. However, Frauendorf and Meng [7] pointed out in 1997 that triaxial nuclei with significant components of angular momentum along the three principle axes could meet the conditions of nuclear chirality.
The conditions they proposed are a particle in a high-j orbital along one axis, a hole in a high-j orbital aligned along another axis, and the rotational angular momentum along the third axis such that the total angular momentum is not aligned along any of the principal axes (see chapter 5 for more details). This configuration is pictured in figure 1.1. The experimental signature for nuclear chirality is two sets of nearly degenerate odd-parity bands corresponding to the two-reflected orientations of the total angular momentum. This experimental signature of a pair of nearly degenerate in energy,∆I=1 bands, has been found around136Nd [8] and104,105,106Rh [9, 10, 11]. Possible perturbed chiral bands related to γ-softness have also been proposaled in106Ag [12].
If chirality is a global nuclear property, then it might be seen in odd-even or even-even nuclei. Chirality in an even-even nucleus was first proposed for106Mo by Zhu et al. [13].
The chiral bands were interpreted as soft chiral vibrations with a complex structure where
the configuration of quasi-neutrons nearly fills the g7/2orbital (hole) and the h11/2orbital is just beginning to fill (particle). Recent theoretical calculations of all nuclei found that nuclei around 108Ru should have a deformed triaxial shape [14]. The 108,110,112Ru nuclei were searched by Luo et al. [15] for the chiral signature bands, and a set of nearly degenerate bands was found in each nucleus. The discovery of chirality in even-even nuclei, especially that found106Mo, was the major motivation for the present work given the similarities in the population of104Mo and106Mo. More significantly, with the development of large Ge detector arrays, such as Gammasphere and Eurogam which offer high degree of sensitivity and selectivity, experimental investigations of high spin states of neutron-rich nuclei have been made feasible.
Additionally,252Cf yields of individual correlated pairs in barium (Z = 56) and molyb- denum (Z = 42) binary fission have been observed to undergo fission splits via an extra
“hot fission mode” (also called second mode) [3]. In this mode, it has been observed that the Ba-Mo fragment pair emits high neutron multiplicities of 7 to 10 neutrons in sponta- neous fission of252Cf [3, 16, 17]. To explain this phenomenon, theorists have attributed the presence of this mode to a possible hyperdeformation of144,145,146Ba fragments at scission [16, 18, 19]. This is justified by referring back to the theory which predicts that a large nuclear deformation is more likely to yield higher neutron multiplicities [20]. Other theo- rists have raised skepticism, since the hot fission mode has only been observed in Ba-Mo fragment pairs of252Cf and not in spontaneous fission of248Cm [21]. However, this private communication [21] has never been published.
Furthermore, some earlier analysis in spontaneous fission of252Cf did not confirm the second hot mode [5] without reporting the 9 and 10 channel yields (see later discussion), while others did show some irregularity around the eight-neutron channel [4, 22, 23, 24].
Because of the importance of understanding this extra hot fission mode, pairs of Ba-Mo, Ce-Zr, Te-Pd, and Nd-Sr have been studied with improved precision usingγ-γ-γ-γ as well as γ-γ-γ coincidence data and the latest level structures of these nuclei. Also, relative
intensities of transitions in these nuclei made available through our work likewise improved the accuracy of the analysis. See chapter 4 for the full discussion of the experimental details and results.
Chapter 2
Nuclear Decay
Before a full discussion of the present work, it is important to first discuss basic nu- clear radioactive processes and useful mathematical structures and tools for analyses of radioactive processes which are essential concepts for the analyses of nuclear decay. Var- ious atomic nuclei undergo spontaneous decay processes in order to decrease their total energy. There are four main decay modes; spontaneous fission, α decay, β decay, and γ decay. The first two decay modes occur via the strong interaction,β decay is an elec- troweak process, and γ decay is an electromagnetic process. Spontaneous fission and α decay involve the emission of nucleons, β decay involves the conversion of a proton to a neutron (or vice versa) in order for the nucleus to become more stable, whereas γ de- cay decreases the energy of the nucleus through transitions from excited nuclear states to (eventually) the ground state. Here, only spontaneous fission (SF), γ decay, and Internal Conversion (IC) will be discussed in full as they are the only decay processes used in this study. The source of information for the introductory material presented here is taken from the following [25, 26] sources unless otherwise stated. Extensive details for all of these decay modes, as well as others not listed here, can be found in the same sources.
2.1 Decay Statistics
Radioactive nuclei are characterized by the rate at which they decay. This rate is given by the decay constantλ, which has dimensions of inverse time. Due to the statistical nature of radioactive decay, no specific prediction can be given for an individual nucleus. The characterization of these decays is reliant instead on decay probabilities. The probability that a nucleus decays within the time intervaldtisλdt. Therefore, in a collection of identical radioactive nuclei, the number of decays per unit time is proportional to the number of
nuclei that are present:
−dN(t) =λN(t)dt (2.1)
This result can be integrated to give an expression for the number of nuclei remaining as a function of time known as the exponential decay law:
N(t) =N0e−λt (2.2)
where N0 is the number of parent nuclei present at t = 0. Equation 2.2 can be used to determine the time required for half of the nuclei present to decay. This is known as the half-life, denoted byt1/2. By substituting N(t) = N(0)/2 into Eqn. 2.2 and rearranging we obtain:
t1/2=ln(2)
λ (2.3)
A more physically useful number is the nuclear lifetime,τ, or the average time it takes for a single nucleus to decay. Whileλ andτ are mathematically convenient, it is traditional to speak of nuclear half-lives, t1/2, or the time it takes for half the nuclei to decay (i.e.
N(t1/2) = 12N0). From these definitions it should be obvious that
λ = 1
τ = ln(2)
t1/2 (2.4)
Furthermore, if a nucleus is being produced at a rate,P, then equation 2.1 becomes
∂N
∂t =P−λN (2.5)
for which the solution – if we assumePis constant – is
N(t) = P λ
1−e−λt
+N0e−λt (2.6)
Normally, in a case of production,N0=0, thus (in terms ofτ);
N(t) =Pτ
1−e−t/τ
(2.7)
IfP is not constant, then the solutions to equation 2.5 depend on the form ofP(t). In all cases considered in this work,Pcan be assumed or approximated to be constant.
There are many cases in which there is more than one decay mode of the parent nuclear state. These are known asmulti-modal decays. For example, if the parent nucleus decays by way of two branches, there would be two distinct decay constantsλ1andλ2. These are known as partial decay constants. For the total decay of the parent,λ =λ1+λ2, whereλ is the total decay constant. These decay constants represent decay rates for each branch of the decay. The branching fraction (or branching ratio) is a measure of the fraction of the total decays that proceed via a given branch:
B1=λ1
λ , B2= λ2
λ and in generalBn= λn
λ (2.8)
whereBnis the branching ratio for the nth branch. Other cases where the daughter nucleus is also unstable and decays to a granddaughter occur as well. These are referred to as sequential decays. Sequential decays often lead to large decay chains which may contain many generations of α and β decays, as well as cascades ofγ-rays from excited nuclear states.
2.2 Fission
Nuclear fission is a process where an atomic heavy nucleus divides into two (sometimes three) smaller nuclei, plus a few neutrons as given in the equation 2.9
A
ZXN→AZ00XN00+A−ZA−0−Zx0XN00−N0−x+x 10n1
+energy (2.9)
The daughters, A0X0 and A−A0−xX00, are left in excited states, usually with large spin, in addition to the kinetic energy of both daughters and thexneutrons.
Fission can be either a reaction or decay process depending on whether it is induced or spontaneous, respectively. Fission has a unique importance among nuclear reactions.
The discovery of fission, and the developments that proceeded from it, have altered the world forever and have impinged on the consciousness of every literate human being. This process occurs when a nucleus with some degree of deformation absorbs energy, becoming excited and deforms to a configuration know as the “transition state” or “saddle point”
configuration. This deformation results in the average distance between the nuclear protons to increase thus, reducing the Coulomb energy. At the same time, the nuclear surface energy increases as the area of the nucleus increases. Therefore, at the saddle point, it is true that the rate of change of the Coulomb energy is equal to the rate of change of the nuclear surface energy. The formation and decay of this transition state nucleus are the rate determining step in the fission process and corresponds to the passage over an activation energy barrier to the reaction. If the nucleus deforms beyond this point it is irretrievably committed to fission. When this happens, then in a very short time, the neck between the nascent fragments disappears and the nucleus divides into two fragments at the “scission point”, while emitting neutrons.
In fact, the neutrons emitted by fission are typically emitted byprimary fragments, the highly excited nuclei directly produced by the fission process, and not emitted in the fis- sion process itself. Fission occurs in stages, with the primary fragments being populated well above their neutron separation energies in under 10−20 s during the “saddle to scis- sion” phase. The prompt neutron emission phase occurs when the primary fragments emit neutrons by around 10−18 s, producing the excited daughters, or secondary fragments, as shown in equation 2.9. At around 10−16s, the daughter nuclei will emit prompt γ-rays, which are the emissaries from the nuclear world studied in this work (as described in sec- tion 2.4 below). Finally, from 10−6s to infinity, one will often seeβ-delayed neutrons and
γ-rays, as the ground states (or isomers) of the secondary fragmentsβ-decay, causing both neutrons andγ-rays to be emitted from their daughters, who also will eventuallyβ-decay, continuing the process until the nuclei decay to stability.
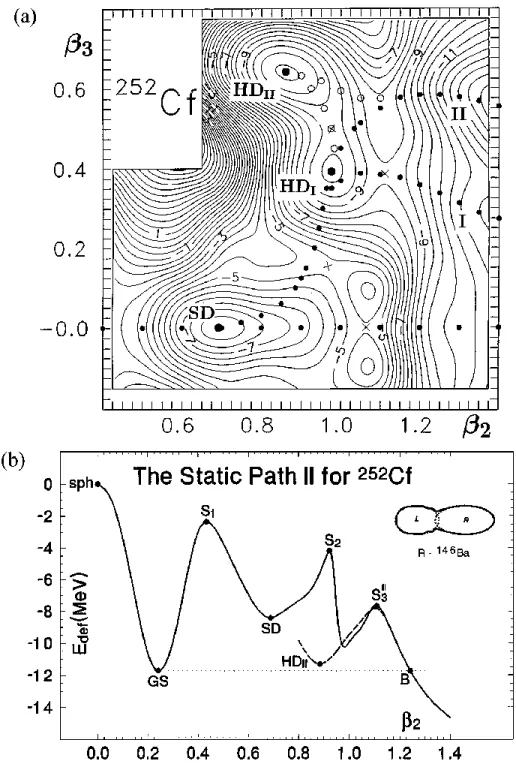
The term “saddle to scission” refers to the path the fissioning nucleus takes from a sad- dle point in its potential energy surface to the point that the nucleus actually scissions into two distinct nuclei. Fission (andα-decay) occurs by quantum tunneling through a potential energy barrier in the nucleus’ deformation potential energy surface. As will be described in greater detail in section 3.3 below, the shape of a nucleus can be described in terms of deformation parameters,βi, wherei represents the multipole order of the electromagnetic field produced by the charge distribution of the nucleus. Figure 2.1a shows the potential energy surface for252Cf, as a function of β2 andβ3, along with a few different paths the nucleus might take as it tunnels through the fission barrier to scission. Figure 2.1b shows an one dimensional slice of the potential energy surface, showing the shape of the potential energy barrier that a nucleus must tunnel through before scission.
Equation 2.9 and figure 2.1 assume that it is the ground state of a nucleus that is fission- ing. When the ground state of a nucleus fissions without an external stimulus, this is known asspontaneous fission(or SF). Spontaneous fission has a long half-life and competes with α decay. Spontaneously fissile nuclides have many useful applications. For example,252Cf is a very efficient compact energy source for many application. Also,252Cf is a useful very compact source of neutrons that eliminates the need for accelerators or reactors for many applications. While252Cf – whose decay products are studied in this work – spontaneously fissions∼3% of the time1, most fission reactions studied by physicists areinduced fission.
Induced fission occurs when an external stimulus excites the nucleus to an energy where tunneling across the fission barrier is substantially easier, or perhaps even above the barrier altogether;
1The other∼97% isα-decay
V
OLUME77, N
UMBER1 P H Y S I C A L R E V I E W L E T T E R S 1 J
ULY1996
FIG. 4. (a) Potential energy surface for 252Cf (relative to the energy at the spherical shape) as a function of b2 and b3. The minima (saddle points) are marked by filled dots (crosses).
The dotted trajectories indicate three static fission paths: the reflection-asymmetric paths (I) and (II) and the symmetric path at b3 � 0. (b) Potential energy curve for 252Cf as a function of b2 along the static fission path (II). The calculated shapes of 252Cf in the minimum HDII (b2 � 0.9, b3 � 0.65) and at b2 � 1.4 are shown together with the corresponding shapes of the left (L) and right (R) fragments.
results. However, it is difficult to say whether the observed HD fragments
144,145,146Ba at scission can be associated with the direct decay of the third minimum or whether they bypass it. It would be fascinating to observe directly the HD
IIminimum in
252Cf.
In conclusion, the observed coexistence of two fission modes in the spontaneous fission of
252Cf involves a new type of bimodal fission. The striking feature of this new type bimodal fission with normal and low TKE is the manifestation of two distinct fission modes for the same charge�mass asymmetry for the Mo-Ba division of
252Cf.
So
144Ba,
145Ba, and/or
146Ba are found in two states
which are remarkable for their very different deformations at the scission, while their partners,
107,106Mo, have approximately the same deformation in Modes 1 and 2 and
108Mo a deformation near that of
144Ba in Mode 2.
The normal fission Mode 1 has features typical of the bulk of fission events of
252Cf, while the abnormal Mode 2 reported here for the first time provides evidence for a HD shape for one or more of
144,145,146Ba at scission.
G. M., T.-A., and A. V. D. express appreciation for the hospitality and financial support received from Vanderbilt. This work is supported in part by the U.S.
DOE: DE-FG05-88ER40407 (Vanderbilt), DE-AC07- 76ID01570(INEL), DE-FG05-93ER40770 (Tennessee);
at JINR by Grant No. 94-02-05584-a of the Russian Federal Foundation of Basic Sciences; at the SAS Institute of Physics by the SAS Grant Agency Grant No. GA-SAV517�1993; the NSF Pittsburgh-Warsaw Grant No. INT-9115309, and by the Polish Committee for Scientific Research Contract No. 2 P03B 034 08.
Oak Ridge National Laboratory is managed by Martin Marietta Energy Systems, Inc., under Contract No. DE- AC05-84OR21400 for the U.S. Department of Energy.
*Also at UNISOR, ORISE, Oak Ridge, TN 37832. On leave from the Institute of Nuclear Physics, Cracow, Poland.
†Current address: INEL, Idaho Falls, ID 83415.
‡Current address: Tsinghua University, Beijing, Peoples Republic of China.
§Current address: Lawrence Berkeley Laboratory, Berkeley, CA 94720.
[1] G. M. Ter-Akopian et al., Phys. Rev. Lett. 73, 1477 (1994).
[2] J. Wild et al., Phys. Rev. C41, 640 (1990).
[3] M. G. Itkis et al., Z. Phys. A 320, 433 (1985).
[4] E. K. Hulet et al., Phys. Rev. Lett. 56, 313 (1986).
[5] V. Pashkevich, Nucl. Phys. A169, 275 (1971).
[6] P. Möller et al., Nucl. Phys. A469, 1 (1987).
[7] S. C´wiok et al., Nucl. Phys. A491, 281 (1989).
[8] U. Brosa et al., Phys. Rep. 197, 167 (1990).
[9] J. H. Hamilton et al., Prog. Part. Nucl. Phys. 35, 635 (1995).
[10] J. H. Hamilton et al., in Proceedings of the Workshop on Gammasphere Physics, edited by M. Delaplanque- Stephens (World Scientific, Singapore, to be published).
[11] A. C. Wahl, Nucl. Data Tables 39, 1 (1988).
[12] P. G. Young et al., in Proceedings of the Workshop on Computation and Analysis of Nuclear Data Relevant to Nuclear Energy and Safety, Trieste, Italy, 1992 (World Scientific, Singapore, 1993).
[13] C. Budtz-Jørgensen and H.-H. Kittner, Nucl. Phys. A490, 307 (1988).
[14] S. C´wiok et al., Phys. Lett. B 322, 304 (1994).
Figure 2.1: (a) A two dimensional potential energy surface for spontaneous fission as a function of quadrupole (β2) and octupole (β3) deformation paramaters with dotted lines representing possible paths252Cf might take toward scission. (b) one dimensional potential for the fission path alongβ3=0, with points marked corresponding to points shown in a.
Additionally “GS” represents the ground state of252Cf and “sph” represents theβ2=β3=0 point of perfect spherical symmetry. This figure is copied from Ter-Akopianet al.[16]
11
1
0n1+AZXN →AZ00XN00+A−A0−Zx+1−Z0XN00−N0−x+x 10n1
+energy (2.10)
Neutron induced fission is commonly used in nuclear power reactors, because the excess neutrons produced by one fission event can be used to start other fission events, causing a chain reaction. However, neutrons, being neutral, are difficult to accelerate to precise energies, or directions.
11H0+AZXN →AZ00XN00+A−ZA−0−Zx+10+1XN00−N0−x+x 10n1
+energy (2.11)
to produce isotopes of interest.
2.3 Types of Nuclear Decay
There are three primary modes of decay for a nucleus, traditionally known asα,β, and γ decay. Alpha decay typically occurs in heavy nuclei, and consists of the emission of a
4He, nucleus;
A
ZXN →AZ−−42XN0−2+42He2+energy (2.12) whereAZXN is an arbitrary isotope of an element consisting ofZ protons, N neutrons, and Z+N =A total nucleons. Beta decay occurs for nuclei that have too many neutrons re- sulting in a neutron changing into a proton by emission of an electron and an anti-electron- neutrino;
AZXN →Z+1AXN0−1+e−+ν¯e+energy (2.13) Gamma decay occurs when a nucleus, being in an excited state (often denoted by *), emits a photon;
A
ZXN∗→AZXN+00γ0 (2.14)
To iterate, in addition to these three primary modes, nuclei may also decay by SF, IC , positron emission (β+), orbital electron capture (EC), neutron emission, proton emission,
pair production, and cluster emission. Furthermore, a nucleus may be caused to decay by external stimuli in processes such as neutrino absorption, neutron (or otherwise) induced fission, and inverse internal conversion2.
2.4 γ-Decay
As mentioned earlier, nuclei that are in an excited state generally decay via the emission of aγ-ray or through internal electron conversion to decrease the energy of the nucleus. The transitions can occur between two excited states or an excited state and the ground state.
This decrease in energy does not change the isotope, it merely re-configures the nucleons within the nucleus. In theγ-decay process, electromagnetic radiation of a specific energy is released when the nucleus undergoes a transition from an excited state to a lower energy state. With internal conversion, the energy that would be emitted through electromagnetic radiation instead liberates an atomic electron, causing it to move into an unbound state.
These two processes generally compete with each other. The study ofγ-rays emitted by an excited nucleus has long been a valuable tool in the study of nuclear structure. From the measured observables of γ-rays, many properties of the nuclei that emitted them may be determined.
2.4.1 Multipole Radiation and Magnetic Properties of Nuclei
In order to understand the energy transfer in γ decay, we must consider the initial and final states of the nucleus as well as its recoil momentum. Using conservation of energy and momentum, we obtain:
Conservation of Momentum: pR+pγ =0 (2.15)
Conservation of Energy:Ei=Ef+Eγ+TR (2.16)
2Only recently observed experimentally; see Chiaraet al.[27].
where: TR= p2R
2Mx = p2γ
2Mx = Eγ2
2Mxc2, (2.17)
is the corresponding recoil total energy and is assumed to be non-relativistic. Therefore;
∆E=Eγ+ Eγ2
2Mxc2, (2.18)
Eγ ≈∆E(1− ∆E
2Mxc2). (2.19)
It can be seen that the energy released in the electromagnetic transition is slightly less than the energy difference between the initial and final nuclear states due to the recoil of the daughter nucleus.
The emitted γ-ray photon can be understood in a simple model using classical elec- trodynamics, where a radiation field can be described in terms of a multipole expansion.
This classical theory is then supplemented using a quantum mechanical description for the electric and magnetic multipoles in terms of the power radiated for each:
λe(L) = Pe(L)
hω¯ andλm(L) = Pm(L)
hω¯ (2.20)
where the subscriptsmanderepresent magnetic and electric multipoles, respectively, L is the multipolarity of the respective transition (see Table 2.1), and Eγ = ¯hω, whereω is the angular frequency of the oscillating field.
The decay constants can then be expanded in multipoles by expanding the radiation powers. In order to obtain order of magnitude expressions for the expected transition rates, a number of approximations can be made. These are referred to as theWeisskopf estimates.
They are: (i) that the initial and final states are given by the single particle wave functions:
Ψi=Ri(r)Ylimi(Θ,Φ)andΨf =Rf(r)Ylfmf(Θ,Φ) (2.21)
Table 2.1: Properties and nomenclature for electromagnetic multipole radiation. [28]
Radiation Nomenclature Symbol Multipolarity (L) Parity
Electric Dipole E1 1 -1
Magnetic Dipole M1 1 +1
Electric Quadrupole E2 2 +1
Magnetic Quadrupole M2 2 -1
Electric Octopole E3 3 -1
Magnetic Octopole M3 3 +1
. . . .
. . . .
. . . .
and (ii) the radial terms in the wave functions are constant over the entire nuclear vol- ume, and zero elsewhere. Once these approximations are made, the electric and magnetic multipole decay constants can be expressed as [28]:
λe(L) = 2e2(L+1) 4π ε0hL¯ [(2L+1)!!]2
3 L+3
2Eγ hc¯
2L+1
R2L (2.22)
and
λm(L) = 20e2h¯(L+1) 4π ε0c2m2pL[(2L+1)!!]2
3 L+3
2 Eγ
¯ hc
2L+1
R2L−2 (2.23) where R is the nuclear radius, and Eγ is expressed in MeV.
The total angular momentum (L) of the photon is subject to selection rules, which are related to the angular momentum of the initial and final nuclear states by:
|Ji−Jf| ≤L≤Ji+Jf (2.24)
where L = 1, 2, 3, ... .
It is important to note that the angular selection rules do not include 0 →0 transitions since they can only be satisfied with L = 0, and there are no L = 0 photons. There are also
parity selection rules that are dependent on the angular momentum of the photon,
For EL transitions,πi=πf(−1)L (2.25)
For ML transitions,πi=πf(−1)L+1 (2.26) For various initial and final nuclear spin and parity states there are in general a number of allowedγ-ray transitions that can occur. In the case where the lowest multipole permitted by the selection rules is electric, it will dominate the decay. If the lowest allowed multipole L is magnetic, there will, in general, be a competition between ML and E(L+1) multipole radiation.
2.4.2 Reduced Transition Probabilities
The probability per unit time, λ, that a nucleus will undergo a certain transition from state |Jii to state |Jfi by emitting a photon of energy E and angular momentumL, with either magnetic (Π=M) or electric (Π=E) qualities is
λ(ΠL;Ji→Jf) = 8π(L+1) L((2L+1)!!)2
1
¯ h
E
¯ hc
2L+1
Jf
O(ΠL)ˆ Ji
2 (2.27)
where ˆOis the multipole transition operator, andx!!≡1×3×5× ··· ×xis a double fac- torial. This λ is the same as defined in equation 2.4. It is common to define a reduced transition probability,B(ΠL;Ji→Jf), that is independent of energy, and only depends on the nuclear properties of the two states involved. When this is done, equation 2.27 becomes
λ(ΠL;Ji→Jf) = 8π(L+1) L((2L+1)!!)2
1
¯ h
E
¯ hc
2L+1
B(ΠL;Ji→Jf) (2.28)
Greater detail on the derivation of equations 2.27 and 2.28 can be found in Eisenberg and Greiner [29].
The experimental techniques discussed in this work are incapable of directly measuring B(ΠL)values. However, the ratios of such values for transitions from the same state are still useful. In general when multiple transitions de-excite the same nuclear state, their measured intensities, I, will be proportional to their respective transition probabilities,T. Thus we can use equation 2.28 to find a general relationship between the reduced transition probabilities and measured intensities of transitions from the same state;
B(Π1L1;Ji→Jf)
B(Π2L2;Ji→J0f) = (L2+1)L1((2L1+1)!!)2
(L1+1)L2((2L2+1)!!)2(¯hc)2(L1−L2)J1E22L2+1
J2E12L1+1 (2.29) In most casesΠ1L1=Π2L2≡ΠL, and thus,
B(ΠL;Ji→Jf)
B(ΠL;Ji→J0f) = J1E22L+1
J2E12L+1 (2.30)
which is an elegantly simple equation useful for calculating experimentalB(ΠL)ratios.
Furthermore, for collective states, especially those involving quadrupole vibrations, the ratio ofB(EL)values for transitions out of the same state can be calculated simply by the ratio of the square of Clebsch Gordon Coeficients;
B(EL:Ji→Jf)
B(EL:Ji→J0f) = hJiKi,L∆K|JfKfi2
hJiKi,L∆K0|J0fK0fi2 (2.31) WhereK is the projection of the nuclear spin on the nuclear axis of symetry (usually the same as the spin of the bandhead), and∆K=Kf−Ki. Equation 2.31 allows one to calculate what are known as Alaga rules which are useful tools giving a first order approximation for B(E2)ratios, and can be very powerful for identifying the K values for various band structures seen in data, thus aiding in the assignment of observed bands with different structure properties. A deeper discussion of Alaga rules can be found in Casten [30].
Equation 2.31 assumes that the properties of the collective bands it connects are un- mixed. This assumption is rarely valid for β- andγ-vibrational bands, meaning that the
experimentalB(E2)ratios rarely match equation 2.31. We can defineγ-ground,β-ground, andγ-β mixing parameters respectively as
Zγ≡√ 24εγ
h00|Oˆ(E2)|00i h12|Oˆ(E2)|00i
Zβ ≡2εβ
h00|O(E2)ˆ |00i h10|O(E2)ˆ |00i
Zβ γ≡√ 6εβ γ
h12|Oˆ(E2)|00i h10|Oˆ(E2)|00i
(2.32)
where|nKiis the band head of a band consisting ofnquadrupole phonons with a projection K of the spin on the symmetry axis, and the εi are constants dependent on the nuclear moment of inertia and the exact form of the Hamiltonian. The effect of this mixing can be found as a multiplicative correction to theB(E2)values found by equation 2.31 by
B(E2;Ji→Jf) =B0(E2;Ji→Jf)
1+ZγFγ(Ji,Jf) +Zβ γFβ γ(Ji,Jf)2
(2.33)
whereB0(E2)is the unmixedB(E2)(as given by equation 2.31) and
Fγ(Ji,Jf) = 1
√24
fγ(Jf) hJi2,20|Jf2i hJi2,2−2|Jf0i−1
2 1+ (−1)Ji
fγ(Ji) hJi0,20|Jf0i hJi2,2−2|Jf0i
Fβ γ(Ji,Jf) = 1
2 1+ (−1)Ji fγ(Ji)
√6
hJi0,20|Jf0i hJi2,2−2|Jf0i
(2.34) with fγ(J)≡p
J(J−1)(J+1)(J+2). Equations 2.33 and 2.34 result in relatively simple corrections to theoritical B(E2) values as tabulated in table 2.2. These results (equations 2.33 and 2.34 and table 2.2) are specifically for γ-band to ground state band transitions.
For more information on this theory, including its application to β-band to ground band transitions, see Lipas [31], Riedinger [32], and Marshalek [33]. More recent theories, such as described in Gupta [34], still explain deviations from the Alaga rules in terms of mixing
Table 2.2: Correction Factors for B(E2) values based on equations 2.33 and 2.34. The correction factors listed here are only valid forγ-band to ground state band transitions. Zγ andZβ γ are defined in equation 2.32. These correction factors first appeard in Lipas [31], though this work uses the sign conventions of Riedinger [32] and Marshalek [33].
Ji Jf B(E2;Ji→Jf)/B0(E2;Ji→Jf)
J−2 J
1+ (2J+1)Zγ+J(J−14)Zβ γ2
J−1 J
1+ (J+2)Zγ2
J J
1+2Zγ−13J(J+1)Zβ γ2
J+1 J
1−(J−1)Zγ
2
J+2 J
1−(2J+1)Zγ+ (J+1)(J+2)Zβ γ2
between theβ-,γ-, and yrast-bands, but tend to rely on complex computer codes which are beyond the scope of this work.
2.5 Internal Conversion
The internal conversion decay constant is, in general, a sum of the decay constants for the conversion of electrons from the various atomic shells (K, L, M, etc.). As mentioned previously, this process competes with photon emission, which implies that the total decay constant for a transition between the initial and final nuclear states is a sum of the γ and internal conversion decay constants,λ=λe+λγ, where theγ-decay constant is given above for ML and EL transition. The internal conversion coefficient,α, is defined as the ratio of the decay constant for electron conversion to the decay constant forγ emission,
α = λe
λγ (2.35)
which is then expressed in terms of the total decay constant
λ =λγ(1+α) (2.36)
The internal conversion coefficients can be calculated theoretically for each atomic shell [35]. An internal conversion coefficient (ICC), combined with a measurement of the γ- decay constant, will therefore yield the total electromagnetic decay constant.
Unlikeβ-decay electrons, IC electrons have discrete energies determined by the energy of the transition and the binding energy of the electron that gets converted;
Ee:IC=Eγ−Be (2.37)
whereEe:IC is the kinetic energy of the conversion electron,Eγ is the energy of the transi- tion (which is the energy of the emittedγ-ray, if the transition decays byγ instead of IC), andBe is the binding energy of the orbital electron. This inherently means that there is a minimum transition energy before IC is possible, namely Be. However, this depends on which electron is internally converted, the more bound the electron (and thus the greater overlap between electron and nuclear wave functions) the higher the energy threshold for IC, causing discontinuities in the valueα vs transition energy. Additionally, with the ex- ception of these discontinuities,α increases as the transition energy decreases. The energy dependence ofα is seen clearly in figure 2.2.
Furthermore, α (equation 2.35) is also dependent on Z such that, as Z increases, the probability of IC increases for two connected reasons. Since there are more electrons or- biting a nucleus with higher Z (number of electrons = Z), there are more candidates for internal conversion. Of greater effect, however, is the generally greater amount of charge present in the system, especially the nucleus itself, causing the strength of the interaction between the nucleus and the electrons to increase. This means that the most bound elec- trons are more and more tightly bound with increasingZ, causing their wave functions to be in greater overlap with the wave function of the nucleus. Figure 2.2 shows plots for four different values ofZ; 25, 50, 75, and 100.