THE RELATION OF GUILT, SHAME, BEHAVIORAL SELF-BLAME, AND CHARACTEROLOGICAL SELF-BLAME TO DEPRESSION IN
ADOLESCENTS OVER TIME By
Carlos Tilghman-Osborne
Thesis
Submitted to the Faculty of the Graduate School of Vanderbilt University
in partial fulfillment of the requirements for the degree of
MASTER OF SCIENCE in
Psychology
May, 2007
Nashville, Tennessee
Approved:
Professor David A. Cole Professor Craig Smith
ACKNOWLEDGMENTS
I would like to thank everyone who helped collect data for this project. I am also eternally grateful to my lab mates who helped every step of the way. I could not have accomplished writing this paper if it weren’t for the hours spent with my advisor, David Cole. I learned the most in graduate school from our meetings and through the process of writing. Finally, I would like to thank Dana for making the whole process more bearable and for being so pretty too.
TABLE OF CONTENTS
Page
ACKNOWLEDGMENTS………...ii
LIST OF TABLES………..iv
Chapter I. INTRODUCTION………...1
II. METHOD..………..7
Participants...7
Measures ...8
Procedure ...14
III. RESULTS………..16
Preliminary analyses ...16
Hypothesis Testing...16
IV. DISCUSSION………21
Appendix A. TABLES...29
B. EXPLORATORY FACTOR ANALYSES OF THE MEASURES...35
C. DESCRIPTION OF THE PERSONAL FEELINGS QUESTIONNAIRE-2...41
D. COPIES OF THE MEASURES USED ...42
REFERENCES ... . ...59
LIST OF TABLES
Table Page
1. Descriptive Statistics...29
2. Exploratory Factor Analysis of the Subscales ...30
3. Regressions of Concurrent Depression onto Shame/CSB and Guilt/BSB...31
4. Relation of Attributional Style to Shame/CSB and Guilt/BSB ...32
5. Shame/CSB and Guilt/BSB Predicting Change in Depression over Time. ...33
6. Depression Predicting Change in Shame/CSB and Guilt/BSB over Time ...34
7. Exploratory Factor Analysis of the TOSCA-A...37
8. Exploratory Factor Analysis of the SSGS ...38
9. Exploratory Factor Analysis of the WIH-Q...39
10. Exploratory Factor Analysis of the ABQ...40
CHAPTER I
INTRODUCTION
Guilt and shame constitute collections of negative thoughts and feelings that are very similar to those that constitute behavioral self-blame and characterological self- blame. Previous research has revealed that guilt and shame are distinct constructs related to depression in qualitatively different ways (Tangney, 1996). Guilt focuses on a
particular action or inaction, and it can be adaptive by motivating one to change future behaviors. Shame focuses on the self and a sense of worthlessness; it correlates more highly with depression than guilt does. Janoff-Bulman (1979) introduced and described behavioral self-blame (BSB) and characterological self-blame (CSB) in similar terms.
BSB focuses on the controllability of actions and is adaptive (much like guilt), whereas CSB is an esteem-related attribution that is maladaptive (much like shame). Just as shame correlates more highly with depression than guilt does, CSB correlates more highly with depression than BSB does. The guilt/shame literature and the BSB/CSB literature tell similar stories, and though Tangney has suggested that the concepts are similar (Tangney, Burggraf, & Wagner, 1995; Tangney & Dearing, 2002b), no study has fully examined the extent to which they overlap. The overarching goal of the current study was to examine whether the concepts converge onto two distinct constructs (guilt/BSB and shame/CSB), at least insofar as depression is concerned.
To explore the similarities between guilt/shame and BSB/CSB in the context of depression, we will investigate the convergent, discriminant, and predictive validity of
each construct. Out of the many overlapping definitions of guilt and shame in the
literature, Tangney’s have risen to the fore. Based on her definition, guilt is characterized by tension, regret, and remorse about a particular action or inaction (Tangney, Wagner, &
Gramzow, 1992). These emotions often serve as motivators to make amends for
behaviors that violate moral standards (Ferguson, Stegge, Miller, & Olsen, 1999). Shame is a more helpless emotion that causes a person concern that the self could be revealed as somehow defective (Tangney, 1995). Shame also concerns the entire self and involves extreme self-scrutiny. Experiencing shame corresponds to a sense of shrinking, a feeling of being small, feelings of worthlessness, and a sense of exposure (Tangney et al., 1992).
Additionally, shame can elicit feelings of wanting to escape but being frozen or unable to get away (Sabini & Silver, 1997). Following a negative outcome, a guilt experience might begin with the thought, “Look at the horrible thing I have done.” A shame experience following the same negative outcome might begin with “I am a horrible person” (Lewis, 1974; Lindsay-Hartz, de-Rivera, & Mascolo, 1995; Tangney, 1995). By these definitions, then, we would expect guilt and shame to be somewhat correlated with one another but differentially related to problematic events and emotional outcomes.
Many researchers have examined the relation of guilt and shame to negative outcomes such as depression. The focus of guilt on action or inaction and the subsequent desire to amend past transgressions suggest that guilt has an adaptive quality. It should therefore correlate negatively (or at least negligibly) with depression and other
problematic outcomes. In contrast, shame is focused on feelings about the self and thoughts about personal inadequacies that do not necessarily facilitate constructive action. Shame has a maladaptive quality. It should therefore correlate positively with
depression and other negative outcomes. Several studies have found that guilt correlates negatively or negligibly to poor outcomes such as depression, anger, aggression, and withdrawal; conversely, shame correlates positively to these same negative outcomes (Hoglund & Nicholas, 1995; Luyten, Fontaine, & Corveleyn, 2002; Tangney et al., 1995;
Tangney et al., 1992; Woien, Ernst, Patock-Peckham, & Nagoshi, 2003).
The relation of guilt and shame to depression may reflect in how each relates to attributional style (AS). A depressive attributional style is one in which a person interprets negative events as internal, global, and stable. Thinking that the cause of a negative event is attributable to one’s self, is consistent across domains, and is stable over time will lead to depression. Research suggests that both guilt and shame are internal attributions; however, they differ in that shame has global and stable implications,
whereas guilt does not. Shame is an emotion that would seem to reflect the depressogenic AS. Nevertheless, the empirical link between guilt and AS has been somewhat mixed. In general guilt relates to internality, and does not relate to globality or stability (Pineless, Street, & Koenen, 2006; Tangney, 1992, 1998; Tangney & Dearing, 2002b; Tangney et al., 1992).
Looking at the self-blame literature, a similar story emerges about the concepts of BSB and CSB. Self-blame is a particular attribution that reflects a sense of responsibility for negative outcomes (Janoff-Bulman, 1979). There are two types of self-blame: BSB and CSB. On the one hand, BSB is a control-related attribution that focuses on the execution of behaviors that causes negative outcomes (or on the failure to execute behaviors that could have prevented negative outcomes). Although BSB focuses on people’s past behaviors, it also suggests a solution for the future. Engaging in BSB may
involve thinking of ways to change one’s behavior so as to avoid similar negative outcomes in the future. For example, Janoff-Bulman suggests that after the extreme negative outcome of rape, a BSB response may be, “I shouldn’t have walked down that street alone,” or “I should not have let that particular man into my apartment.” On the other in hand, CSB is a self-reflective attribution in which people blame their person and fault their character. Often characterized by self-criticism, CSB involves feelings of deservingness following a negative outcome. Part of experiencing CSB is looking at the past and focusing on the negative implications for and about oneself. Janoff-Bulman suggests that following the same negative outcome of rape, a CSB response may be “I am weak,” or “I am a careless person who is unable to say stay out of trouble.”
Various studies suggest that BSB and CSB are relatively distinct constructs that relate to depression and other negative outcomes in opposite ways. Because BSB is an adaptive attribution in which one focuses on past actions and future avoidability, BSB is expected to relate to depression negatively. Conversely, CSB is a maladaptive attribution and should have a strong positive relation to depression. Janoff-Bulman’s (1979) study found that BSB has a negligible relation with depression whereas CSB has a strong positive relation. These results were replicated with adults (Anderson, Horowitz, &
French, 1983; Peterson, Schwartz, & Seligman, 1981; Stoltz & Galassi, 1989) and with children (Cole, Peeke, & Ingold, 1996). CSB has also been shown to have a stronger relation than BSB to loneliness, anxiety, and low self-worth (Graham & Juvonen, 1998).
These results generalize across a variety of measures including the Attributional Style Assessment Test (Anderson, Jennings, & Arnoult, 1988), the Attributional Questionnaire
(Graham & Juvonen, 1998), the Characterological/Behavioral Self-Blame Scale (Janoff- Bulman, 1979), and the Why It Happened Questionnaire (Cole et al., 1996).
BSB and CSB also relate to attributional style in distinct ways. On a theoretical plane, Janoff-Bulman (1979) suggested that CSB is an internal, global, and stable
attribution (and should therefore relate to depression). Conversely, she suggests that BSB is internal, but not global or stable (and should therefore not relate to depression). These predictions have been supported empirically insofar as Peterson et al (1981) found that CSB correlates with internal, stable, and global attributions, and that BSB correlates with internal, but not global or stable attributions.
Theoretical and empirical similarities suggest a clear correspondence between guilt/shame (as described by Tangney) and BSB/CSB (as described by Janoff-Bulman).
Guilt and BSB are adaptive, reflect internality, focus on action, and are weakly (if not negatively) related to depression (Cole et al., 1996; Ferguson et al., 1999; Janoff-Bulman, 1979; Luyten et al., 2002; Peterson et al., 1981; Stoltz & Galassi, 1989; Tangney et al., 1992). Conversely, shame and CSB are maladaptive, focus on the self, and are positively related to depression, depressogenic attributional style, and other negative outcomes (Cole et al., 1996; Hoglund & Nicholas, 1995; Luyten et al., 2002; Pineless et al., 2006;
Sabini & Silver, 1997; Stoltz & Galassi, 1989; Tangney, 1992, 1998; Tangney et al., 1995; Tangney & Dearing, 2002b; Tangney et al., 1992; Woien et al., 2003).
To our knowledge, only one study has examined the constructs of guilt, shame, BSS, and CSB together (Lutwak, Panish, & Ferrari, 2003). Although they rely on only one measure of guilt/shame and one measure of BSB/CSB, their results provide some preliminary support for the convergence of these constructs. Lutwak et al. reported a
positive correlation between shame and CSB using the TOSCA (Tangney, Wagner, &
Gramzow, 1989) and the Characterological/Behavioral Self-Blame Scale (Janoff-
Bulman, 1979). They also found a positive correlation between guilt and BSB, using the same measures. Confusing the picture somewhat, however, is the fact that they also discovered small but significant correlations between shame and BSB and between guilt and CSB. In the current study, our focus on multiple measures and latent variables may provide a clearer picture.
The current examines the similarity of the guilt/shame and BSB/CSB bodies of literature by addressing five specific goals. Our five goals are: (1) to test for the
convergent and discriminant validity of a shame/CSB construct and a guilt/BSB construct (2) to test if shame/CSB is positively related to depression and if guilt/BSB is negatively related to depression, (3) to test the hypothesis that guilt/BSB relates to internality whereas shame/CSB relates to internality, globality, and stability, (4) to examine the degree to which shame/CSB predicts future depression, and (5) to examine the degree to which depression predicts future shame/CSB.
We elected to address the relation of these concepts to depression in a sample of adolescents. We focused on the age group because (1) most research has focused on adult and college students, (2) adolescence is a period in which moral development for what is right and wrong takes place, and (3) during adolescent depression emerges as a major disorder. Adolescents encounter new ideas of right versus wrong as they begin to distinguish between their ideals of what is right and the ideals of others for what is right (Kohlberg, 1984; Mitchell, 1975). It is also during this period when depression becomes more common as rates of prevalence approach those found in adults (Hankin, 2006).
CHAPTER II
METHODS
Participants
A total of 221 adolescents participated in this study. Participants attended either a middle school or a high school just outside a midsize Southeastern city during the course of this study. To recruit students, we sent 641 informed consent forms and letters to student’s families in the two schools. Of the 641 students contacted, 226 (35%) obtained permission from parents to participate. Between the two time points of the study, some students withdrew and some were added. Essentially, all attrition was the result of students moving out of the school district or being absent on the day of the assessment.
All additions to the study were students who had been absent at the first assessment. In comparing students who participated at both time points to those who only participated at one time point, there were no significant differences in ethnicity, gender, or any of our measured constructs. There was however a significant difference in age, as younger students were overrepresented in our sample at the second time point. During the second time point we were only able to go into the high school one time, and therefore lost a number of students who we would have seen in follow-up attempts. Overall, the sample slightly overrepresented girls (60% females vs. 40% males) and was representative of the racial make-up of the local population including White (84.1%), African-American (5.3%), Hispanic (3.3%), and “Mixed Ethnicity/Other” (7.4%) teens. The participants ranged in age from 11 years to 18 years (M=12.8, SD=1.8).
Measures
In the current study we used seven measures. Two measures assessed guilt and shame; two measures assessed behavioral self-blame and characterological self blame;
two measures assessed depression, and one measure assessed Attributional Style.
Guilt and Shame Measures. One measure of guilt and shame was the Test of Self
Conscious Attitudes- Adolescent version (TOSCA-A). The TOSCA-A (Tangney, Wagner, Gavlas, & Gramzow, 1991) is a self-report measure comprised of 15 scenarios (10 negative and 5 positive) that adolescents would be likely to encounter in everyday life. Each scenario is followed by four response items that assess guilt-proneness, shame- proneness, alpha-pride, and beta-pride. An example scenario is, “You trip in the cafeteria and spill your friend’s drink,” followed by responses such as, “I would be thinking that everyone is watching me and laughing” (shame-proneness). Each potential response is rated on a 5-point Likert scale (1=Not at all likely to 5=Very likely.) In adolescent samples the measure has relatively high levels of internal consistency (α=.81 for the guilt subscale, α=.77 for the shame subscale), test-retest reliability, predictive, convergent validity (Tangney, 1996; Tangney, Wagner, Hill-Barlow, Marschall, & Gramzow, 1996).
In the current study response items assessing alpha-pride and beta-pride were dropped because of our study focused on guilt and shame (and to shorten the
questionnaire packet). Our version of the measure consisted of 15 scenarios with two response items (guilt-proneness and shame proneness) each. Using oblique rotation and principal axis factoring, factor analysis of the measure based on our sample revealed two
strong factors (labeled guilt and shame). Primary factor loadings ranged from .57 to .83, whereas cross loadings were all less than .20. The factors correlated with each other .26 and .10 at time 1 and time 2, respectively. Both factors had high levels of internal consistency at both time points (αs=.85 for the guilt subscale, α=.80, .83 for the shame subscale).
Our second measure of guilt and shame was the State Shame and Guilt Scale (SSGS). The SSGS (Marschall, Sanftner, & Tangney, 1994) is a self-report measure compromised of 15 items. Five items for each of three subscales measure state-feelings of shame, guilt, and pride. An example of a guilt item is, “I felt bad about something I did.”
An example of a shame item is, “I want to sink into the floor and disappear.” Participants are asked to respond to how they currently feel and response items are rated on a 5-point Likert scale (1=Not feeling this way at all to 5=Feeling this way very strongly.) In college-age samples the measure had high levels of internal consistency, test-retest reliability, predictive and convergent validity with α ranging from .82 to .89 for each subscale (Tangney & Dearing, 2002b).
In the current study we slightly altered the wording for each response item for clarity. For example, “1=Not feeling this way at all” was changed to, “I do not feel this way at all.” In analysis, pride items were dropped because of our focus on guilt and shame. Using oblique rotation and principal axis factoring, factor analysis of the measure based on our sample revealed two strong factors (labeled guilt and shame). After
dropping two items that did not load properly at both time points, primary factor loadings ranged from .50 to .86, whereas cross loadings were all less than .30. The factors
correlated with each other .52 and .65 at each time point respectively. Both factors had
high levels of internal consistency at both time points (αs=.79, .83 for the guilt subscale, αs=.80, .83 for the shame subscale).
Behavioral and characterological self-blame measures. One measure of BSB and
CSB was the Why it Happened Questionnaire (WIH-Q). The WIH-Q (Cole et al., 1996) is a self-report comprised of 15 scenarios (12 negative, 3 positive) that adolescents could imagine encountering in everyday life. Of the 12 negative scenarios used to assess Behavioral self-blame (BSB) and Characterological self-blame (CSB), six are academic and six are social. A sample academic item is, “You have turned your homework in late many times this year. Your teacher takes points off every time homework is late.” Each scenario is followed by the same two response items, “Did this happen because of the kind of person you are?” (CSB) and “Did this happen because of something you did or didn’t do?” (BSB). Response items are rated on a 5-point Likert scale (1=No to 5=Yes).
In adolescent samples, the measure has high levels of internal consistency (α=.70 to α=.85), test-retest reliability (r=.33 to r=.57), predictive, and convergent validity (Cole et
al., 1996).
In the current study factor analysis with oblique rotation and principal axis factoring of the measure revealed two strong factors (labeled BSB and CSB). Primary factor loadings ranged from .48 to .89, whereas cross loadings were all less than .28. The factors correlated with each other .60 and .66 at time 1 and time 2, respectively. Both factors had high levels of internal consistency at both time points (αs=.84, .87 for the BSB subscale, αs=.85, .86 for CSB subscale).
Our second measure of BSB and CSB was the Attribution Blame Questionnaire (ABQ). The ABQ was created to assess BSB and CSB. Some scenarios were obtained from the Attributional Questionnaire (Graham & Juvonen, 1998) that assessed self-blame characteristics of children in victimized situations. Other scenarios were developed to create a measure with four different scenarios. An example scenario is, “Imagine that you are giving a report in front of the class. When you start to talk to the class, you say
something that doesn’t make sense. The teacher and your classmates all look really confused. Some kids even laugh at you.” Each scenario is followed by the same 12 responses that ask participants how likely they would have certain thoughts. An example BSB response is, “This is my fault. I should have been better prepared.” An example CSB response is, “If I were a smarter kid, I wouldn’t have these problems in class.” Each response item is rated on a 5-point Likert scale (1= definitely would not think to
5=definitely would think). For each scenario, six responses measure BSB and six responses measure CSB (totaling 24 BSB items and 24 CSB items in all).
We conducted factor analysis on all items using oblique rotation and principal axis factoring and found that two items (one BSB, one CSB) did not load strongly or appropriately for all four scenarios, and they were dropped, leaving 10 items per scenario and 40 items total (20 BSB and 20 CSB). Factor analysis of the remaining items revealed two strong factors (labeled BSB and CSB). Primary factor loadings ranged from .46 to .85 (Mdn=.71), whereas cross loadings were all less than .38 (Mdn=.05). The measure had high levels of internal consistency at both time 1 and time 2, respectively (αs=.85, .84 for the BSB subscale, αs=.85, .86 for the CSB subscale).
For details concerning EFAs see Appendix 1.
Depression Measures. One measure of depression was the Children’s Depression
Inventory (CDI). The CDI (Kovacs, 1981) is a 27-item self-report measure that assesses cognitive, affective, and behavioral symptoms of depression in children. Each item consists of three statements graded in order of increasing severity from 0 to 2. Children select one sentence from each group that best describes themselves for the past two weeks. In non-clinic populations, the measure has relatively high levels of internal consistency, test-retest reliability, predictive, convergent, and construct validity
(Blumberg & Izard, 1986; Carey, Faulstich, Gresham, Ruggiero, & Enyart, 1987; Kazdin, French, & Unis, 1983; Lobovits & Handal, 1985; Mattison, Handford, Kales, Goodman,
& McLaughlin, 1990; Saylor, Finch, Spririto, & Bennett, 1984; Smucker, Craighead, Craighead, & Green, 1986; Worchel, Hughes, Hall, & Stanton, 1990). For the current study internal consistency was high at both time points (α=.90, α=.91).
Our second measure of depression was the Center for Epidemiological Studies - Depression Scale (CES-D). The CES-D scale is a 20-item self-report scale designed to measure depressive symptomatology with a focus on the affective component. The scale items reflect symptoms associated with depression (i.e. irritability; sleep and eating disturbances). Participants rate on a scale of 0 to 3 (0 = rarely or none of the time; 3 = most or all of the time) how often they have had the symptom during the past week (i.e.
“I did not feel like eating; I wasn’t very hungry”).
The CES-D was developed by the Center for Epidemiological Studies to assess depressive symptomatology in the general population. The items that constitute the CES- D were selected from questionnaires in other validated measures of depression (Radloff,
1977). Radolff reports that the CES-D was designed using field tests with over 2,800 participants, as well as validated with both clinical and non-clinical populations. Radolff reports higher CES-D scores in clinical versus non-clinical populations; high split-half reliabilities (> .85), and significant relationships with negative life events and a
significant (20-point) decrease in CES-D score following clinical treatment for depression. For the current study internal consistency was high at both time points (αs=.89).
The CDI and the CESD-D correlated at .75 and .78 at time 1 and time 2
respectively. For our analyses, we created a depression composite score by summing the Z-score for each measure. We calculated the reliability of the depression composite using Nunnally and Bernstein’s formula (1994) and found a reliability of .94 at both time 1 and time 2 respectively.
Attributional style measure. Our measure of attributional style was the
Adolescent Cognitive Style Questionnaire (ASCQ). The ACSQ (Hankin & Abramson, 2002) is a self-report measure consisting of 12 negative scenarios that could be
encountered in everyday life. Of the 12 scenarios used to assess attributional and
cognitive style, six are academic and six are social. An example academic item is, “You take a test and get a bad grade.” An example social item is, “You want a
boyfriend/girlfriend but don’t have one.” After each scenario participants are asked to write down the cause of the event. Then the participant is asked to rate the degree to which cause is (1) internal, (2) stable, (3) global, (4) likely to cause other negative events, and (5) a reflection of a flawed self. Each of these response items are rated on a
7-point Likert scale with higher numbers representing more of the trait being assessed.
For example, on the internality response item, 1 = Totally caused by something else (not internal), 7 = Totally caused by something about me (internal). In adolescent samples, the measure has high levels of internal consistency (α = .81 to α = .91), test-retest reliability (r = .51, r = .73), predictive, and convergent validity (Hankin & Abramson, 2002) In the current study, we did not use four items because they were inappropriate for younger populations (i.e. “Your boss yells at you at work”). From the remaining eight scenarios, we created subscales of each AS for use in our analyses. Internal consistencies were high for the globality and stability subscales (αs = .78) and moderate for the
internality subscale (α = .59). These alphas are consistent with those obtained in another study that used the same abbreviated scale (we expected αs to drop as a function of using fewer items) with a similar population (Manuscript, Cole et al., 2007).
Procedures
Participating students completed a packet of questionnaires two times
approximately five months apart. The first assessment occurred about two months into the school year and the second assessment occurred two months before the end of the school year. Doctoral psychology students, advanced undergraduate students, and research assistants administered the questionnaires to the students. For middle school students, the research assistants read each item aloud, requiring all to proceed at the same pace, irrespective of their reading abilities. For the high school students, the more
difficult questionnaires were read, and then the students were allowed to work at their own pace. We presented questionnaires in two different orders by classroom, to minimize
the effects of order and fatigue on any instrument. Two to three additional research assistants circulated among the students answering questions before, during, and after questionnaire administration.
CHAPTER III
RESULTS
Preliminary Analyses
Table 1 contains descriptive statistics for the study measures. Means and standard deviations for the subscales of each measure were all comparable to those obtained in other studies (Dallaire et al., 2006; Hankin & Abramson, 2002; Peeke, 1995; Tangney, 1992; Tangney & Dearing, 2002a).
Hypothesis Testing
Goal 1. Our first goal was to examine the convergent and discriminant validity of
multiple measures of guilt, shame, BSB, and CSB in youth. Our specific hypotheses were (1) shame and CSB would converge onto one underlying construct, (2) guilt and BSB would converge onto one underlying construct, and (3) the construct underlying
shame/CSB would be distinct from the construct underlying guilt/BSB. To address these questions, we conducted an exploratory factor analysis (EFA) using our time 1 measures.
For the EFA, we used eight subscales, drawn from our measures (two guilt, two BSB, two shame, two CSB). We used principal axis factoring with oblique rotation. Based on the Kaiser criterion, we extracted two factors.
The shame and CSB subscales had the strongest loadings onto the first factor that we call shame/CSB. The guilt and BSB subscales had the strongest loadings onto the
second factor that we call guilt/BSB. We found support for our first hypothesis that shame and CSB load onto one common underlying construct. Primary loadings for our shame and CSB subscales onto the shame/CSB factor ranged from .49 to .82, and all cross loadings were less than .23. (see Table 2).
We found mixed support for our second hypothesis that guilt and BSB would converge onto one common underlying construct. The TOSCA-A-Guilt subscale and the ABQ-BSB subscale loaded strongly onto the guilt/BSB factor (.74 and .62, respectively), and their cross loadings were low (-.06 and .25). In contrast, the SSGS-Guilt subscale and the WIH-Q-BSB subscale loaded poorly onto the second factor (-.04 and .29,
respectively).
We found support for our third hypothesis that that the constructs underlying shame/CSB and guilt/BSB would be distinct. The shame/CSB factor and the guilt/BSB factor that emerged from the EFA correlated .25 with each other. Also, the cross loadings were less than .25 for the six subscales that loaded onto the expected factor. Our results for the first goal were replicated with time 2 measures (see Table 2).
Goal 2. Our second goal was to examine the relation of depressive symptoms to
shame/CSB and guilt/BSB. Our specific hypotheses were that (1) shame/CSB would correlate positively with depressive symptoms and (2) guilt/BSB would correlate negatively. To test these hypotheses we ran a series of multiple regressions in which the depression composite was regressed onto a guilt/BSB subscale and a shame/CSB subscale from a particular instrument. In each of these analyses we used the depression composite as the dependant variable and controlled for age. Because we ran several
multiple regressions, we chose .01 as our level of significance. We found strong support for the first hypothesis and mixed support for the second hypothesis. We also tested potential interactions with age. No such interactions were significant.
We found strong support for the positive relation of depressive symptoms to shame/CSB. The effect of shame/CSB was significant and in the expected direction for every measure. Higher levels of shame/CSB were associated with higher levels of depressive symptoms in each regression. The βs ranged from .41 to .64 (Mdn = .54, ps <
.001). We found mixed support for the negative relation between depressive symptoms and guilt/BSB. The effects of guilt/BSB were consistently smaller than (and sometimes in the opposite direction of) the effects of shame/CSB. (Some of the betas did not reach statistical significance at the .01 level). For the three significant guilt/BSB main effects, betas ranged from -.31 to .16 (Mdn = -.15, ps < .01, see Table 3). All the results from our regressions were replicated at time 2 except for the model with ABQ. The betas for the ABQ-BSB subscale were significant at both time points but in different directions (-.15 at time 1, .23 at time 2, ps < .01; see Table 3).
Goal 3. Our third goal was to examine the relation of shame/CSB and guilt/BSB
to Attributional Style. We hypothesized that (1) shame/CSB would correlate with Internality, Globality, and Stability and (2) guilt/BSB would correlate with Internality, but not Globality and Stability. To test these hypotheses we regressed each guilt/BSB and each shame/CSB subscale onto ACSQ Internality, Globality, and Stability scales. We also calculated zero-order correlations of each measure of guilt, shame, BSB, and CSB with the three AS subscales.
We found strong support for the first hypothesis. The multiple regressions were all significant and multiple R2s ranged from .11 to .22. In every regression, Globality was the only significant predictor (although Internality and Stability did have significant zero- order correlations with most of the shame/CSB scales).
We found mixed support for our second hypothesis that guilt/BSB would correlate with Internality, but not Globality or Stability. The multiple R2s for the measures of guilt and BSB were smaller, ranging from .08 to .10. For two measures (TOSCA-A and ABQ), Internality was the only significant predictor – as expected.
Results for the other two measures (SSGS and WIH-Q) were contrary to our
expectations. Globality was the only significant predictor of SSGS-Guilt, and none of the attributional dimensions were significant predictors of WIH-Q-BSB. Less than half of the zero-order correlations were significant, and results varied from measure to measure (see Table 4).
Goal 4. Our fourth goal was to examine the degree to which shame/CSB and
guilt/BSB predicted change in depressive symptoms over time. For each measure, we ran a multiple regression using a particular guilt/BSB subscale and the corresponding
shame/CSB subscale from the same instrument at time 1 as the predictors. In each of these analyses, we used the time 2 depression composite as the dependant variable and controlled for age and the time 1 depression composite. None of the main effects for shame/CSB or guilt/BSB were significant at the .01 level. We also tested the potential interactions with age. None of the interactions were significant (see Table 5). In
summary, none of the analyses revealed that shame/CSB or guilt/BSB predicted future depressive symptoms, controlling for prior levels of depressive symptomatology.
Goal 5. Our fifth goal was to examine the degree to which depressive symptoms
at time 1 predicted change in either shame/CSB or guilt/BSB over time. In a series of analyses, we regressed time 2 shame/CSB or guilt/BSB onto the time 1 depression composite, while controlling for age and either time 1 shame/CSB or time 1 guilt/BSB.
We also tested for interactions with age. None of these interactions was significant.
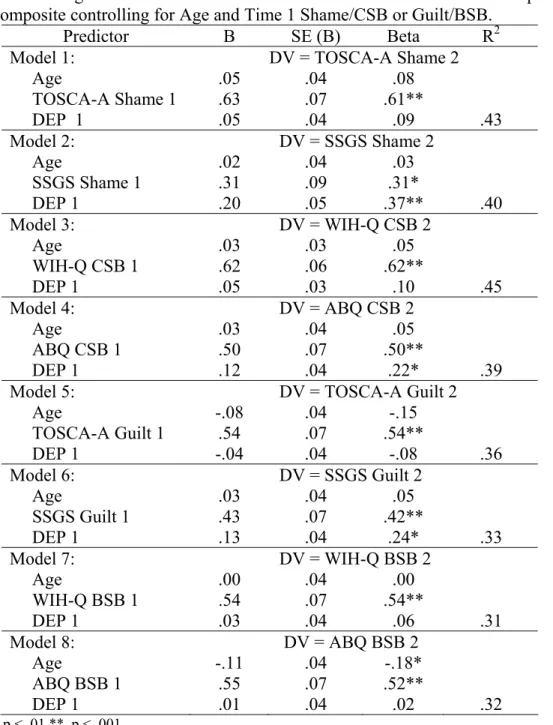
Overall, results were mixed. Half of the regressions with shame/CSB as the outcome variable were significant. On the one hand, higher depressive symptom scores at time 1 corresponded to higher shame scores on the SSGS (β = .37, p <.001) and a higher CSB scores on the ABQ (β = .22, p <.01). On the other hand, time 1 depressive
symptoms did not predict time 2 TOSCA-A-Shame scores or WIH-Q-CSB scores.
For the regressions with guilt/BSB as the outcome, only one out of four effects was significant. Higher levels of depressive symptoms corresponded to higher levels of guilt as measured by the SSGS (β = .24, p < .01). None of the other regressions were significant (see Table 6).
CHAPTER IV
DISCUSSION
Three main findings emerged from this study. First, four measures of shame and CSB converged onto a single underlying shame/CSB construct that is distinct from guilt/BSB measures, and is positively related to concurrent depressive symptoms and depressive attributional style. Second, the four measures of guilt and BSB did not converge onto a single underlying construct. Instead, results suggested that these measures represent two distinct subtypes of guilt/BSB. Third, longitudinal analyses revealed mixed results. Depressive symptoms predicted some, but not all measures of guilt, shame, BSB, and CSB. Conversely, none of the guilt, shame, BSB, and CSB measures predicted depressive symptoms. None of these findings was moderated by age.
Our first main finding was that measures of shame and CSB converged onto a single underlying shame/CSB construct that is positively correlated with both concurrent depressive symptoms and depressive attributional style. Furthermore, some evidence emerged that shame/CSB predicted the exacerbation of depressive symptoms over time.
The positive correlations of shame with measures of depressive symptoms and depressive attributional style replicate a number of previous studies (e.g., Harder, 1995; Luyten et al., 2002; Pineless et al., 2006; Tangney, 1992, 1996, 1998; Tangney & Dearing, 2002b;
Tangney et al., 1992). Likewise, the positive correlations of CSB with measures of depressive symptoms and attributional style replicate a separate body of research (e.g., Janoff-Bulman, 1979; Peterson, 1979; Peterson et al., 1981). In similar fashion, taken
together, this pattern of results suggests that we may be able to merge these heretofore independent literatures, possibly extrapolating from one to the other.
By applying what we know about shame to what we know about CSB (and vice versa), we can broaden our understanding of how shame/CSB relates to other constructs such as depression. On the one hand, research shows that CSB relates to a variety of factors associated with depression, such as feelings of loneliness and isolation, uncontrollability and helplessness (Janoff-Bulman, 1979; Peterson, 1979), and stressful life events (Peterson et al., 1981). On the other hand, the shame literature reveals positive correlations with anger/hostility (Tangney et al., 1992), substance abuse (Dearing,
Stuewig, & Tangney, 2005), eating disorders, low self-efficacy (Sanftner, Barlow, Marschall, & Tangney, 1995), and poor problem solving (Covert, Tangney, Maddux, &
Heleno, 2003). Taken as one, the shame/CSB construct relates to a broader range of negative emotions and psychopathology than either shame or CSB considered on its own.
With greater negative implications than previously evident, shame/CSB is an emotion of considerable importance to researchers and clinicians alike.
Our second key finding was that two of our guilt/BSB measures (i.e., the TOSCA-A and the ABQ) converged onto a single factor; however, the other two
measures (i.e., the SSGS and the WIH-Q) did not. Focusing on the concept of guilt/BSB measured by the TOSCA-A and ABQ subscales, we can integrate two literatures to broaden our understanding of the construct. Janoff-Bulman (1979) stressed the adaptive and restorative nature of BSB. She said that BSB is “a functional response to a traumatic event” that gives one resilience to cope and recover. The resilience inherent in BSB is reflected in its relation to controllability (Peterson, 1979; Peterson et al., 1981) and its
capacity to buffer feelings of loneliness, isolation, and hopelessness (Anderson et al., 1983; Anderson et al., 1988). The guilt literature tells us that the guilt/BSB construct commonly measured by the TOSCA-A and the ABQ may also be related to problem- solving (Covert et al., 2003), empathy, and perspective-taking (Leith & Baumeister, 1998; Tangney, 1991), which protects people from substance abuse (Dearing et al., 2005), eating disorders (Sanftner et al., 1995), and feelings of anger, resentment and hostility (Tangney et al., 1992). Our results lend support to the idea that the TOSCA-A and ABQ are indeed tapping a restorative guilt/BSB construct.
The kind of guilt/BSB assessed by the TOSCA-A and the ABQ, appears to have a restorative quality described by Tangney (1996). In the current study, the TOSCA-A correlated negatively with measures of depressive symptoms and positively with a measure of internality at both time points. The ABQ correlated negatively with measures of depressive symptoms at time 1, and it correlated positively with a measure of
internality at both time points. The negative correlation with depressive symptoms suggests a restorative quality. The TOSCA-A-Guilt includes items such as, “I would apologize and make sure my friend feels better,” “I would think: ‘This is making me anxious. I need to either fix it or replace it,’” and “I would feel unhappy and eager to correct the situation.” The ABQ-BSB includes items such as, “I should have studied harder,” “I should have reacted differently when I got the assignment,” and, “I should have asked the teacher to let me do the report another time.” These items from the TOSCA-A-Guilt an ABQ-BSB reflect a tendency to take responsibility for one’s actions.
They suggest a focus on restoration, apology, and the prevention of future negative outcomes. Supporting this conception, our results revealed that both the TOSCA-A-Guilt
and ABQ-BSB were negatively correlated with depressive symptoms. Also supporting this conception is our discovery that these two instruments correlated with internal (but not global or stable) attributions, reflecting a sense of controllability and a willingness to accept responsibility for negative events. Such attitudes can protect individuals from certain types of psychopathology, and foster healthier interpersonal relationships (Covert et al., 2003; Dearing et al., 2005; Leith & Baumeister, 1998; Sanftner et al., 1995;
Tangney, 1991).
The two other instruments (SSGS and WIH-Q) did not converge onto the common guilt/BSB construct, described above, which suggests some diversity among measures of guilt and BSB. Examination of the SSGS and the WIH-Q items is
illuminating, in that they do not reflect the restorative or problem-solving content of the TOSCA-A or the ABQ. The guilt/BSB items from the SSGS and WIH-Q seem to focus on internal attributions, but without the anticipation of what might be done differently next time: “Did this happen because of something you did or didn’t do? (WIH-Q),” and,
“I feel tension about something I have done,” and, “I feel bad about something I have done” (SSGS). Some research supports the existence of nonadaptive or nonrestorative guilt both in adults, (Harder, Cutler, & Rockart, 1992; Kugler & Jones, 1992b; O'Connor, Berry, & Weiss, 1999) and in children (Ferguson et al., 1999). We speculate that two subtypes of guilt/BSB may exist: one that is restorative and focused on problem-solving, measured by the TOSCA-A and the ABQ, and reflective of Tangney and Janoff-
Bulman’s definitions (Janoff-Bulman, 1979; Tangney, 1995); the other that is not particularly restorative, measured by the SSGS and WIH-Q, and reflective of Harder’s
definition (Harder, 1995; Harder et al., 1992; Kugler & Jones, 1992b). More research is needed to clarify and distinguish these constructs.
Our third set of findings is longitudinal. On the one hand, we found no evidence that guilt, shame, BSB, and CSB predict change in depression over time. These null findings are consistent with two other studies. Peterson et al. (1981) found no relation of either BSB or CSB to future depression after controlling for previous depression.
Similarly, Andrews et al. (2002) found no relation between TOSCA-A (shame or guilt) and change in depression over time. They did, however, find that a different measure of shame, The Experience of Shame Scale (ESS), did relate to depression prospectively. The ESS predicted later depressive symptoms, even after controlling for TOSCA-Shame, TOSCA-A-Guilt, and previous depressive symptoms. The ESS assesses three kinds of shame: shame focused on a person’s character, behavior, and body image. Six of the 25 items begin, “Have you worried,” and although the ESS does correlate highly with TOSCA-A-Shame (r=.61), it may be tapping a somewhat different construct. A third study by Stuewig & McCloskey (2005), using the TOSCA-A and the Adolescent Shame Measure ([ASM] Reimer, 1995), found that shame predicted prospective depression two years later. Unfortunately, their control for prior depressive symptoms was obtained six years prior to the other predictors. Incomplete control of prior depression may be partially responsible for the apparently significant effect of shame on depressive symptoms. In sum, when longitudinal studies (a) have used the TOSCA-A and the ABQ and (b) have implemented good statistical control for prior levels of depression, shame, and/or CSB have not predicted depression over time.
On the other hand, we did find some evidence that depression predicts change in shame, CSB, and guilt –at least on some measures. Depressive symptoms predicted prospective shame, CSB, and guilt while controlling for previous levels of each. To our knowledge no other studies have addressed this directional relation. In conjunction with the nonsignificant effects of shame/CSB and guilt/BSB on depression, we speculate that these constructs may be better regarded as effects, rather than causes of depression, at least in youth. These results, however, are tentative. We only found evidence of the effect of depression on shame/CSB for two of our four measures. For the effect of depression on guilt/BSB, we found evidence for only one out of four measures. Future research will need to re-examine the longitudinal relation between guilt, shame, BSB, and CSB as the definition and measurement of these constructs continue to be refined.
The current study makes several unique contributions to the existing literature.
First, the study showed that shame (as defined by Tangney) and CSB (as defined by Janoff-Bulman) are extremely similar constructs in the context of depression. Some researchers have noted that the definitions of these two constructs have much in common;
however, no study has fully examined them simultaneously. A second contribution is that the study lends support to the existence of two subtypes of guilt/BSB. We found support for the existence of a restorative and adaptive type of guilt/BSB, similar to Tangney’s and Janoff-Bulman’s conceptualization (Janoff-Bulman, 1979; Tangney, 1995). We also found that other measures of guilt/BSB may be tapping a different kind of non-restorative guilt/BSB similar to Harder’s conceptualization (Harder, 1995; Harder et al., 1992;
Kugler & Jones, 1992b). A third contribution is our demonstration that depressive symptoms are positively related to shame/CSB, negatively (and more weakly) related to
restorative guilt/BSB, and essentially unrelated to non-restorative guilt/BSB. This contribution suggests important clinical implications. Helping people to acknowledge characterological and shameful attributions and then change them to more restorative and behaviorally-focused ones may be instrumental in treating depression. Finally, this study added to the small, but growing body of literature on the longitudinal relation between depressive symptoms and feelings of guilt, shame, BSB, and CSB.
Several shortcomings of this study suggest avenues for future research. First, our study used measures that jointly assessed either guilt and shame or BSB and CSB. We did not use any of the guilt-only or shame-only measures that are available, such as the Experiencing Shame Scale or the Guilt Inventory (Kugler & Jones, 1992a). We also did not use the Adolescent Shame Measure or the Adapted Shame and Guilt Scale
(Hoblitzelle, 1982). Future studies using a broader range of guilt, shame, BSB, and CSB measures could help clarify two questions raised by this paper: (1) why are the
longitudinal results mixed and (2) are there really two subtypes of guilt/BSB, one that is restorative or adaptive, and one that is not? Another shortcoming is that our sample was primarily Caucasian and drawn from a middle-class population. Studies with more sample diversity could assess the generalizability of our results. Also, our results were obtained in a non-clinical population. Shame/CSB or guilt/BSB could relate differently to depressive symptoms in more severely depressed individuals. Future studies could
evaluate whether our results replicate in clinical or more severely depressed samples.
Finally, our relatively narrow age range may have prevented us from detecting age as a possible moderator in our results. Shame/CSB and guilt/BSB require self-evaluation, perspective-taking, and moral judgment skills that clearly emerge over the course of
human development. With a broader age range, researchers might be able to detect developmental changes in the nature of these constructs and in their relation to depression. Such avenues of research could contribute to our understanding of developmental differences in the very nature of depression.
APPENDIX A
Table 1
Means and standard deviations of the TOSCA-A, SSGS, WIH-Q, CDI, and the CESD at time 1 and time 2.
Mean (SD)
Subscale Time 1 Time 2
TOSCA-A (Shame) 38.86 (8.71) 36.13 (9.35) TOSCA-A (Guilt) 56.59 (8.99) 56.17 (9.11)
SSGS (Shame) 6.76 (3.36) 6.43 (3.36)
SSGS (Guilt) 9.05 ( 4.10) 8.63 (4.36)
WIH-Q (BSB) 35.35 (9.39) 35.77 (9.96)
WIH-Q (CSB) 29.71 (9.43) 29.24 (9.84)
CDI 9.35 (7.86) 8.17 (8.06)
CESD 21.04 (11.66) 18.88 (12.06)
ACSQ Internality 35.00 (7.97) --
ACSQ Globality 22.89 (8.41) --
ACSQ Stability 26.51 (8.36) --
ACSQ Mean Scale Total (IGS) 3.52 (.83) --
Note. SD = Standard Deviation; TOSCA-A = Test of Self-Conscious Affect-Adolescent measure; SSGS = State Shame and Guilt Scale; ABQ = Attributional Blame Questionnaire; WIH-Q = Why it Happened Questionnaire; CDI = Children’s Depression Inventory; CESD = Center for Epidemiological Studies Depression Scale; ACSQ = Adolescent Cognitive Style Questionnaire; BSB = behavioral self-blame; CSB
= characterological self-blame.
Table 2
Time 1 and Time 2 Exploratory Factor Analysis of the Subscales of TOSCA-A, SSGS, ABQ, and WIH-Q.
Time 1 Time 2
Measure Shame/CSB Guilt/BSB Shame/CSB Guilt/BSB
Shame/CSB Subscales
TOSCA-A Shame .59 .23 .71 .04
SSGS Shame .82 -.38 .79 -.23
WIH-Q CSB .49 .06 .55 .04
ABQ CSB .66 .10 .79 .02
Guilt/BSB Subscales
TOSCA-A Guilt -.06 .74 -.16 .80
SSGS Guilt .63 -.04 .61 -.05
WIH-Q BSB .45 .29 .45 .15
ABQ BSB .25 .62 .25 .54
Note. TOSCA-A = Test of Self-Conscious Affect-Adolescent measure; SSGS = State Shame and Guilt Scale; ABQ = Attributional Blame Questionnaire; WIH-Q = Why it Happened Questionnaire; BSB = behavioral self-blame; CSB = characterological self-blame.
Table 3
Cross-sectional Regressions of the Depression Composite onto Shame/CSB and Guilt/BSB subscales.
Predictor B SE (B) Beta R2
Time 1
Model 1:
Age .11 .06 .11
TOSCA-A Shame 1.03 .12 .55**
TOSCA-A Guilt -.58 .12 -.31** .32
Model 2:
Age .20 .05 .20**
SSGS Shame 1.20 .11 .64**
SSGS Guilt .29 .11 .16* .54
Model 3:
Age .10 .07 .10
WIH-Q CSB .77 .15 .41**
WIH-Q BSB .07 .15 .04 .19
Model 4:
Age .15 .07 .15*
ABQ CSB 1.00 .14 .53**
ABQ BSB -.32 .14 -.15* .24
Time 2
Model 1:
Age -.01 .08 -.01
TOSCA-A Shame .72 .13 .39**
TOSCA-A Guilt -.47 .14 -.24** .19
Model 2:
Age .06 .07 .05
SSGS Shame .94 .14 .50**
SSGS Guilt .25 .14 .14 .35
Model 3:
Age .06 .08 .06
WIH-Q CSB .69 .17 .36**
WIH-Q BSB .00 .16 .00 .14
Model 4:
Age .01 .08 .01
ABQ CSB 1.06 .14 .55**
ABQ BSB -.44 .15 .23* .14
* p < .01 ** p < .001
Note. TOSCA-A = Test of Self-Conscious Affect-Adolescent measure; SSGS = State Shame and Guilt Scale; ABQ = Attributional Blame Questionnaire; WIH-Q = Why it Happened Questionnaire; CSB = characterological self-blame; BSB = behavioral self-blame. No interactions were significant at p < .01.
Table 4
Regressions of Shame/CSB or Guilt/BSB onto ACSQ Internality, Globality, and Stability Subscales.
Predictor Pearson’s r B SE (B) Beta R2
Model 1: DV = TOSCA-A Shame
Internality .19* .11 .09 .10
Globality .37* .39 .10 .36**
Stability .24* -.04 .10 -.04 .14
Model 2: DV = SSGS Shame
Internality .15 .00 .03 -.12
Globality .46* .16 .04 .40**
Stability .36* .04 .04 .10 .22
Model 3: DV = WIH-Q CSB
Internality .23* .13 .09 .11
Globality .36* .28 .10 .25*
Stability .32* .13 .11 .11 .15
Model 4: DV = ABQ CSB
Internality .19* .25 .14 .14
Globality .30* .64 .16 .37**
Stability .14 -.27 .17 -.16 .11
Model 5: DV = TOSCA-A Guilt
Internality .16 .28 .09 .25*
Globality -.16 -.24 .11 -.21
Stability -.07 -.04 .11 -.04 .08
Model 6: DV = SSGS Guilt
Internality .08 .00 .04 -.01
Globality .32* .18 .05 .36**
Stability .18 -.03 .05 -.06 .10
Model 7: DV = WIH-Q BSB
Internality .25* .22 .09 .18
Globality .26* .21 .10 .19
Stability .23* .04 .11 .03 .10
Model 8: DV = ABQ BSB
Internality .22* .46 .14 .25*
Globality .14 .38 .16 .22
Stability .02 -.39 .17 -.23 .08
* p < .01 ** p < .001
Note. TOSCA-A = Test of Self-Conscious Affect-Adolescent measure; SSGS = State Shame and Guilt Scale; ABQ = Attributional Blame Questionnaire; WIH-Q = Why it Happened Questionnaire; ACSQ = Adolescent Cognitive Style Questionnaire; CSB = characterological self-blame.
Table 5
Regressions of Time 2 Depression onto Guilt/BSB and Shame/CSB, Controlling for Time 1 Depression and Age.
Predictor B SE (B) Beta R2
Model 1
DEP 1 .65 .07 .67**
Age .06 .06 .05
TOSCA-A Shame 1 .08 .12 .04
TOSCA-A Guilt 1 -.13 .12 -.07 .51
Model 2
DEP 1 .63 .08 .62**
Age .05 .06 .04
SSGS Shame 1 .31 .15 .17
SSGS Guilt 1 -.06 .12 -.03 .54
Model 3
DEP 1 .70 .06 .70**
Age .03 .06 .03
WIH-Q CSB 1 -.10 .13 -.05
WIH-Q BSB 1 . 27 .12 .14 .53
Model 4
DEP 1 .68 .06 .69**
Age .03 .06 .02
ABQ CSB 1 .15 .13 ..08
ABQ BSB 1 -.08 .12 -.04 .53
* = p<.01, ** = p<.001
Note. TOSCA-A = Test of Self-Conscious Affect-Adolescent measure; SSGS = State Shame and Guilt Scale; ABQ = Attributional Blame Questionnaire; WIH-Q = Why it Happened Questionnaire; DEP = depression composite; CSB = characterological self-blame; BSB = behavioral self-blame. No interactions with age were significant at p<.01.
Table 6. Regressions of Time 2 Shame/CSB or Guilt/BSB onto Time 1 Depression Composite controlling for Age and Time 1 Shame/CSB or Guilt/BSB.
Predictor B SE (B) Beta R2
Model 1: DV = TOSCA-A Shame 2
Age .05 .04 .08
TOSCA-A Shame 1 .63 .07 .61**
DEP 1 .05 .04 .09 .43
Model 2: DV = SSGS Shame 2
Age .02 .04 .03
SSGS Shame 1 .31 .09 .31*
DEP 1 .20 .05 .37** .40
Model 3: DV = WIH-Q CSB 2
Age .03 .03 .05
WIH-Q CSB 1 .62 .06 .62**
DEP 1 .05 .03 .10 .45
Model 4: DV = ABQ CSB 2
Age .03 .04 .05
ABQ CSB 1 .50 .07 .50**
DEP 1 .12 .04 .22* .39
Model 5: DV = TOSCA-A Guilt 2
Age -.08 .04 -.15
TOSCA-A Guilt 1 .54 .07 .54**
DEP 1 -.04 .04 -.08 .36
Model 6: DV = SSGS Guilt 2
Age .03 .04 .05
SSGS Guilt 1 .43 .07 .42**
DEP 1 .13 .04 .24* .33
Model 7: DV = WIH-Q BSB 2
Age .00 .04 .00
WIH-Q BSB 1 .54 .07 .54**
DEP 1 .03 .04 .06 .31
Model 8: DV = ABQ BSB 2
Age -.11 .04 -.18*
ABQ BSB 1 .55 .07 .52**
DEP 1 .01 .04 .02 .32
* p < .01 ** p < .001
Note. TOSCA-A = Test of Self-Conscious Affect-Adolescent measure; SSGS = State Shame and Guilt Scale; ABQ = Attributional Blame Questionnaire; WIH-Q = Why it Happened Questionnaire; CSB = characterological self-blame; DEP = depression composite. No interactions with age were significant at p <
.01.
APPENDIX B
Exploratory Factor Analyses of each of our measures.
In addition to the measures described in this paper, we also administered the Personal Feelings Questionnaire-2 (PFQ2; (Harder & Zalma, 1990) to assess guilt and shame. This measure was not used in our analyses, but will be discussed here.
We examined the factor structure of each of our measures using principal axis factor analysis with oblique rotation. For each of our analyses, we used a participant’s data only if they had answered all items for the measure of interest. At time 1, we conducted five EFAs (one for each guilt/shame and BSB/CSB measure). We then repeated the analyses at time 2. At both time points, a two-factor solution emerged for every measure except the PFQ-2 (for description of the PFQ-2, see Appendix C).
We ran the first set of EFAs on the TOSCA-A for time 1 and time 2. To reduce item-level nuisance covariance, we converted the 30 items into 10 packets. We did this by randomly assigning the 15 shame items into 5 shame packets and the 15 guilt items into 5 guilt packets. At both time points a clear two-factor solution emerged and all packets loaded onto the expected factor. Primary factor loadings for both factors ranged from .57 to .83 across time points and all cross loadings were less than .19 (see Table A1).
For the State Shame and Guilt Scale (SSGS) we conducted the EFAs on 10 items (5 guilt and 5 shame). Because of the smaller number of items, we did not create packets.
The initial EFAs revealed a two-factor solution at both time 1 and time 2. However, one guilt item loaded onto the shame factor at both time points and one shame item loaded
inconsistently across time points. We dropped the two items and reran the EFAs on the remaining eight items (four guilt, four shame). A two-factor solution emerged and all items loaded onto the expected factors at both time points. Primary factor loadings for both factors ranged from .50 to .86 across time points and all cross loadings were less than .30 (see Table A2).
For the PFQ-2, we conducted the EFAs on the 12 items that measure guilt and shame. At each time point, a one-factor solution emerged. The PFQ-2 did not
differentiate between guilt and shame.
We ran EFAs for the WIH-Q at each time point using items from the 12 negative scenarios. We reduced item-level nuisance covariance by converting the 24 item
responses into 12 packets. We randomly paired one social scenario with one academic scenario to create six BSB and six CSB packets. At both time 1 and time 2, a clear two- factor solution emerged. All packets loaded onto the expected factors. Primary factor loadings for both factors ranged from .48 to .89 across time points and cross loadings were all less than .28 (see Table A3).
For the ABQ, we converted the 48 item responses into 12 packets (6 BSB packets and 6 CSB packets). Based on empirical and/or conceptual problems, we dropped two items (both BSB) and switched one CSB item to a BSB item. After dropping the two items we reran the EFAs with the remaining 10 variables. A clear two-factor solution emerged at both time points with five variables representing each factor. All packets loaded onto the proper factors with primary factor loadings ranging from .47 to .87 across time points. Cross loadings for the ABQ were all less than .38 (see Table A4).
Table A1
TOSCA-A Exploratory Factor Analyses for Time 1 and Time 2.
Time 1 Time 2
Packet Shame Guilt Shame Guilt
Shame 1 .71 -.03 .83 -.17
Shame 2 .73 -.08 .76 -.14
Shame 3 .72 .19 .76 .12
Shame 4 .57 .20 .71 .16
Shame 5 .61 -.10 .64 .04
Guilt 1 .03 .79 -.03 .73
Guilt 2 .01 .78 -.01 .78
Guilt 3 -.07 .77 -.08 .71
Guilt 4 -.04 .74 .08 .74
Guilt 5 .11 .69 .07 .73
Note. TOSCA-A = Test of Self-Conscious Affect-Adolescent measure;
Time 1 Factor Correlation = .26, Time 2 Factor Correlation = .10.
Table A2.
SSGS Exploratory Factor Analyses for Time 1 and Time 2.
Note. SSGS = State Shame and Guilt Scale; Time 1 Factor Correlation = .52, Time 2 Factor Correlation = .65.
Time 1 Time 2 Item Shame Guilt Shame Guilt Shame Items
I want to sink into floor and disappear (Shame 1) .77 -.08 .86 -.14 I Feel like I am a bad person (Shame 2) .63 .10 .77 .00 I feel worthless, powerless (Shame 3) .83 -.06 .76 .06 I feel humiliated, disgraced (Shame 4) .63 .03 .63 .03 I feel small (Shame 5) .60 -.01 .27 .14 Guilt Items
I feel bad about something I have done (Guilt 1) .04 .81 -.04 .85 I feel like apologizing, confessing (Guilt 2) -.12 .70 -.06 .73 I cannot stop thinking about something bad I have done (Guilt 3) .30 .50 .17 .67 I feel tension about something I have done (Guilt 4) .22 .59 .20 .51 I feel remorse, regret (Guilt 5) .61 .21 .62 .12
Table A3
WIH-Q Exploratory Factor Analyses for Time 1 and Time 2.
Time 1 Time 2
Packets CSB BSB CSB BSB
CSB 1 .68 -.05 .86 -.05
CSB 2 .67 .08 .83 -.11
CSB 3 .79 .00 .81 -.08
CSB 4 .71 .06 .81 .02
CSB 5 .79 -.08 .63 .12
CSB 6 .59 .10 .61 .08
BSB 1 -.02 .76 -.08 .89
BSB 2 -.07 .78 -.03 .81
BSB 3 .00 .75 .03 .70
BSB 4 -.01 .75 .06 .69
BSB 5 .07 .54 -.01 .68
BSB 6 .28 .48 -.05 .69
Note. WIH-Q = Why it Happened Questionnaire; BSB = behavioral self-blame packet designed by authors; CSB = characterological self-blame packet designed by authors.
Time 1 Factor Correlation = .60, Time 2 Factor Correlation = .66.
Table A4
ABQ Exploratory Factor Analyses for Time 1 and Time 2
Time 1 Time 2
Packet CSB BSB CSB BSB
CSB 1 .87 -.04 .86 -.06
CSB 2 .83 -.10 .71 .03
CSB 3 .70 .04 .83 -.11
CSB 4 .66 .03 .75 -.04
CSB 5 .55 .13 .61 .17
CSB 6 -.20 .83 -.19 .83
BSB 1 .04 .81 -.04 .83
BSB 2 .06 .70 .08 .59
BSB 3 .20 .60 .11 .70
BSB 4 .13 .60 .36 .46
BSB 5 .29 .44 .32 .51
BSB 6 .46 .30 .45 .22
Note. ABQ = Attributional Blame Questionnaire; BSB = behavioral self-blame;
CSB = characterological self-blame.
Time 1 Factor Correlation = .55, Time 2 Factor Correlation = .45.
APPENDIX C
We administered but did not end up using the Personal Feelings Questionnaire-2 (PFQ-2). The PFQ-2 (Harder & Zalma, 1990) is a self-report measure with 22 items that describe different kinds of feelings. Six items assess guilt, 6 items assess shame, and the other 10 are dummy items. Example guilt items are: “intense guilt,” “remorse,” and
“regret.” Example shame items are: “feeling ‘childish’,” feelings of blushing,” and feeling disgusting to others.” The participants are asked to rate how much common each feeling is for them. Response items are rated on a 5-point Likert scale (0=you never experience the feeling to 4=you experience the feeling continuously or almost continuously). In a college-aged sample, the measure revealed high levels of internal consistency (α=.72 for the guilt subscale, α=.78 for the shame subscale), test-retest reliability (r=.85 for the guilt subscale, r=.91 for the shame subscale), predictive validity, and convergent validity (Harder & Zalma, 1990).
In the current study some items were modified to make the measure more age-appropriate. For example, “self-consciousness” was changed to, “self-consciousness (like everyone is looking at you).”
Response items were also modified to make them clearer and easier to understand for younger participants. We asked participants how often they felt each feeling. Response items ranged from 0=Never to 4=Always. With our adolescent sample the measure had high levels of internal
consistency at both time points (αs=.88). Using oblique rotation and principal axis factoring, factor analysis of this measure with our sample revealed a one-factor solution.
APPENDIX D
TOSCA-A
On the following pages, you will find descriptions of a variety of situations. After each, you will see several statements about different ways people might think or feel.
As you read about each, really imagine that you are in the situation now. Imagine how you might think or feel. Then indicate how likely it is that the statement would be true for you.
There are no right or wrong answers to these questions. We’re simply interested in your own thoughts and ideas about these situations.
1. You trip in the cafeteria and spill your friend’s drink.
2. For several days you put off talking to a teacher about a missed
assignment. At the last minute you talk to the teacher about it, and all goes well.
Not at all likely
Unlikely
Maybe (half &
half) Likely Very likely a) I would be thinking that everyone is
watching me and laughing………
1 2 3 4 5
b) I would feel very sorry. I should have
watched where I was going………...
1 2 3 4 5
Not at
all likely Unlikely
Maybe (half &
half) Likely
Very likely
a) I would regret that I put it off…………
1 2 3 4 5
3. While playing around, you throw a ball and it hits your friend in the face.
4. You and a group of classmates worked very hard on a project. Your teacher singles you out for a better grade than anyone else.
5. You break something at a friend’s house and then hide it.
Not at
all likely Unlikely
Maybe (half &
half) Likely
Very likely a) I would feel stupid that I can’t even throw
a ball……… ………
1 2 3 4 5
b) I would apologize and make sure my
friend feels better………
1 2 3 4 5
Not at
all likely Unlikely
Maybe (half &
half) Likely
Very likely a) I would feel alone and apart from my
classmates………
1 2 3 4 5
b) I would tell the teacher that everyone
should get the same grade………
1 2 3 4 5
Not at
all likely Unlikely
Maybe (half &
half) Likely
Very likely a) I would think: “This is making me
anxious. I need to either fix it or replace
it.”………..
1 2 3 4 5
b) I would avoid seeing that friend for a