A CNS produces lists of the species present in the first x number of samples collected in each habitat. As a result, relative species abundances can only be compared between sites of the same habitat type. The design for a VES will depend on the objectives of the study (whether it is a one-time inventory or a long-term monitoring program and, if the latter, whether the intention is to determine the phenology of species composition, phenology of species abundances, or both), the specific habitat and the size of the area to be surveyed, the desired periodicity of the sampling regime (partial and seasonal), and the species composition.
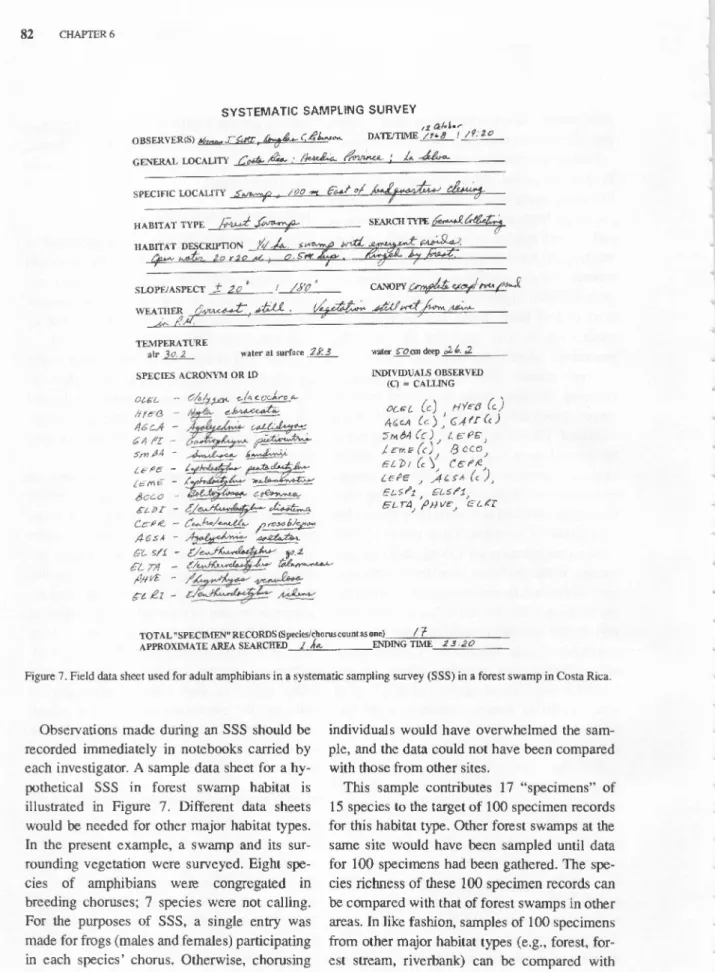
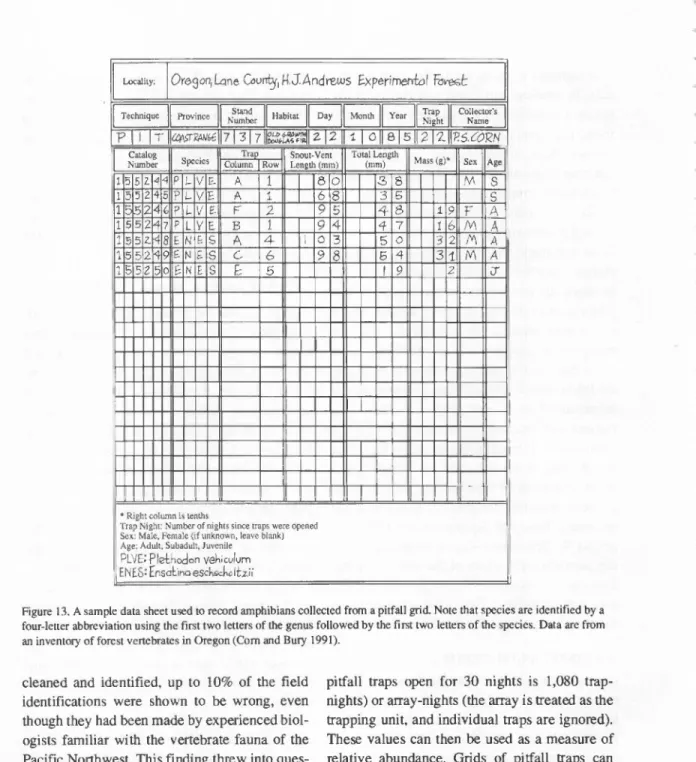
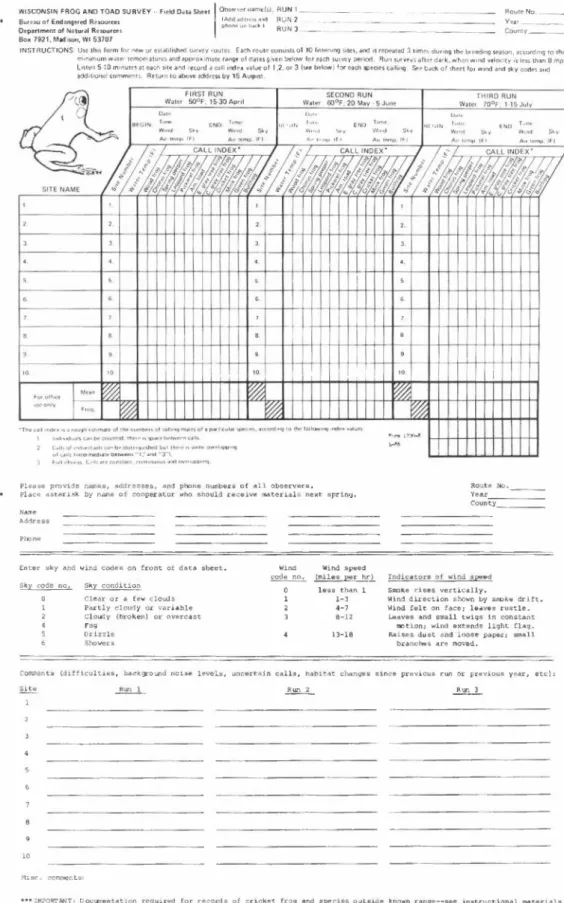
Depending on the objectives of the study, the animals encountered can be observed alone (assuming positive identification is possible without holding the animal), or they can be temporarily captured for positive identification and measurement (see Appendix 1). ) and then released at the place of capture. DATA HANDLING AND INTERPRETATION The types of data to be collected depend on the objectives of the study and the time and personnel available. Data sheets can be simple or complex depending on the objectives of the study (Fig. 10).
Audio Strip Transects
The first is that the observer is fully familiar with the species-specific calls. One of the advantages of this technique is that the data can be obtained by a single person. Band area is the width of the band (ie, twice the average call detection distance of the species) multiplied by the length of the transect.
The mean density of calling males of the species in the study area during the peak of breeding activity is the average of the maximum densities recorded on each transect.
Quadrat Sampling
This interval is determined by plotting the average number of callers or choruses against the week or month of the study and identifying the peaks of activity. In species assemblages that have a significant proportion of riparian species, the riparian and non-riparian components of the assemblage may be sampled from separate groups. When trying to test for temporal or spatial differences in the number, relative abundance, and density of species, statistical testing of the null hypothesis that any differences detected are due to chance alone can be used.
This technique is superior when sampling a given area before and after a certain type of treatment (e.g. habitat disturbance, such as biocide treatment). Again, repeated sampling of an area (or other areas) should be carried out at similar times of the year. If small squares (1 x 1 m) are used, it is best for one person to search all the squares.
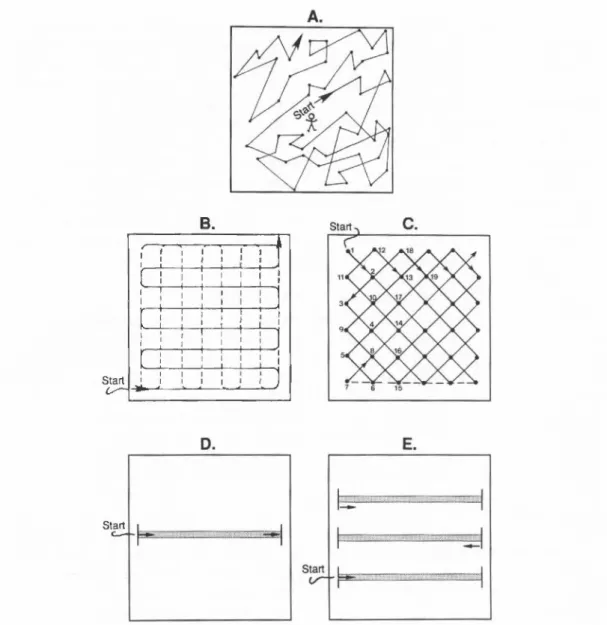
On a map of the sampling area of interest, relatively large squares (e.g. 100 x 100 m, although this specific size is not critical) are identified or located. It is easiest to complete this phase of study design before going into the field. Once in the field, the experimenter moves to the center of the first square to begin a random walk.
Acting on such temptation leads to sampling bias (see Chapter 4) and may invalidate any generalizations possible from statistical analysis (or the analysis itself), or it may defeat the purpose of the study, which is to obtain accurate estimates of species numbers. acquire, undermine. , relative abundances and densities. Species richness can be obtained from a simple count of the number of species found in the target area, just as with other sampling methods.
Transect Sampling
Randomization can be implemented if each person samples the same number of transects in each area and if those transects are randomly assigned to each person. This line can be at the bottom of the mountain (if the whole mountain is to be sampled) or at any contour line on the mountain. This can be accomplished by following a given compass direction and running a rope (anchored at one end) the length of the transect.
Before initial sampling begins, all transects should be staked out using a tape measure so that the transects can be surveyed in any order. When subsections of transects are sampled, each subsection can be used as an independent data point. When transects are subsampled, the subsection results can be used as sampling units in any of the inferential or descriptive statistical procedures appropriate to answer the research question.
Spot sampling can be used to determine the number, relative abundances and densities of species occurring in distinct sub-units of an area of interest. Statistical inferences can be used either for monitoring (changes in a given area over time) or for inventory (differences between areas of interest at a given time). The technique can also be used to study the amphibian fauna of a specific patch type or habitat subunit.
First, it is assumed that each patch has an unambiguous edge and can be precisely defined. If each patch's location is recorded (e.g., latitude and longitude), nearest neighbor and clustering techniques can be used to determine spatial distribution patterns.
Straight-Line Drift Fences and Pitfall Traps
Slide fences and pitfall traps typically sample terrestrial salamanders very well, but undersample species closely associated with specific microhabitats. Aneides and Batrachoseps are rarely caught in trap traps (with or without fences), but E. Drift fences catch amphibians moving on the surface of the soil and redirect them to a trap or funnel trap.
Traps without fences work in a similar way, but individual traps intercept only a few inches of soil compared to several meters of fence. If pitfall traps are used as live traps and population estimates are derived from mark-recapture data, biases due to trap avoidance or trap attraction must be considered. Corn and Bury (1991) used the same pitfall trap nets for 50 days in 1984 and 30 days in 1985 and removed all captured animals; amphibian catches did not differ between years, except that one species was more numerous in another year.
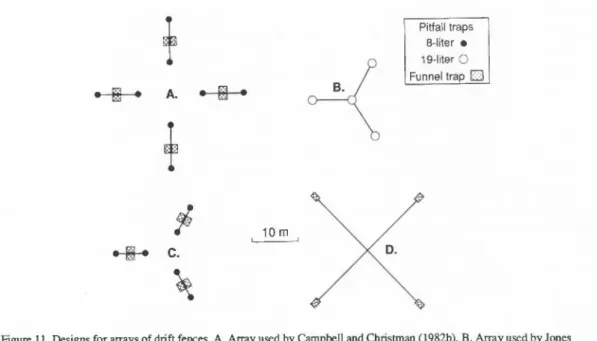
Researchers have rarely used the same design for series of drift fences or pitfall grids. Various array designs for rectilinear drift fences with pitfalls and funnel traps are possible (see Vogt and Hine 1982). The most commonly used traps are 19 liter plastic buckets and 8 liter cans.
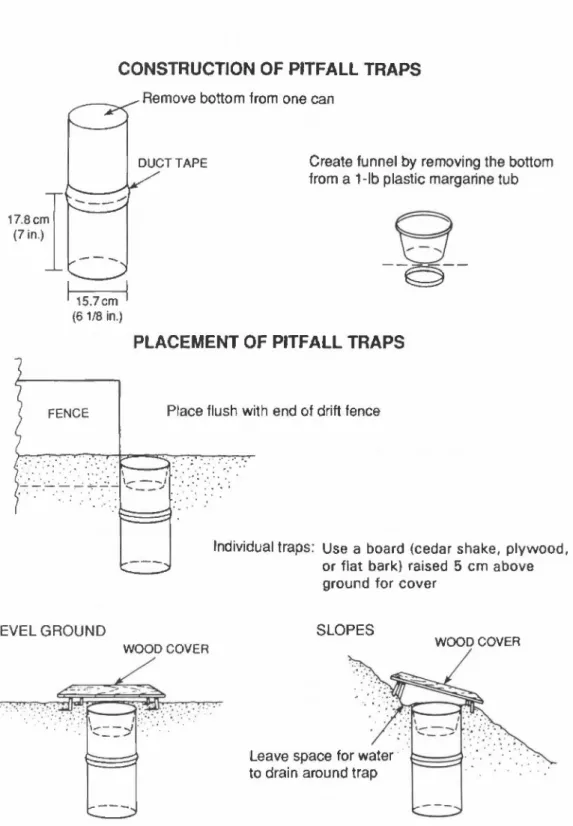
Beauregard and Leclair 1988; D. E. Runde and K. M. Enge, unpublished. data), especially in areas with saturated soils where trap traps tend to fill with water. Smaller trap traps (8-gallon) are made by removing both ends or one end of two #10 tin cans (i.e., 3-lb coffee cans) and taping the open ends of the two cans together (Figure 12 ).
CONSTRUCTION OF PITFALL TRAPS
PLACEMENT OF PITFALL TRAPS
Surveys at Breeding Sites
Data from breeding site surveys can be used to estimate species richness or abundance of breeding adults or larvae at one or more sites. Monitoring of adults at the breeding site is easiest if the breeding is concentrated in a narrow, well-defined period, but it can also be done when the breeding period is extended. Breeding site studies are most thorough in small, shallow bodies of water that are devoid of emergent vegetation and that researchers can survey in a relatively short period of time.
If the habitat is extensive, populations can be taken either aurally (adult males only) or visually (adults and larvae under certain conditions) along randomly located transects (see "Visual Encounter Surveys" and "Audio Strip Transects," techniques. 2 and 3) . Three examples—the regional survey, the single area survey and the survey along a stream or river—will demonstrate the range of approaches that can be used for breeding site surveys. The data from breeding site surveys can be used to produce a list of amphibian species encountered, or it can be combined with other information to form a basis for detailed ecological and population analyses.
Species lists can be compared across sites, although we caution against attributing too much species absence if only a few breeding sites are surveyed per site. territory. If multiple breeding sites are surveyed in each of two or more study areas, the frequency of occurrence can be compared across study areas. Similarly, species richness or abundance can be compared across study areas or across time within the same study area.
Data can be pooled across many breeding sites to produce species lists and relative abundances for the entire area. Breeding site surveys can be used to estimate actual population size and operational sex ratio, two parameters of conservation importance (Gilpin and Soule Falconer 1989).
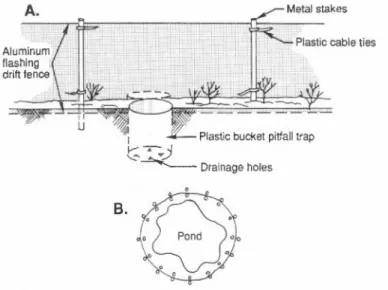
Drift Fences Encircling Breeding Sites
If possible, the lower edge of the fence should be sunk into the ground 20 cm below the surface (a mechanical backhoe greatly facilitates installation). A hole (slot) must be cut in the bottom of the bucket, which will allow excess rainwater to escape, but not trapped animals. If shrews are common in the area and are frequently hunted, the bottom of the bucket should be left intact.
In dry areas, absorbent material (preferably a small square, 5 to 8 cm thick, of synthetic foam used for seat cushions; natural and synthetic sponges break down quickly) should be placed in the bottom of the bucket and soaked with water to provide moisture and cover. To reduce intrusion, barriers can be placed on top of the fence that form the letter "T". Which of these approaches is most appropriate depends on the extent of the sampled area relative to the size of the habitat.
An equal number of samples are taken on each trip from each depth zone parallel to the in-water shoreline sampling transect. In this case, the total length of the transect changes as the pond expands and contracts. It is important that the person taking the sample moves slowly so that the trawl stays on the bottom of the pond.
No additional species should be captured for at least the last 10% of the sampling period or sampling sweep. First, the maximum depth that can be taken out is limited by the height of the cabinet. The extent to which this occurs can be highly dependent on the skill and experience of the operator.
For depletion methods, the critical assumption is that each sampling unit removes a constant fraction of the individuals in the habitat.