The Stigmatization of Concealable and Apparent Intellectual Disabilities Claire Lundy
Submitted in fulfillment for the Sally McDonnell Barksdale Honors College Department of Psychology
University of Mississippi
© Claire M. Lundy 2019
All Rights Reserved
I would like to thank my thesis advisor and mentor, Dr. Karen Kate Kellum, for her patience, insight, and dedication to this project. I have learned immensely both inside and outside of Dr. Kellum’s classroom the last two years. I would also like to thank my thesis committee, Dr. Rebekah Smith and Dr. Jennifer Parsons for their insight, edits, and questions about my project. In addition to my committee, I would like to thank Yash Bhambhani for his immense amount of help; this project would not have been possible without his help. Additionally, I would like to thank Claire Price for running participants daily for an entire semester. I would like to thank my family, Mama, Deddy, Grandma Joyce, Grandpa Curtis, and Grandma Okra, for their constant support and love throughout this process. I am beyond appreciative of my boyfriend, Cain, for constantly listening to me reading my thesis out loud, critiquing my presentation practices, and encouraging me throughout the entire process. Finally, I would like to thank my special friends, Vicky, Kevin, Kenny, Joe, Tommy, Michele, Michael, and those who have passed, for being the inspiration behind this project. They have taught me the most important life lesson- loving everyone equally despite differences among humanity.
The purpose of this study was to investigate the presence of stigma when responding to people with apparent, visible, intellectual disabilities as compared to individuals with concealable, invisible, intellectual disabilities. Additionally, we aimed to discover if people with higher psychological flexibility would show less bias or stigma towards individuals with unconcealable intellectual disabilities. This study presented 63 participants with four self-report surveys: the Attitudes Towards Disabled Persons survey (ATDP), the Multidimensional Psychological Flexibility Inventory (MPFI), Marlowe- Crowne Social Desirability Scale (MCSD), and a demographic survey. Vignettes were added to the self-report survey to give participants further exposure to individuals with disabilities. We also asked participants to complete the Implicit Relational Assessment Procedure (IRAP), which measures the accuracy and responding time of the association between images and target words. Generally, on the IRAP participants had an easier time saying that every individual was good and a harder time saying that any individual was bad. We found statistical significance between the ATDP and the Apparent- Positive Trial Type of the IRAP; Flexibility and Inflexibility; and Trial Types 1 and 2.
Abstract ... iv
List of Figures ... vi
List of Abbreviations ... vii
Introduction ... 1
The Pilot Study ... 7
Present Study ... 17
References ... 35
Figures... 40
Appendix A - Stimuli ... 56
Appendix B - The Marlowe-Crowne Social Desirability Scale (MCSDS) ... 57
Appendix C- The Multidimensional Psychological Flexibility Scale ... 61
Appendix D – The Attitudes Towards The Disabled Persons Scale ... 65
Appendix E – Demographic Questionnaire ... 69
Appendix F – Apparent Vignette 1 ... 71
Appendix G – Apparent Vignette 2 ... 72
Appendix H – Concealable Vignette 1 ... 73
Appendix I – Concealable Vignette 2 ... 74
Appendix J- Consent to Participate in an Experimental Study ... 75
Appendix K – Debriefing ... 77
Figure 2. Data from the IRAP trial types and the ATDP survey graphed on a box plot. . 41
Figure 3. ATDP and Apparent Negative D-Score data graphed on a scatter plot. ... 42
Figure 4. ATDP and Apparent Positive D-Score data graphed on a scatter plot. ... 42
Figure 5. ATDP and Concealable Negative D-Score data graphed on a scatter plot. ... 43
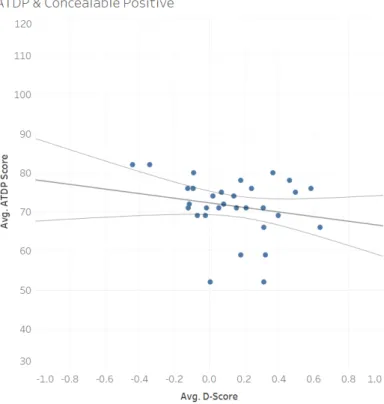
Figure 6. ATDP and Concealable Positive D-Score data graphed on a scatter plot. ... 43
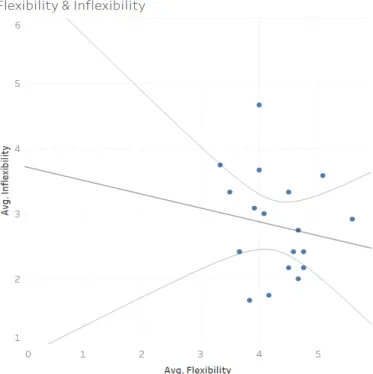
Figure 7. Flexibility and Inflexibility data graphed on a scatter plot. ... 44
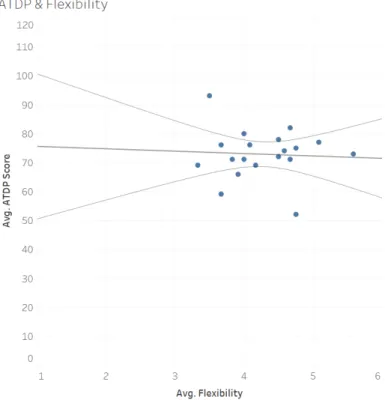
Figure 8. ATDP and Flexibility data graphed on a scatter plot. ... 45
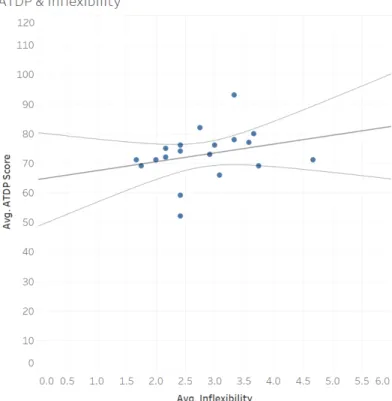
Figure 9. ATDP and Inflexibility data graphed on a scatter plot. ... 45
Figure 10. Average ATDP and MPFI scores. ... 46
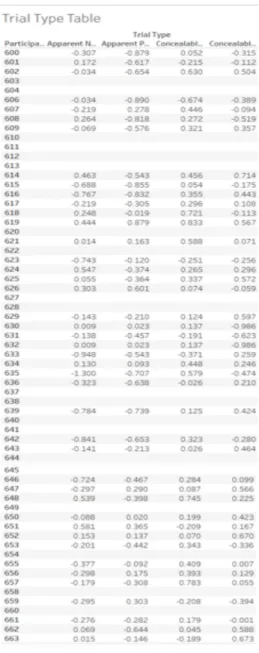
Figure 11. Trial Type Table. ... 47
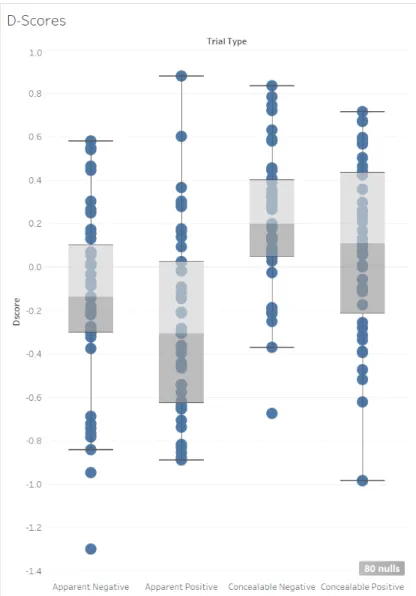
Figure 12. Trial Type D-scores graphed on box plots. ... 48
Figure 13. Trial Type D-scores by ATDP data graphed on box plots. ... 49
Figure 14. Trial Type 2 by ATDP data graphed on a scatter plot. ... 50
Figure 15. Trial Type 1 by ATDP data graphed on a scatter plot. ... 51
Figure 16. D-scores by Family with ID data graphed on box plots. ... 51
Figure 17. D-scores by Friends with ID data graphed on box plots. ... 52
Figure 18. D-scores by Interaction with ID data graphed on box plots. ... 53
Figure 19. D-scores by Flexibility data graphed on box plots. ... 54
Figure 20. D-scores by Inflexibility data graphed on box plots. ... 55
Figure 21. Flexibility and Inflexibility data graphed on a scatter plot. ... 56
ATDP Attitudes Towards Disables Persons (Scale) ID Intellectual Disability
IRAP Implicit Relational Assessment Procedure MCSD Marlowe-Crowne Social Desirability (Scale) MPFI Multiterminal Psychological Flexibility Inventory
Introduction
Society struggles to accept behavior, appearances, and differences that do not fit neatly into the categories created by social norms (Gelfand, Harrington, & Jackson, 2017). Individuals often have negative opinions about things that fall outside of these norms whether they are ideas, a specific group of people, or simply a few characteristics that separate a person from the masses. Society shows their disapproval by mistreating others through exclusion, derogatory remarks, or physical mistreatment (Lalvani, 2015).
One of the most easily identified characteristics of an individual is their race. Skin color is visibly apparent at first glance and frequently stereotyped by other races and groups.
This is one of the most common examples of mistreatment due to differences amongst humankind (Harrison & Thomas, 2009). Just as race is a visible characteristic of a person, people with apparent disabilities can also face mistreatment due to their differences.
Individuals with Disabilities
Individuals with disabilities often face maltreatment by society in the forms of discrimination and prejudice as many look different from people who do not have intellectual disabilities (Abbott & McConkey, 2006; Cooney, Jahoda, Gumley, & Knott, 2006). People with physical disabilities, such as paraplegia, also face discrimination for the differences in their physical appearance (Crocker, 1996). These individuals with physical and intellectual disabilities are often ridiculed, stereotyped, and discriminated
against as a result of negatives qualities that have been attributed to them (Dudley, 2000).
Before the 21st century, having a family member with an intellectual disability was considered shameful (Hughes, 2003). As a result, families most often sent the person away to an institution or had them committed to an asylum (Hughes, 2003). By doing so, they were able to avoid the shame of having others know they were related to someone with an intellectual disability (Vann, 2014). In these institutions, patients were often dehumanized (Hughes, 2003). The inhumane treatment of patients with mental or intellectual disabilities included physical, emotional, and verbal abuse from those tasked with caring for them. Some examples of the abuse they underwent include being fed feces, being deprived of nutrients necessary for survival, lobotomies, and
electroconvulsive therapy. These patients were also used in unethical research and many other inhumane practices (Hughes, 2003). The history of discrimination against
individuals with intellectual disabilities has contributed to maintaining stigmatization.
Stigmatizing individuals with disabilities can affect their employment,
relationships, and ability to function in society (Werner, 2015). People with disabilities are less likely to be selected for employment and more likely to be unemployed than the general population that fits into social norms. Almost 70% of individuals with disabilities between the ages of 18-64 are unemployed, as compared to 20% of individuals who do not have any disabilities (Francis, 2004). People with disabilities that are labeled as
“severe” are less likely to obtain a job than those whose disabilities are considered to be
“mild.” The Americans with Disabilities Act of 1992 was enacted to protect the civil rights of these individuals and provide them with equal opportunities (Thompson, 2015).
The Americans with Disabilities Act advocates for people with physical and mental impairments (Thompson, 2015). This act works to ensure that people with disabilities are treated equally in the workforce, provided accommodations as needed, government accessibility, and accessible methods of communication (Thompson, 2015). Ultimately, the purpose of this act is to avoid stigmatization and discrimination of individuals with disabilities within public places such as their place of employment.
Social inclusion is essential for good health; the feeling of acceptance and
belonging is important for strong self-esteem (Machin & Jeffries, 2017). Individuals with intellectual disabilities frequently face social exclusion as a result of the stigmatization of disabilities in multiple contexts (Nicholson & Cooper, 2012). Multiple researchers have found that people with intellectual disabilities have smaller social networks than people without disabilities (Cummins & Lau, 2003; Forrester-Jones et al., 2006). That is, children with intellectual disabilities often only have a few friends, whereas typically developing children frequently have multiple friends. People with intellectual disabilities are more likely to be bullied, mistreated, and excluded in social interactions than
individuals without disabilities (The State of Queensland; Department of Communities, 2016). Social exclusion is often more extreme amongst those with more severe
intellectual disabilities than those with milder intellectual disabilities (Felce & Emerson, 2001).
As individuals with intellectual disabilities are more likely to be unemployed, it is not surprising that many individuals with intellectual disabilities are poor (Nicholson &
Cooper, 2012). Statistics have shown that approximately one third of recipients of supplemental security income (SSI) are intellectually disabled (Francis, 2004). Financial
stability is a significant aspect of life that is needed to properly function in society;
unfortunately, many individuals with intellectual disabilities struggle to maintain financially stability. Clearly, differential treatment of individuals with intellectual disabilities is harmful to them. One of the reasons that researchers suggest that these individuals are differentially treated is because of the visibility of their disability (Ahmedani, 2011). Individuals with disabilities often have low self-esteem, feelings of vulnerability, low self-worth and avoid socializing (Johnson, 1995; Hughes & Baker, 1990). In their sample, Barnes, Lawlor, Smeets, and Roche (1996) found that children with mild mental handicaps produced lower equivalency responses of self-concept than children without mild mental handicaps.
Visibility of Disability
The visibility of a disability is characterized by the features of an individual with an intellectual disability that can be easily seen at a first superficial glance without any interaction. Physical differences, such as almond shaped eyes in individuals with Down Syndrome, can be noticed by others at a first glance (Bull & Committee on Genetics, 2011). Individuals with Down Syndrome have small heads, small ears, small eyes, short necks, excess skin on the neck, decreased muscle tone, flattened faces, upward slanting eyes, short fingers, and skin folds on the upper eyelids (Bull & Committee on Genetics, 2011). For the purposes of this paper, we will consider such differences to be apparent disabilities.
Typically, apparent disabilities are characterized by craniofacial characteristics and abnormalities. Individuals with intellectual disabilities such as Apraxia or autism cannot be easily noticed by others at a first glance. For the purposes of this paper, we will
consider intellectual disabilities that do not have physical characteristics to be concealed disabilities. The level of concealability of an intellectual disability may correlate to the ability to control or hide symptoms of the disorder (Crocker, 1996).
Psychological Flexibility
Researchers have suggested other variables in addition to visibility that might affect individuals’ behavior towards people with intellectual disabilities, like
psychological flexibility (Noone & Hastings, 2009). Psychological flexibility has been linked with stigmas and mental health (Masuda, Price, Anderson, Schmertz, &
Calamaras, 2009). Psychological flexibility is defined as the willingness of individuals to engage in behaviors they value regardless of inner experiences such as negative thoughts or emotions (Levin, Luoma, Lillis, Hayes, & Vilardaga, 2014). It has been broadly linked to stigmas, not only as a way of possibly explaining why they occur, but also as a possible treatment to reduce stigmas in the general population (Masuda et al., 2009).
Psychological flexibility implies that people can behave appropriately and without discrimination even when they have a negative stereotype or attitude towards a certain group of people, such as those with Intellectual Disabilities (Rolffs, Rogge, & Wilson, 2018). Therefore, a person may infer that individuals that rank higher on the
psychological flexibility scale may show less discrimination against a person with an Intellectual Disabilities despite their personal beliefs.
Self-Report Measures
It is common for research studies to only utilize self-report surveys due to the low cost, accessibility, timeliness, and ease of this measure (Lance & Vandenberg, 2009).
However, there are many problems associated with relying solely on self-report measures
(Hoskin, 2012). One of the most common problems associated with self-report measures is social desirability bias. Social desirability scales can be added to surveys to combat for socially desirable responses. Participants may lack the introspective ability when
answering self-report surveys (Hoskin, 2012). This is due to the disconnect between who we are and who we think we are. It is common for participants to not understand
questions or misinterpret self-report surveys (Hoskin, 2012). As a result, misinterpreted questions could yield incorrect responses. To account for the problems associated with self-report measures, implicit measures, such as the Implicit Relational Assessment Procedure, can be added to combat these problems. Implicit measures, which are less susceptible to social desirability, may provide information about strong patterns of verbal behavior (Gawronski, LeBel, & Peters, 2007).
Purpose
Very little research has been conducted to understand if people respond differently to individuals with a concealed disability differently than an unconcealed disability. The purpose of this study was to understand if there is a correlation between the stigmatization of an intellectual disability and the level of concealability, and if people’s attitudes towards individuals with intellectual disabilities change as a function of the visibility of their disability. This study also investigated whether people who are more psychologically flexible (i.e. able to engage in value-driven behavior despite stigmatizing thoughts and emotions) would show lower discriminatory attitudes and behaviors towards individuals with unconcealed intellectual disabilities.
The Pilot Study
The pilot study was completed in fulfillment of the Ronald E. McNair Post Baccalaureate Scholars Program.
Methods
IRB Approval. The University of Mississippi Institutional Review Board approved all procedures.
Participants. We recruited participants from the Ronald E. McNair Program, summer Psychology classes, and through convenience sampling. Data was gathered from 19 students, which included 6 males and 13 females classified as Sophomores, Juniors, Seniors, Graduate Students, or Other. The age of participants ranged from 18 to 26, and the average age of the participants was 21. Our participants included 11 Caucasian students, 6 African American students, and 2 Asian students.
Procedure. Participants read an electronic informed consent form. Once participants finished reading the informed consent, they confirmed that they were 18 years or older to participate in the study. Participants then completed two self-report surveys online on Qualtrics (Attitudes Towards Disabled People, ATDP;
Multidimensional Psychological Flexibility Inventory, MPFI) in addition to demographic information, and then complete an IRAP (Implicit Relational Assessment Procedure).
Attitudes Towards Disabled Persons Scale – Form O (ATDP-O). We
measured participants perception of people with disabilities using the Attitudes Towards Disabled Persons Scale (ATDP) – Form O (Yuker, Block, & Young, 1970). The ATDP -
Form O is a 20-item scale that asks participants how different people with
disabilities are from people without disabilities. Participants rate the extent to which they agree with each statement on a 6-point Likert scale ranging from “I disagree very much”
to “I agree very much”. The ATDP has been shown to have good reliability and validity.
The Multidimensional Psychological Flexibility Inventory (MPFI). The Multidimensional Psychological Flexibility Inventory (Rolffs et al., 2018) was used to measure participants psychological flexibility and inflexibility. The MPFI is a 60-item scale, a shorter 24-item scale was used for this study. Participants rated the extent to which they agreed with each statement, such as “I am attentive and aware of my
emotions,” on a 6-point Likert scale ranging from “Never True” to “Always True”. The MPFI, both the long and short version, have been shown to have good reliability and validity (Rolffs et al., 2018).
Demographic Survey. The demographic survey inquired about the participants age, gender, grade classification, ethnicity, religious belief, Greek affiliation, relationship status, and history of interactions with individuals with intellectual disabilities. We selected the items in this survey to ask general demographic questions.
Implicit Relational Assessment Procedure (IRAP) - Go-IRAP. Following the completion of the online surveys, participants were asked to complete a computer task, the Go-IRAP Program (Hussey, Thompson, McEnteggart, Barnes-Holmes, & Barnes- Holmes, 2015). The purpose of the IRAP is to determine whether particular patterns of verbal behavior are stronger than others. The program measures the accuracy and speed of responses to rapidly changing rules. This study used two sets of target words that
would be related to images of individuals with visible and invisible disabilities (see Appendix A for all stimuli).
At the beginning of each block, an instruction was presented to the participant.
Rule A stated that participants should respond as if individuals with apparent or unconcealed disabilities have less desirable qualities than those without apparent
disabilities. Rule B stated that participants should respond as if individuals with apparent disabilities have more desirable qualities than those without apparent disabilities. Each instruction was presented during every other block. This study had four different trial types:
Type 1, Apparent Negative: People with apparent disabilities are less desirable Type 2, Apparent Positive: People with apparent disabilities are more desirable Type 3, Concealable Negative: People without apparent disabilities are less desirable
Type 4, Concealable Positive: People without apparent disabilities are more desirable.
Before the task-initiated test blocks, participants had to meet the practice block criteria of 80% accuracy and 2000 milliseconds twice on each of the trial types. After participants met criteria, they began the 6 test blocks. After participants finished the test blocks, the program notified the participant that they had finished the computer task and that they should alert the researcher. After the participants completed the study, they were informed about the purpose of the study and provided information about the University of Mississippi Counseling center. Participants who signed up though the University of Mississippi SONA Systems were granted credit after they completed the study.
Scoring and Data Analyses. The ATDP-O scores can range from 0 (meaning the participant responded as if people with and without disabilities were very similar) to 120 (meaning the participant responded as people with and without disabilities were very different) (Yuker & Block, 1986). The MPFI has two subscales, Flexibility and
Inflexibility, that range from 1 (low) to 6 (high) (Rolffs et al., 2018). The IRAP produces mean D-scores for each participant for each trial type. These scores are a normalized difference score between responding to the stimuli when rule A was in operation and when rule B was in operation. Negative scores indicate that the participant responded to rule A more quickly and accurately than rule B. Positive scores indicate that the
participant responded to rule B more quickly and accurately than rule A (Hussey et al., 2015).
After data collection, we organized data from Qualtrics and the IRAP in a Microsoft Excel workbook where it would be scored. Using the scoring templates for each self-report measure, we scored and simplified the data into one column per measure.
Information was then entered into the statistical software, R, where we transformed the data layout. After we organized and made the data easily accessible, we entered these into Tableau. Using Tableau, we developed two types of visualizations. We used the box and whisker plot to graph the IRAP D-scores and scatter plots to graph potential correlations between two variables. While we ran test of significances for the correlation between the variables, these should be interpreted with caution as our sample was very small.
Results
Self-Report Measures. Participants in this study had a mean score of 72.84 on the ATDP-0 (range= 52 to 93). The mean flexibility score on the MPFI was 4.27 (range=
3.33 to 5.58). The mean inflexibility score on the MPFI was 2.81 (range= 1.66 to 4.66).
IRAP. Sixteen out of the 19 participants had useable IRAP data (i.e., three of the participants failed to respond accurately and quickly enough for inclusion). Using the data collected from the IRAP, we created a box plot on Tableau to graph the data (see Figure 1).
_______________________
Insert Figure 1 about here _______________________
The mean IRAP D-score for Trial Type 1 (Apparent - Negative) for our participants was -0.35 (range -0.88 to 0.15). Thirteen of the participants had negative scores. These participants had an easier time responding “false” than “true” (i.e., saying that individuals with apparent disabilities were not negative). However, the 3 participants with positive D-scores in trial type one had an easier time responding “true” than “false”
(i.e., as if people with apparent disabilities were negative). One of the three with positive D-Scores, had a score very near zero (i.e., responded equally well to both rules).
The mean IRAP D-score for Trial Type 2 (Apparent - Positive) for our participants was -0.18 (range -0.90 to 0.72). Eleven of the participants had negative scores. These participants had an easier time responding “true” than “false” (i.e., saying that individuals with apparent disabilities were positive). However, the 5 participants
with positive D-scores in trial type two had an easier time responding “false” than “true”
(i.e., as if people with apparent disabilities were not positive).
The mean IRAP D-score for Trial Type 3 (Concealable - Negative) for our
participants was 0.197 (range -0.34 to 1.13). Five of the participants had negative scores.
These participants had an easier time responding “true” than “false” (i.e., saying that individuals with concealable disabilities were negative). However, the 11 participants with positive D-scores in trial type three had an easier time responding “false” than “true”
(i.e., as if people with concealable disabilities were not negative).
The mean IRAP D-score for Trial Type 4 (Concealable - Positive) for our participants was 0.13 (range -0.44 to 0.64). Five of the participants had negative scores.
These participants had an easier time responding “false” than “true” (i.e., saying that individuals with concealable disabilities were not positive). However, the 11 participants with positive D-scores in trial type four had an easier time responding “true” than “false”
(i.e., as if people with concealable disabilities were positive).
In summary, the mean d-score and majority of individual participants’ D-scores indicate most participants responded more rapidly and accurately when required to respond true to people in the photographs and positive words than when required to respond false. That is, our participants generally responded as if all of the photographed individuals with disabilities were positive. The mean d-score and majority of individual participants’ D-scores indicate most participants responded more rapidly and accurately when required to respond false to people in the photographs and negative words than when required to respond true. That is, our participants generally responded as if all of the photographed individuals with disabilities were not negative.
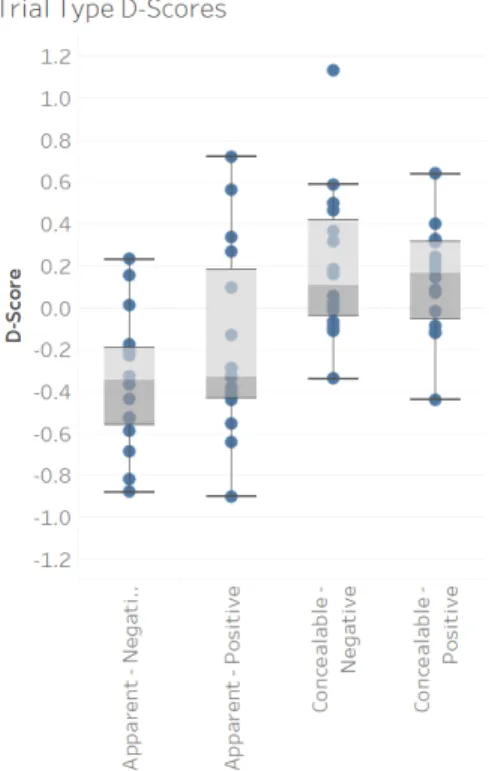
IRAP and Self-Report. When comparing the trial type D-scores from the IRAP to the scores from the Attitudes Towards Disabled persons scale, we plotted the data on a box plot. Considering that each dot represents a person, the dots vary in color depending upon the participants scores from the ATDP. Darker colors indicate that participants reported on the self-report survey that individuals with disabilities were different from individuals without disabilities. Lighter color such as yellow indicate that participants reported on the self-report survey that individuals with disabilities were not different from individuals without disabilities. In the first trial type, the apparent negative trial type, the participants with lighter dots had negative D-scores. This means that they reported on the self-report survey that people with disabilities were not different from people without disabilities and that people with apparent disabilities were not negative. In trial type two, the participants with lower ATDP scores also had negative scores, which indicates that they reported on the self-report survey that that people with disabilities were not different from people without disabilities and that people with apparent disabilities were positive. However, in the third and fourth trial types the ATDP scores were mixed on the box plot (see Figure 2).
_________________________
Insert Figure 2 about here _________________________
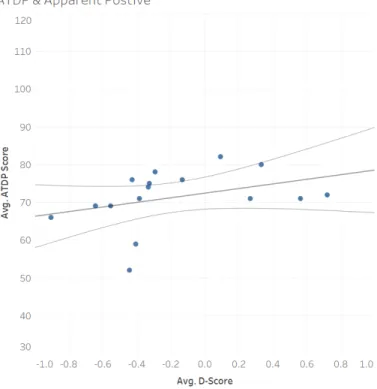
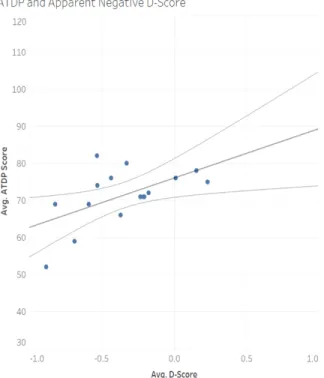
Next, we examined the correlation between the ATDP and each individual trial type. In the first trial type, apparent negative, we found that there is a slight statistically significant relationship between this trial type and the ATDP (Figure 3). In this
relationship, we found an r2 of 0.32 (p = 0.02). In trial type 2 , apparent positive, we found
an r2 of 0.13 (p = 0.16). That is, the apparent negative trial type is slightly statistically significant, and the apparent positive trial type is not statistically significant (Figure 4).
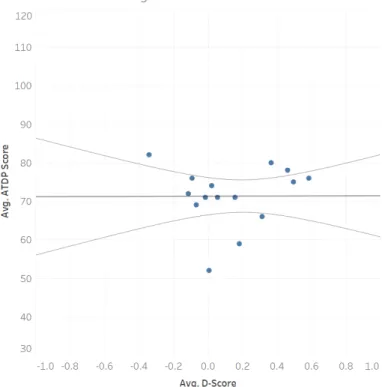
The correlation between the ATDP and performance on Trial Type 3, was also not statistically significant (p = 0.98) (Figure 5). However, trial type 4, concealable positive, and ATDP was statistically significant (p = 0.01) (Figure 6).
_________________________
Insert Figure 3 about here _________________________
_________________________
Insert Figure 4 about here _________________________
_________________________
Insert Figure 5 about here _________________________
_________________________
Insert Figure 6 about here _________________________
Self-Report Measures. When comparing the self-report measure, such as flexibility and inflexibility, we did not find a relationship or statistical significance (Figure 7). This insignificant relationship had an r2 of 0.03 (p = 0.51). Additionally, we did not find a relationship between the ATDP and flexibility (r2 = 0.003, p = 0.82) nor inflexibility (r2 = 0.07, p = 0.26) (Figures 8 and 9).
_________________________
Insert Figure 7 about here _________________________
_________________________
Insert Figure 8 about here _________________________
_________________________
Insert Figure 9 about here ________________________
Discussion
The purpose of this study was to examine if people show different attitudes and behaviors towards people with intellectual disabilities based on the concealability of the disability. Additionally, we aimed to examine if participants with higher psychological flexibility showed less bias towards people with unconcealable intellectual disabilities than people with concealable disabilities. The results of the study should be interpreted with caution due to the small sample size. Using the IRAP, we found that participants had an easier time saying positive things about everyone and a harder time saying negative things about anyone despite their ability. Additionally, a slightly significant relationship was found between the Attitudes Towards Disabled Persons Scale and the Apparent – Negative trial type of the IRAP. This relationship shows that participants who feel that individuals with disabilities are not different from people without disabilities also believe that people with apparent disabilities are not negative. However, the relationships
between the remaining trial types were found to be statistically insignificant.
Limitations. Due to the small sample used in this study, the data collected in this study was not statistically significant. The participants did not complete the study in the same location; this inconsistency in environment could have affected the participants’
responses. We found that social desirability could have been a limitation of this study, as the researcher was present in the room when the participants completed the study. In addition, participants can easily respond in a socially desirable manner on self-report surveys. This study only looked at the first glance, or superficial, view of individuals with intellectual disabilities. Participants did not get to see the behavior of individuals with intellectual disabilities, and we can make limited generalizations about how people would actually behave in a longer duration interaction with individuals with intellectual
disabilities.
Present Study Introduction
Considering that stigmatization can affect the daily life and well-being of individuals with Intellectual Disabilities, it is important to understand that there is a stigma towards individuals with ID and why populations associate stigmas to people with diagnoses. While there have been multiple studies testing how stigmas affect behavior, there are still some areas that have not been as deeply researched. This study employed the Marlowe – Crowne Social Desirability scale to account for socially desirable responses in the self-report surveys. Vignettes were added to help participants identify the level of concealability of the disabilities utilized in the IRAP. Through the use of the Multidimensional Psychological Flexibility Scale, the Marlowe – Crowne Social
Desirability Scale, the Attitudes Towards Disabled Persons Scale, and the Implicit Relational Assessment Procedure, we aim to investigate whether people who are more psychologically flexible (able to engage in value-driven behavior despite discriminatory thoughts and behaviors) would show lower stigmatizing attitudes towards people with apparent or concealed Intellectual Disabilities. We hypothesize that people with lower psychological flexibility are more likely to respond in a socially desirable manner on the self-report surveys and show higher stigmatizing attitudes towards people with apparent Intellectual Disabilities.
Considering that the small sample size of the pilot study yielded insignificant results, we aimed to recruit a larger sample size for the present study. The pilot study
consisted of 19 participants, while the present study had 63 participants. The pilot study showed a correlation between ATDP and Trial Type 1 (Apparent- Negative), while the other variables were statistically insignificant.
Social Desirability Bias, or response bias, can occur in surveys and questionnaires due to the inclination to give socially desirable answers (Beretvas, Meyers, & Leite, 2002). We suspected that response bias could have affected the participants responses in the pilot study, as the researcher was present in the room during the completion of the survey. To combat this, we utilized the Marlowe and Crowne social desirability scale to gauge the validity of the participants responses. Marlowe and Crowne associated responding in a socially desirable way to cultural sanctions. Later, they modified the attribution of social desirability by concluding that participants need social approval. The Marlowe-Crowne Social Desirability Scale utilizes a 33-question true or false survey to allow researchers to understand if participants are responding in a socially desirable manner (Beretvas et al., 2002).
The location of the pilot study was inconsistent, as participants completed the survey and behavioral tasks in the classroom, the honors college, and the Peabody psychology lounge. Considering that the inconsistency in location could have affected participants responses, we aimed to have a central designated area for all participants to complete this study.
Methods
IRB Approval. The University of Mississippi Institutional Review Board approved all procedures.
Participants. We recruited participants from the University of Mississippi’s Psychology Department’s participant management system, SONA Systems. Data was collected from 63 students, which included 20 males and 43 females classified as
freshmen, sophomores, juniors, and seniors. The participants ages ranged from 18 to 21, with an average age of 18.6. The participants included 51 Caucasian participants – 3 of which were of Hispanic or Latino descent, 8 African American participants, 2 Asian participants, and 2 Native Hawaiian or Pacific participants.
Procedure. Participants were asked to verify their name before beginning the study to provide appropriate credit for participation. Next, the participants read an electronic consent form, which asked participants to indicate their age and verify that they were 18 years or older. Participants then completed three self-report surveys, which included the Marlowe- Crowne Social Desirability scale (MCSD), the Multidimensional Psychological Flexibility scale (MPFI), and the Attitudes Towards Disabled Persons scale (ATDP). In addition to the self- report surveys, participants also completed four sets of question related to the vignettes in the survey, as well as demographic information.
Due to an error in updating the Qualtrics link, 15 participants received the link for the survey used in the pilot study. Therefore, they did not receive the updated survey that included the vignettes and the MCSD. After participants completed the survey, they alerted the researcher to begin the next portion of the study. Next, participants completed an Implicit Relational Assessment Procedure (IRAP). Once participants completed the IRAP they alerted the researcher and received a half SONA credit upon departure.
The Marlowe-Crowne Social Desirability Scale. The Marlowe-Crowne Social Desirability Scale is a 33-item true or false scale (Crowne & Marlowe, 1960).
Participants responded with true or false to rate the extent to which they agree with each statement, such as “I have almost never felt the urge to tell someone off” (Barger, S. D., 2002). This scale measures a participant’s likelihood of responding in a socially desirable way over how they truly feel about a topic. We utilized the Marlowe-Crowne Scale to determine the accuracy and validity of participants’ responses.
The Multidimensional Psychological Flexibility Inventory. The
Multidimensional Psychological Flexibility Inventory (MPFI) was used to measure participants psychological flexibility and inflexibility (Rolffs et al., 2018). We used the shortened 24-item version of the 60-item scale. Participants responded with the rate that they agree with each statement, such as “I opened myself to all of my feelings,” on a 6- point Likert scale ranging from “Never True” to “Always True” (Rolffs et al., 2018).
Attitudes Towards Disabled Persons Scale – Form O. We utilized the Attitudes Towards Disabled Persons Scale (ATDP) – Form O to measure the participants
perception of people with disabilities (Yuker et al., 1970). This self-report survey is a 20- item scale that measures how differently participants perceive people with disabilities and people without disabilities. Participants rated the extent to which they agree with each statement on a 6-point Likert scale ranging from “I disagree very much” to “I agree very much”.
Vignettes. We utilized Vignettes, brief descriptions, to give participants
information about the individuals with disabilities that will be pictured on the IRAP (see Appendices F, G, H, and I). The Vignettes list the individuals name, age, school
classification, disorder, and the ease of noticing the individual’s disability. After reading
the Vignette, participants were asked questions about the information listed. This information will be used to help the participants respond on the IRAP.
Demographic Survey. The demographic survey inquired about the participants age, gender, grade classification, ethnicity, religious belief, Greek affiliation, relationship status, and history of interactions with individuals with intellectual disabilities. We selected the items in this survey to ask general demographic questions.
Implicit Relational Assessment Procedure (IRAP) - Go-IRAP. This study used two sets of target words that are related to Intellectual Disabilities (Hussey et al., 2015).
At the beginning of each block, an instruction was presented to the participant. Rule A stated that participants should respond as if people with Intellectual Disabilities have less desirable qualities than people without Intellectual Disabilities. Rule B stated that
participants should respond as if people with Intellectual Disabilities have more desirable qualities than people without Intellectual Disabilities. Each instruction was presented during every other block. The labels included an apparent subset, which consisted of two photos of children with apparent disabilities. Additionally, the labels also included a concealed subset, which consisted of two photos of children with concealed disabilities.
The target words consisted of positive terms such as good, friend, kind capable, beautiful, and intelligent and negative terms such as bad, enemy, unkind, incapable, grotesque and unintelligent. This study has four different trial types:
Type 1, Apparent- Negative: People with Apparent Disabilities are less desirable Type 2, Apparent- Positive: People with Apparent Disabilities are more desirable Type 3, Concealable- Negative: People with Concealed Disabilities are less desirable
Type 4, Concealable - Positive: People with Concealed Disabilities are more desirable.
Before beginning the task-initiated test blocks, participants had to meet the practice block criteria of 80% accuracy and 2000 milliseconds twice on each of the trial types. After participants met criteria, they began the 6 test blocks. After participants finished the test blocks, the program notified them that they finished the computer task and that they should alert the researcher. After the participants completed the study, they were informed about the purpose of the study and provided information about the
University of Mississippi Counseling center. Participants who signed up though the University of Mississippi SONA Systems were granted 0.5 credit after they completed the study.
Scoring and Data Analyses. The Marlowe-Crowne Social Desirability scale condenses the participants responses into a score of 0 to 13. A score of 0 indicates that the participant is least likely to give socially desirable responses, while a score of 13 indicates that the participant is most likely to give socially desirable responses (Barger, S.
D., 2002). The ATDP-O scores can range from 0 (meaning the participant responded as if people with and without disabilities were very similar) to 120 (meaning the participant responded as people with and without disabilities were very different) (Yuker & Block, 1986). The MPFI is rated on a scale of 1 (low) to 6 (high) and has two subscales, Flexibility and Inflexibility (Rolffs et al., 2018). The IRAP gives a mean D-scores for each participant for each trial. The D-scores are a normalized difference score between how the participant responded to the stimuli when following rule A versus when following rule B. If the participant responds faster and more accurately for rule A than
rule B the score is negative. In contrast, if the person responded faster and more accurately when following rule B the d-score is positive. (Hussey et al., 2015).
After data collection, Microsoft Excel was utilized to organize and score the Qualtrics and IRAP data. Using the scoring templates for each self-report measure, we scored and simplified the data into one column per measure.
Results
Self-Report Measures. Participants in this study had a mean score of 35.86 on the ATDP-0 (range= 8 to 61), which ranges from 0 to 120. Lower scores indicate that participants feel that people with and without disabilities are very similar, while higher scores indicate that participants feel that people with and without disabilities are
different. The MCDS has a range of 0 to 13. A score of 0 indicates that the participant is least likely to give socially desirable responses, while a score of 13 indicates that the participant is most likely to give socially desirable responses (Barger, S. D., 2002). The mean flexibility score on the MPFI was 3.85 (range= 2 to 5.33), while the mean
inflexibility score on the MPFI was 2.82 (range= 1.5 to 4.5). The MPFI has a range of 1 (low) to 6 (high) (Figure 10). (add brief descriptions of each measure)
_________________________
Insert Figure 10 about here ________________________
Demographic Survey. In this study 23 participants had (a/an) family member(s) with intellectual disabilities, while 40 participants did not have family members with ID.
Additionally, 41 participants had friends with ID while the remaining 22 participants did not have friends with ID. Forty-seven participants have had an interaction with a person
with an intellectual disability while the remaining 16 have not had an interaction with a person with an intellectual disability.
Vignettes. Thirteen participants missed 1 or more questions in the vignettes section, while the remaining 35 participants answered all vignettes questions correctly.
Seven participants incorrectly answered 1 vignette question. Four participants incorrectly answered 2 vignettes questions. One participant incorrectly answered 3 vignettes
questions. One participant incorrectly answered four vignettes questions. Six participants who missed one or more vignettes question also failed to respond accurately and quickly enough on the IRAP. Three participants who did not receive the updated survey with the vignettes questions failed to respond accurately and quickly enough on the IRAP.
IRAP. Forty-three out of the 63 participants had useable IRAP data. That is 20 of the participants failed to respond accurately (at least 80%) and/or quickly enough
(average of less than 2000ms) to calculate D-scores.
The mean IRAP D-score for Trial Type 1 (Apparent - Negative) for our
participants was -0.15 (range -1.3 to 0.58). Twenty-six of the participants had negative scores. These participants had an easier time responding “false” than “true” (i.e., saying that individuals with apparent disabilities were not negative). However, the 17
participants with positive D-scores in trial type one had an easier time responding “true”
than “false” (i.e., as if people with apparent disabilities were negative).
The mean IRAP D-score for Trial Type 2 (Apparent - Positive) for our
participants was -0.27 (range -0.89 to 0.88). Thirty of the participants had negative D- scores. These participants had an easier time responding “true” than “false” (i.e., saying that individuals with apparent disabilities were positive). However, the 13 participants
with positive D-scores in trial type two had an easier time responding “false” than “true”
(i.e., as if people with apparent disabilities were not positive).
The mean IRAP D-score for Trial Type 3 (Concealable - Negative) for our
participants was 0.197 (range -0.67 to 0.83). Nine of the participants had negative scores.
These participants had an easier time responding “true” than “false” (i.e., saying that individuals with concealable disabilities were negative). However, the 34 participants with positive D-scores in trial type three had an easier time responding “false” than “true”
(i.e., as if people with concealable disabilities were not negative).
The mean IRAP D-score for Trial Type 4 (Concealable - Positive) for our participants was 0.08 (range -0.99 to 0.71). 17 of the participants had negative scores.
These participants had an easier time responding “false” than “true” (i.e., saying that individuals with concealable disabilities were not positive). However, the 26 participants with positive D-scores in trial type four had an easier time responding “true” than “false”
(i.e., as if people with concealable disabilities were positive).
We found statistical significance between Trial Type 1 (Apparent – Negative) and Trial Type 2 (Apparent – Positive). This relationship had an r of 0.10 (p = .389).
The mean D-score and the majority of individual participants’ D-scores indicate most participants responded more rapidly and accurately when required to respond true to people in the photographs with positive words than when required to respond false.
However, less than half of the participants had an easier time responding more rapidly and accurately when required to respond true to people in the photographs with negative words and false to people in the photographs with positive words. Over half of our participants generally responded as if all of the photographed individuals with disabilities
were positive. The mean D-score and majority of individual participants’ D-scores indicate most participants responded more rapidly and accurately when required to respond false to people in the photographs with negative words than when required to respond true. Therefore, our participants generally responded as if all of the individuals with disabilities were not negative (Figures 11 and 12).
_________________________
Insert Figure 11 about here ________________________
_________________________
Insert Figure 12 about here ________________________
IRAP and Self-Report. When comparing the trial type D-scores from the IRAP to the scores from the Attitudes Towards Disabled persons scale, we plotted the data on a box plot. Considering that each dot represents at least one person, the dots vary in color depending upon the participants scores from the ATDP. Darker colors indicate that participants responded on the self-report survey as if individuals with apparent
disabilities were different from individuals without apparent disabilities. Lighter colors such as white indicate that participants reported that individuals with apparent disabilities were not different from individuals without apparent disabilities.
In the first trial type, the apparent negative trial type, the participants with lighter dots had lower ATDP scores and negative D-scores. This means that the participants reported on the self-report survey that people with apparent disabilities were not different
from people without apparent disabilities. The participants reported on the behavioral task that people with apparent disabilities were not negative. The participants with darker dots had higher ATDP scores and positive D-scores, which means that the participants reported on the self-report survey that individuals with apparent disabilities were different from people without apparent disabilities. The participants reported on the behavioral task that people with apparent disabilities are negative.
In trial type two, apparent positive, the participants with lower ATDP scores also had positive D-scores, which indicates that the participants reported on the self-report survey that that people with apparent disabilities were not different from people without apparent disabilities. The participants reported on the behavioral task that people with apparent disabilities were positive. Participants with darker dots had higher ATDP scores and negative D-scores, which indicates that the participants reported on the self-report survey that people with apparent disabilities were different from people without apparent disabilities. The participants reported on the behavioral task that people with apparent disabilities are not positive.
In the third trial type, concealable negative, the participants with lighter dots had lower ATDP scores and positive D-scores, which means that the participants reported on the self-report survey that people with concealed disabilities were not different from people without concealed disabilities. The participants reported on the behavioral task that people with concealed disabilities were negative. Participants with darker dots had higher ATDP scores and negative D-scores. This means that the participants reported on the self-report survey that people with concealed disabilities were different from people
without concealed disabilities. The participants reported on the behavioral task that people with concealed disabilities are not negative.
The fourth trial type, concealable positive, the participants with lighter dots had lower ATDP scores and negative D-scores, which indicates that the participants reported on the self-report survey that people with concealed disabilities were not different from people without concealed disabilities. The participants reported on the behavioral task that people with concealed disabilities were not positive. However, participants with darker dots had higher ATDP scores and positive D-scores. This means that the participants reported on the self-report survey that people with concealed disabilities were different from people without concealed disabilities. The participants reported on the behavioral task that people with concealed disabilities are positive (Figure 13).
_________________________
Insert Figure 13 about here ________________________
We examined the correlation between the ATDP and each individual trial type. In the second trial type, apparent positive, we found that there is a slight statistically
significant relationship between this trial type and the ATDP. In this relationship, we found an r2 of 0.04 (p = -0.16).). In trial type 1, apparent positive, we found an r2 of 0.67 (p
= -0.07). That is, the apparent positive trial type is slightly statistically significant, and the apparent negative trial type is not statistically significant (Figures 14 and 15). The correlations between the ATDP and performance on Trial Types 3 and 4, were also not statistically significant (p = -0.22, and p = -0.15 respectively). Finally, we ran a linear
regression on SPSS that looked at the relationship between the ATDP, IRAP trial types, and the MCSD scale. There was not a relationship between these factors.
_________________________
Insert Figure 14 about here ________________________
_________________________
Insert Figure 15 about here ________________________
When comparing three demographics, family members with ID, friends with ID, and history of interactions with people with ID, to the participants D-scores, we graphed the data on a box plot. Orange dots represent yes and blue dots represent no. These scores are mixed on the box plots (Figures 16, 17, and 18).
_________________________
Insert Figure 16 about here ________________________
_________________________
Insert Figure 17 about here ________________________
_________________________
Insert Figure 18 about here ________________________
We examined the correlation between the D-scores and the participants flexibility and inflexibly by graphing the data on a box plot. Lighter dots indicate inflexibility while
darker dots indicate flexibility. We found that the scores are mixed among flexibility and inflexibility (Figures 19 and 20).
_________________________
Insert Figure 19 about here ________________________
_________________________
Insert Figure 20 about here ________________________
Self-Report Measures. When comparing the self-report measure, such as
flexibility and inflexibility, we found statistical significance (Figure 21). This relationship had an r2 of 0.00 (p =-0.43). Additionally, we did not find a relationship between the ATDP and flexibility (r2 = 0.39, p = 0.11) nor inflexibility (r2 = 0.73, p = 0.05).
_________________________
Insert Figure 21 about here ________________________
General Discussion Summary
The purpose of this study was to examine if people show different attitudes and behaviors towards people with intellectual disabilities based on the concealability of the disability. Additionally, we aimed to examine if participants with higher psychological flexibility showed less bias towards people with unconcealable intellectual disabilities than people with concealable disabilities. However, our results indicate that we did not find a relationship between psychological flexibility, and ATDP or IRAP. Utilizing the IRAP, we found that participants had an easier time saying positive things about
everyone and a harder time saying negative things about anyone regardless of the visibility of the disability. Additionally, a slightly significant relationship was found between the Attitudes Towards Disabled Persons Scale and the Apparent – Positive trial type of the IRAP. This relationship shows that participants who feel that individuals with disabilities are not different from people without disabilities also believe that people with apparent disabilities are positive. However, the relationships between the remaining trial types were found to be statistically insignificant. In the pilot study, there was a
statistically significant relationship between the Apparent – Negative Trial Type and the ATDP, while the Apparent – Positive Trial Type and the ATDP showed statistical significance in the present study. Although social desirability appeared to be a limitation of the pilot study, the addition of the MCDS to the present study showed no statistical significance.
Implications
This study contributed to the limited, but growing stigma research. Specifically, this study examines concealability of an intellectual disability. The research implications for this study include the possibility of replication, utilizing other stigma scales to
evaluate the presence of stigma, implementing an intervention study, and utilizing a larger sample. The results of this study show that self-report responses from the ATDP and the results of the IRAP do not parallel. This indicates that participants could be responding in a socially desirable manner or that the IRAP is not accurately measuring implicit responses. Therefore, a more accurate measure would be essential in testing for stigma, biases, and discrimination.
Limitations
This study had few statistically significant results, which could be because there was not a relationship between the variables or because our sample size was not large enough. The IRAP scores showed variety in participants responses, and approximately 1/3 of the sample did not meet the IRAP inclusion criteria. This could be a result of the vocabulary that we selected to utilize in the IRAP, as the larger words could make responding more difficult and less immediate. Additionally, this could be because we did not have sufficient training on the IRAP or because the IRAP may not be the best
behavioral measure to utilize in this study. This study only looked at the first glance, or superficial, view of individuals with intellectual disabilities. Participants did not get to see the behavior of individuals with intellectual disabilities, and we can make limited generalizations about how people would actually behave in a longer duration interaction with individuals with intellectual disabilities. The limited age range of participants, which
ranged from 18 to 21, is a limitation of this study, as different age groups or generations could respond differently to this study. Additionally, all of the participants were enrolled in psychology courses, so the participants had been exposed to psychological concepts and ideas during the time of their participation. This, of course, could affect their responding, and we could potentially see a difference in responding in uneducated participants.
Due to an error in updating the Qualtrics link, 15 participants received the link for the survey used in the pilot study. Therefore, the participants did not receive the updated survey that included the vignettes and the MCSD. These participants had a different experience than the other participants, which can affect responding. We expected to find a relationship between the MSCD, self-report measures, and trial types of the IRAP, but we did not have any statistically significant results between these variables. It is possible that the Marlowe-Crowne Social Desirability Scale was incorrectly scored, which could affect the results of this study. The scale has a range of 0-33, and this study had a mean score of 56.04. The mean score is significantly larger than the highest possible score on the MCSD, which indicates that we did score the scale incorrectly.
Future Directions
This study could be replicated by recruiting more participants to increase the sample size.
Considering that participants are only seeing a first glance at individuals with intellectual disabilities, future research could study interactions between participants and individuals with intellectual disabilities in public locations such as the park or the mall. Researchers could extend this study by implementing an intervention study to encourage participants
to behave in less discriminatory ways when the participants are interacting with individuals with intellectual disabilities. The ATDP could be replaced by the Attitudes Towards Persons with Intellectual Disabilities Scale, which is more fitting for the study since the scale focuses specifically on Intellectual Disabilities. Finally, this study could be replicated by utilizing other methods and measures to examine the stigmatization of the concealability of a disability.
References
Abbott, S., & Mcconkey, R. (2006). The barriers to social inclusion as perceived by people with intellectual disabilities. Journal of Intellectual Disabilities, 10(3), 275–287.
Ahmedani, B. K. (2011). Mental Health Stigma: Society, Individuals, and the Profession.
Journal of Social Work Values and Ethics, 8(2), 4-1-4–16.
Barger, S. D. (2002). The Marlowe-Crowne affair: Short forms, psychometric structure, and social desirability. Journal of Personality Assessment, 79(2), 286-305.
Barnes, D., Lawlor, H., Smeets, P. M., & Roche, B. (1996). Stimulus equivalence and academic self-concept among mildly mentally handicapped and nonhandicapped children. The Psychological Record, 46(1), 87-107.
Beretvas, S. N., Meyers, J. L., & Leite, W. L. (2002). A Reliability Generalization Study of the Marlowe-Crowne Social Desirability Scale. Educational and Psychological
Measurement, 62(4), 570–589. https://doi.org/10.1177/0013164402062004003 Bull, M. J., & Committee on Genetics. (2011). Health supervision for children with Down
syndrome. Pediatrics, 128(2), 393–406.
Cooney, G., Jahoda, A., Gumley, A., & Knott, F. (2006). Young people with intellectual disabilities attending mainstream and segregated schooling: perceived stigma, social comparison and future aspirations. Journal of Intellectual Disability Research, 50(6), 432–444.
Crocker, J. (1996). Stigma. In: Antony SR, Hewstone M, editors. The Blackwell Encyclopedia of Social Psychology. Blackwell Publishing.
Crowne, D. P., & Marlowe, D. (1960). A new scale of social desirability independent of psychopathology. Journal of Consulting Psychology, 24(4) 349-354. doi:
10.1037/h0047358.
Cummins, R. A., & Lau, A. L. D. (2003). Community Integration or Community Exposure? A Review and Discussion in Relation to People with an Intellectual Disability. Journal of Applied Research in Intellectual Disabilities, 16(2), 145–157.
https://doi.org/10.1046/j.1468-3148.2003.00157.x
Dudley, J. R. (2000). Confronting Stigma within the Services System. Social Work, 45(5), 449–455.
Felce, D., & Emerson, E. (2001). Overview: Community living. Mental Retardation and Developmental Disabilities Research Reviews, 7(2), 73–74.
https://doi.org/10.1002/mrdd.1010
Forrester Jones, R., Carpenter, J., Coolen Schrijner, P., Cambridge, P., Tate, A., Beecham, J., … Wooff, D. (2006). The Social Networks of People with Intellectual Disability Living in the Community 12 Years after Resettlement from Long Stay Hospitals.
Journal of Applied Research in Intellectual Disabilities, 19: 285-295.
Francis, L. P. (2004). Employment and intellectual disability. J. Gender Race & Just., 8 (2), 299-325.
Gawronski, B., LeBel, E. P., & Peters, K. R. (2007). What Do Implicit Measures Tell Us?:
Scrutinizing the Validity of Three Common Assumptions. Perspectives on Psychological Science, 2(2), 181–193. https://doi.org/10.1111/j.1745-6916.2007.00036.x
Gelfand, M. J., Harrington, J. R., & Jackson, J. C. (2017). The Strength of Social Norms Across Human Groups. Perspectives on Psychological Science, 12(5), 800–809.
Harrison, M. S., & Thomas, K. M. (2009). The Hidden Prejudice in Selection: A Research Investigation on Skin Color Bias. Journal of Applied Social Psychology, 39(1), 134–168.
https://doi.org/10.1111/j.1559-1816.2008.00433.x
Hoskin, R. (2012, March 3). The dangers of self-report – Science Brainwaves. Retrieved April 15, 2019, from Science For All website: https://www.sciencebrainwaves.com/the-
dangers-of-self-report/
Hughes, J. N., & Baker, D. B. (1990). Psychological development: Children’s self-esteem and coping. The clinical child interview (pp. 53-61). New York: Guilford Press
Hughes, W. C. (2003). Review of Mad in America: Bad science, bad medicine, and the enduring mistreatment of the mentally ill. Social Work in Mental Health, 1(3), 93–97.
Hussey, I., Thompson, M., McEnteggart, C., Barnes-Holmes, D., & Barnes-Holmes, Y.
(2015). Interpreting and inverting with less cursing: A guide to interpreting IRAP data.
Journal of Contextual Behavioral Science, 4(3), 157–162.
Johnson, D. (1995). An overview of learning disabilities: Psychoeducational perspectives.
Journal of Child Neurology.
Lalvani, P. (2015). Disability, Stigma and Otherness: Perspectives of Parents and Teachers.
International Journal of Disability, Development & Education, 62(4), 379–393.
Lance, C. E., & Vandenberg, R. J. (2009). Statistical and Methodological Myths and Urban Legends: Doctrine, Verity and Fable in the Organizational and Social Sciences. Taylor &
Francis.
Levin, M. E., Luoma, J. B., Lillis, J., Hayes, S. C., & Vilardaga, R. (2014). The Acceptance and Action Questionnaire–Stigma (AAQ-S): Developing a measure of psychological flexibility with stigmatizing thoughts. Journal of contextual behavioral science, 3(1), 21- 26.
Lundy, C., Bhambhani, Y., & Kellum, K. (2018). The Stigmatization of Concealable and Apparent Intellectual Disabilities. McNair Scholars Research Journal.
Machin, T. M., & Jeffries, C. H. (2017). Threat and opportunity: The impact of social
inclusion and likeability on anonymous feedback, self-esteem, and belonging. Personality and Individual Differences, 115, 1–6.
Masuda, A., Price, M., Anderson, P. L., Schmertz, S. K., & Calamaras, M. R. (2009). The role of psychological flexibility in mental health stigma and psychological distress for the stigmatizer. Journal of Social and Clinical Psychology, 28(10), 1244-1262.
Nicholson, L., & Cooper, S. A. (2012). Social exclusion and people with intellectual
disabilities: a rural–urban comparison. Journal of Intellectual Disability Research, 57(4), 333–346.
Noone, S. J., & Hastings, R. P. (2009). Building psychological resilience in support staff caring for people with intellectual disabilities: Pilot evaluation of an acceptance-based intervention. Journal of Intellectual Disabilities, 13(1), 43-53.
Rolffs, J. L., Rogge, R. D., & Wilson, K. G. (2018). Disentangling Components of Flexibility via the Hexaflex Model: Development and Validation of the Multidimensional
Psychological Flexibility Inventory (MPFI). Assessment, 25(4), 458–482.
The State of Queensland; Department of Communities; Child Safety and Disability Services;
Channel Management Program (2016.). Bullying, disability and mental health. People with disability
Thompson, A. E. (2015). The americans with disabilities act. JAMA, 313(22), 2296–2296.
Vann, M. R. (2014, May 07). The 10 Worst Mental Health Treatments in History.
Werner, S. (2015). Public stigma in intellectual disability: do direct versus indirect questions make a difference? Journal of Intellectual Disability Research, 59(10), 958–969.
Yuker, H. E., & Block, J. R. (1986). Research with Attitude Towards Disabled Persons Scale (ATDP) 1960-1985. New York, NY: Hofstra University
Yuker, H. E., Block, J. R., & Young, J. H. (1970). The measurement of attitudes towards disabled persons. Albertson, New York: Insurance Company of North America.
Retrieved from http://www.eric.ed.gov/PDFS/ED044853.pdf..
Figures Pilot Study
Figure 1. Box plot graphs of IRAP data of trial types 1, 2, 3, and 4.
Figure 2. Data from the IRAP trial types and the ATDP survey graphed on a box plot.
Figure 3. ATDP and Apparent Negative D-Score data graphed on a scatter plot.
Figure 4. ATDP and Apparent Positive D-Score data graphed on a scatter plot.
Figure 5. ATDP and Concealable Negative D-Score data graphed on a scatter plot.
Figure 6. ATDP and Concealable Positive D-Score data graphed on a scatter plot.
Figure 7. Flexibility and Inflexibility data graphed on a scatter plot.
Figure 8. ATDP and Flexibility data graphed on a scatter plot.
Figure 9. ATDP and Inflexibility data graphed on a scatter plot.
Present Study
Figure 10. Average ATDP and MPFI scores.
Figure 11. Trial Type Table.
Figure 12. Trial Type D-scores graphed on box plots.
Figure 13. Trial Type D-scores by ATDP data graphed on box plots.
Figure 14. Trial Type 2 by ATDP data graphed on a scatter plot.
Figure 15. Trial Type 1 by ATDP data graphed on a scatter plot.
Figure 16. D-scores by Family with ID data graphed on box plots.
Figure 17. D-scores by Friends with ID data graphed on box plots.
Figure 18. D-scores by Interaction with ID data graphed on box plots.
Figure 19. D-scores by Flexibility data graphed on box plots.
Figure 20. D-scores by Inflexibility data graphed on box plots.
Figure 21. Flexibility and Inflexibility data graphed on a scatter plot.