I would like to thank my friends Laura and Ian, who are like family to me. I would also like to thank my friends Fiona, Jordan and John Rich for all their professional and personal support. Refinement of niobium oxide powders as a function of heat treatment. a)-(c) show the change in lattice parameters and (d) unit cell volume for. niobium oxides as a function of temperature.
Variation in peak position with temperature... 41 Figure 15. SEM and corresponding EDX spectra for 1 day SBF immersed grains of. 47 Figure 17. SEM images and corresponding EDX spectra for 30 days SBF immersed .. grains of Nb2O5 a) amorphous b) hexagonal and c) orthorhombic at 5kx. SEM images and corresponding EDX spectra for 7 days SBF immersion.. grains of TiO2 a) amorphous b) tetragonal (anatase) at 5kx.
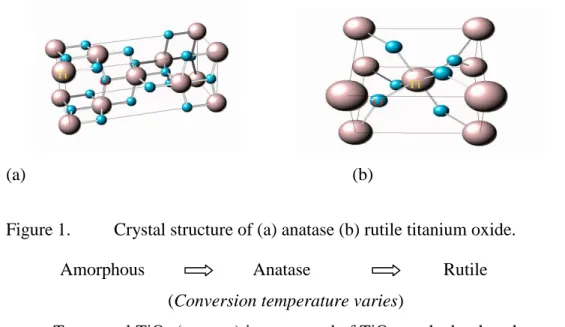
53 Figure 21. SEM images and corresponding EDX spectra for 30 days immersed SBF .. TiO2 pellets a) amorphous b) tetragonal (anatase) at 5kx. The phase transformations of niobium oxide as a function of calcination temperature were as follows; amorphous to hexagonal (~500oC) and hexagonal to orthorhombic (~600oC).
INTRODUCTION
Biocompatible materials
Furthermore, titanium-based metals and alloys are also used in medical applications, as they often form a thin oxide layer TiO2 that interacts with the living environment, improving the bioactivity of the implant. However, this naturally formed oxide layer is irregular and not efficient for long-term applications3. Also when the artificial implant is covered with a low elastic modulus fabric, it can eliminate stress shielding, promote bone remodeling and prevent implant fracture6.
The bioactive coatings therefore provide a stable interface between the implant and the surrounding tissue, which increases their durability3.
Bioactivity testing using simulated body fluid (SBF)
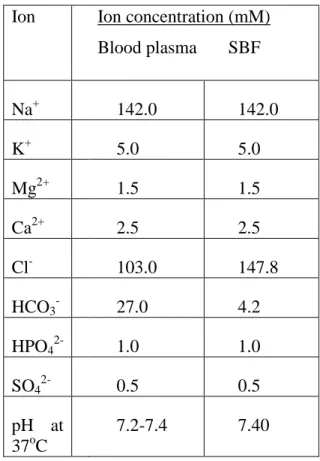
Therefore, even in the case of titanium metal implants, it is often necessary to coat the metal implants with oxides to make them more durable3. SBF does not contain any cells or proteins, which means that the apatite layer is only formed by the chemical reaction of the bioactive ceramic with the surrounding fluid. Therefore, it is expected that new bioactive materials can be designed by controlling the chemical reactivity of materials in SBF.
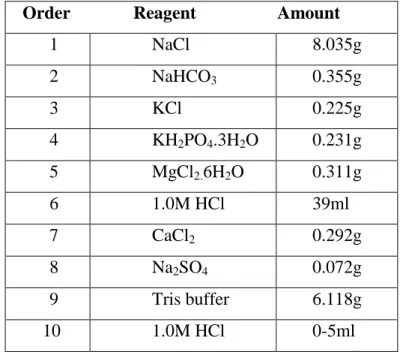
In addition to the SBF composition shown above in Table I, several SBF compositions have been proposed by different researchers17,18. The three main differences between SBF solutions and serum are (i) the absence of proteins, while they are known to play an essential role in controlling apatite nucleation (nucleation inhibitors), (ii) the addition of TRIS to buffering SBF solutions, and (iii) ) the lack of control over the.
Apatite formation in SBF
Material property effects on bioactivity
Composition effect on bioactivity
Structural effect on bioactivity
- Niobium and titanium oxide structure
- Niobium and titanium oxide processing
- Influence of processing technique on microstructure and properties
- Niobium and titanium oxide bioactivity
- EXPERIMENTAL PROCEDURE
- Solution preparation
- Powder preparation
- Material characterization
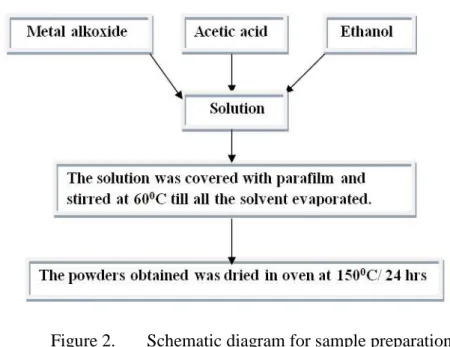
The sol-gel method is a wet chemical route for the preparation of inorganic oxides based on the hydrolysis and condensation of molecular precursors in a solvent with or without the use of a catalyst23. In particular, sol-gel processing has gained impetus over others due to inherent advantages including; high purity raw materials, low processing temperature, uniform phase distribution, excellent morphology control and low cost49. In general, the surface structure of sol-gel prepared oxides (Nb2O5, TiO2 and mixed oxide of SiO2-TiO2) has been shown to be highly porous, with large surface roughness and minimal organic residues3.
Therefore, sol-gel processing is considered as one of the preferred techniques to obtain the structural features needed to improve the apatite-forming ability of materials. It was reported that sol-gel prepared Nb2O5 showed higher biocompatibility than those prepared by magnetron sputtering 2,4,9. The sol-gel coating has also been reported to yield higher surface OH functionalities than those produced by acid/base treatment52.
Sol-gel synthesized TiO2 (anatase) showed good apatite formation after 1 day, while TiO2 prepared by sputtered films showed good apatite formation after 5 days. In this thesis, amorphous powders of niobium and titanium oxide were successfully prepared using alkoxide-based sol-gel preparation methods.
Differential thermal analysis/ thermogravimetric analysis (DTA-TGA)
High temperature x-ray diffraction
Rietveld method performed on the crystalline data
Raman spectroscopy
Specific surface area and porosity analyzer
SEM/EDX
Bioactivity analysis
Simulated body fluid testing
Soaking in SBF
Pellet dimensions (diameter and height) were measured to calculate pellet surface area using Equation (1). The volume of SBF in which the pellet is soaked depends on the surface area of the pellet. After soaking, the pellets are removed from the solution, rinsed gently with deionized water and stored in an incubator at 37oC for 24 hours.
RESULTS AND DISCUSSION
- Processing
- Material Characterization
DTA/TGA
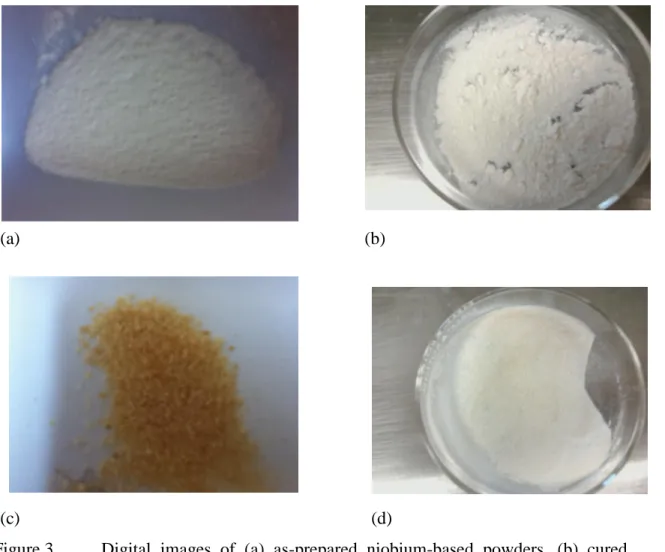
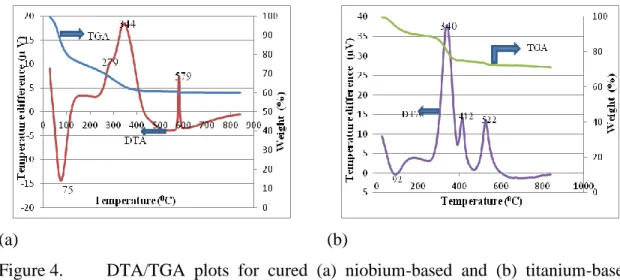
It is worth noting here that this preparation method was reproducible and produced powders free of contamination. DTA/TGA performed with mass spectroscopy for sol-gel prepared powders with NbCl5 and butanol respectively as precursor and solvent with addition of acetic acid reported the removal of C3H7, C4H8, H2O, HCl and CH2OH at ~220oC and exothermic peaks between 400 - 530oC were due to removal of C3H7, C4H8 at 410oC along with CO2 and HCl at 450 and 530oC respectively47. The sharp peak at 579oC corresponded to transformation from amorphous to hexagonal phase (TT-Nb2O5).
This transformation temperature has previously been reported to be around 400 - 500oC and is a strong function of the molecular precursor and heating rate used42,47. The exact effect of heating rate could not be explained since the change in transformation also depended on the synthesis history41. Niobium oxide undergoes transformation from hexagonal phase (TT-Nb2O5) to orthorhombic phase (T-Nb2O5) at higher temperature ~600oC.
For titanium-based powders, an endotherm is observed at 92oC while exotherms are observed at approximately 340, 412 and 522oC (Figure 4 b). For titanium-based powders, an endotherm observed at 92oC due to the removal of water was accompanied by a weight loss of ~10%. This is consistent with previous studies, which show that desorption of physisorbed water occurs between 70 - 200oC with associated weight loss.
As mass spectroscopy was not performed together with DTA/TGA analysis, the removed organic compounds could not be identified. However, it has been reported that the organic species are usually compounds of alcohol and adsorbed acetic acid. A single broad peak instead of two exotherms was also reported, indicating slow crystallization with concomitant removal of organic species 55 , 56 .
The sharp peak at 412 °C is most likely related to the phase transformation from amorphous to anatase-TiO2, as previous authors reported the crystallization temperature to be between 300-400 °C43,56. The sharp exothermic peak at 522 °C associated with a weight loss of ~5% is most likely due to the phase transformation from anatase to rutile, as several authors have confirmed this transformation to be around 600 °C by XRD43 analysis. However, not many DTA/TGA analyzes reported this transformation and the peaks obtained between 460 – 500 oC were related to the removal of residual HCl and CO256.
High temp x-ray diffraction
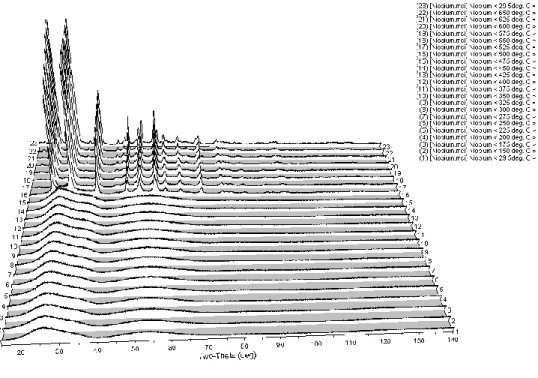
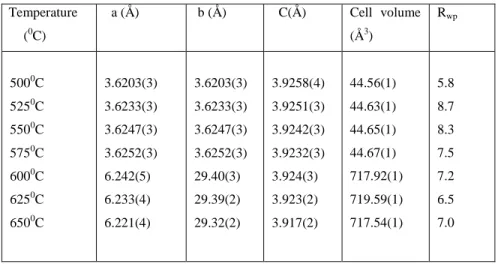
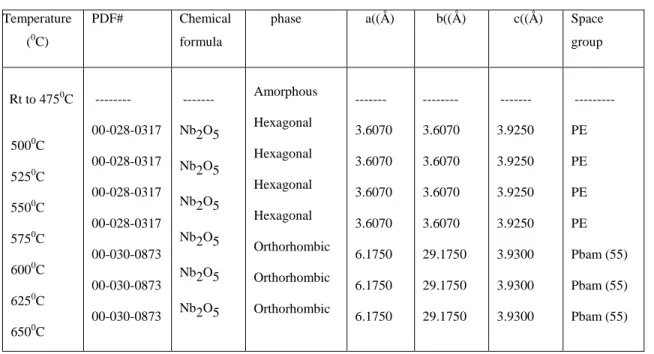
The XRD patterns in Figure 5 show the phase evolution of as-prepared niobium-based powders heated in-situ from room temperature to 650oC. The crystal structure then transformed to an orthorhombic phase between 575 and 600oC, remaining stable until 650oC. Lattice constants, space groups and phases of powders obtained after analysis of high-temperature X-ray diffraction patterns of niobium-based powders are given in Table V.
Niobium powders heated from 500 to 575oC matched the JCP file numbers, corresponding to the hexagonal phase. The HTXRD data showed the phase evolution of niobium oxide powders as a function of calcination temperature. This is because ready-made powders synthesized by the sol-gel technique are usually amorphous in nature57.
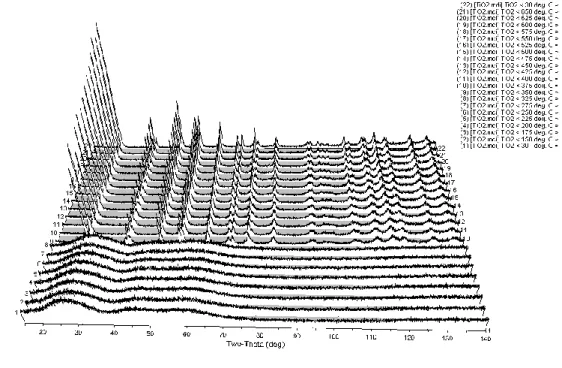
A mixture of amorphous and crystalline phases was observed after heat treatment at 500oC which was clearly out. The transformation from hexagonal phase (TT-Nb2O5) to orthorhombic phase (T-Nb2O5) above ~600oC agrees with the value reported by different authors46,59. The XRD patterns in Figure 6 show the phase evolution of as-prepared titanium-based powders heated in-situ from 29.5 to 650oC.
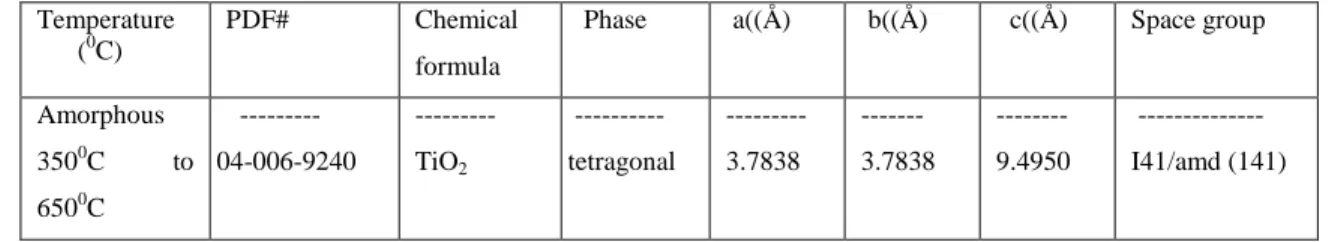
The lattice constants, space groups, and phases of the powders obtained after analysis of high-temperature in situ X-ray diffraction patterns for the titanium-based powders are given in Table VI . The HTXRD data showed the phase evolution of the titanium oxide powders as a function of the calcination temperature. Crystallization from the amorphous phase to anatase occurred above 325oC; this is consistent with reports suggesting that the transformation temperature range is 300-400oC57,60,61.
The synthesized TiO2 powders consisted of anatase phase up to a calcination temperature of about 650oC.
Rietveld method
Bioactivity testing
Simulated Body Fluid (SBF) testing
CONCLUSION
Structural evolution and phase identification were performed using HTXRD complemented with Raman spectroscopy. Structural changes in Raman were observed with peak narrowing and shifting as the oxide approached crystallization. Biocompatibility analysis performed by SBF testing showed that Ca and P layer deposition is favorable for anatase TiO2 and hexagonal Nb2O5.
The other factors such as high organic content, presence of contamination and higher density may also be responsible for the absence of Ca and P layer deposition on other oxides.
FUTURE WORK
Yen, “Biomimetic growth of apatite on TiO2 electrolyte coatings in simulated body fluid,” Mater.s Sci. Li, "Photocatalytic preparation of silver-coated TiO2 particles for antibacterial applications," World J. Li, "In situ X-ray diffraction study of the reduction processes of Fe3O4- and Fe1−xO- catalysts for ammonia synthesis," J .
34;Reaction path to the synthesis of anatase via the chemical modification of titanium isopropoxide with acetic acid," Chem. Sakka, "Photoelectrochemical properties of TiO2 coating films prepared using different solvents by the sol-gel method." Mohammadi, “Sol– gel nanostructured titanium dioxide: Control of the crystal structure, crystallite size, phase transformation, packing and ordering,” Microporous and Mesoporous Mater.
Dongare, "Preparation of titanium (IV) oxide thin film photocatalyst by sol-gel dip coating," Mater.Chem Phys, 77 [3]. Lampert, "Preparation and properties of spin-coated Nb2O5 films by the sol-gel process for electrochromic applications." Banfield, “Kinetics of crystallization and crystal growth of nanocrystalline anatase in nanometer-sized amorphous titania,” Chem.
Mohammadi, “Sol-gel nanostructured titanium dioxide: control of crystal structure, crystallite size, phase transformation, packing and ordering,” microporous and mesoporous materials. Dongare, “Preparation of titanium (IV) oxide thin film photocatalyst by sol-gel dip coating,” Mater.