C h a p t e r I V
Substrate Pathways in the Nitrogenase MoFe Protein by Experimental Identification of Small Molecule Binding Sites
This chapter is a copy of the article published in Biochemistry under the ACS AuthorChoice license (http://pubs.acs.org/doi/full/10.1021/bi501313k).78 Some additional work is also
included herein, and it is noted accordingly.
IV.A. Abstract
In the nitrogenase molybdenum-iron (MoFe) protein, we have identified five potential substrate access pathways from the protein surface to the FeMo-cofactor (the active site) or the P-cluster using experimental structures of Xe pressurized into MoFe protein crystals from Azotobacter vinelandii and Clostridium pasteurianum. Additionally, all published structures of the MoFe protein, including those from Klebsiella pneumoniae, were analyzed for the presence of non-water, small molecules bound to the protein interior. Each pathway is based on identification of plausible routes from buried small molecule binding sites to both the protein surface and a metallocluster. Of these five pathways, two have been previously suggested as substrate access pathways. While the small molecule binding sites are not conserved among the three species of MoFe protein, residues lining the pathways are generally conserved, indicating that the proposed pathways may be accessible in all three species. These observations imply that there is unlikely a unique pathway utilized for substrate access from the protein surface to the active site; however, there may be preferred pathways such as those described here.
IV.B. Introduction
Nitrogen fixation is the process by which atmospheric dinitrogen (N2) is reduced to a biologically active form of nitrogen, ammonia (NH3).79 This reaction is achieved on the industrial scale by the Haber-Bosch process, producing enough ammonia for nitrogen fertilizers to sustain
80 Because of the dependence of the Haber-Bosch process on molecular hydrogen obtained from natural gas, this process accounts for more than 1.5% of the global energy consumption each year.80 Industrial nitrogen fixation uses heterogeneous iron catalysts, pressures near 250 atm, and temperatures between 400 and 600 °C to reduce dinitrogen.80,81 In contrast, the biological catalyst, nitrogenase, reduces N2 to NH3 at ambient temperature and atmospheric pressure. Understanding the process by which nitrogenase functions may facilitate the development of environmentally cleaner alternatives to the Haber- Bosch process, making nitrogenase an attractive enzyme to study for biotechnological NH3
production. Although the enzyme has been studied for many decades, the detailed mechanism of N2 reduction remains poorly understood. For example, certain stoichiometric aspects of the standard model of biological nitrogen fixation (Scheme IV-1) are still under discussion, including the ATP/e ratio and the obligatory nature of H2 evolution.82 Furthermore, N2 reduction requires at least six protons, but the specific form of ammonia evolved (NH3 versus NH4+) and the possibility of H2 evolution may require up to 10 or more protons for N2 reduction.
Scheme IV-1. The standard model for biological nitrogen fixation
Nitrogenase consists of two proteins: the hetero-tetrameric molybdenum-iron (MoFe) protein and the homodimeric iron (Fe) protein. The Fe protein houses two ATP binding sites and
N2 + 8 H+ + 8 e- + 16 ATP 2 NH3 + H2 + 16 ADP + 16 Pi
- - -subunit interfaces, (2) two active sites, a [7Fe:9S:Mo:C:R-homocitrate] cluster called the FeMo- -subunits, and (3) two mononuclear iron sites, named Fe16, - -subunits.23 During substrate turnover, electrons flow from the [4Fe:4S] cluster to the P-cluster to the FeMo- cofactor, at which most, if not all, substrate reduction occurs upon sufficient buildup of protons and electrons.30 Considering only the inorganic components, the FeMo-cofactor adopts near C3v
symmetry, with a central, trigonal prismatic core composed of three faces and three edges parallel to the C3 axis that are made from six Fe atoms, numbered Fe2, 3, 4, 5, 6, and 7. A particular face may be identified by listing the four Fe atoms composing that face, such as Fe2,3,6,7. Similarly, an edge is identified by listing the two Fe atoms composing that edge.
Examined in isolation, the edges and faces would be indistinguishable from each other, but variation in neighboring protein residues creates nonequivalent environments around the FeMo-cofactor inside the protein. The edges and faces may therefore each have different mechanistic roles. For example, CO has been shown to bind in a bridging fashion to Fe2,6.37
In this work, five possible pathways for substrate access from the protein surface to the FeMo-cofactor or P-cluster are experimentally identified. To accomplish this, Azotobacter vinelandii (Av) and Clostridium pasteurianum (Cp) MoFe protein crystals were pressurized with xenon (Xe) gas. Additionally, all published structures of the MoFe protein, including those from Klebsiella pneumoniae (Kp), were analyzed for the presence of nonwater, small molecules bound to the protein interior. The native Av, Cp, and Kp MoFe proteins are called Av1, Cp1, and Kp1, respectively, and the corresponding Xe-pressurized proteins are referred to as Av1-Xe and Cp1-Xe. Kp1 and Av1 are structurally similar (73% sequence identity), while their comparison to
Cp1 shows an insertion and a deletion, each 50 residues, as well as primary structure differences (36% sequence identity between Cp1 and Av1).
Although Xe is monatomic, unlike nitrogenase substrates, several advantages exist for using Xe as a model for nitrogenase substrates such as N2: (1) Xe and N2 are neutral, polarizable, water-soluble, and unable to form hydrogen bonds; (2) the atomic radius of Xe (1.08 Å) is comparable to the NN bond distance (1.10 Å), so sterically, N2 may travel similar pathways as those penetrable by Xe; and (3) Xe is easily detected by X-ray crystallography due to its high electron density and strong anomalous scattering. Furthermore, Xe pressurization is well established as a tool for probing gaseous substrate pathways in several biological molecules, including myoglobin,83 86 copper amine oxidase,87,88 laccase,89 methane monooxygenase hydroxylase,90,91 cytochrome c oxidase,92 cytochrome ba3 oxidase,93,94 acetyl-CoA synthase/carbon monoxide dehydrogenase,95 and antibodies that oxidize water.96 Finally, several molecular dynamic simulations support using Xe binding sites as markers for substrate pathways.97 101
X-ray crystallography, 129Xe-NMR, and computational work on previous Xe studies indicate that Xe typically induces minimal distortion in the protein structure and occupies existing cavities in a protein either by displacing water molecules or filling otherwise empty pockets.83 85,87 90,92,95,96 Reflecting the inertness of Xe, it tends to bind to the protein using mostly noncovalent, weak van der Waals forces with limited polarization interactions.97 The Xe binding sites are usually hydrophobic, and the closest contacts (3.5-6.0 Å) are typically aliphatic and aromatic side-chains but can be polar groups.79 81,83 86,88,91,92 These studies also show that pathways tend to travel parallel to secondary structure elements rather than through them.97
Previous studies on nitrogenase have identified four possible pathways to the active site. First, a water channel extending from the protein surface to the FeMo-cofactor, called the
interstitial channel, was identified from structural analysis of Av1, Cp1, and Kp1, and has been expected to facilitate access to the active site for protons and possibly larger substrates.102 106 Use of the water-filled interstitial channel as an access pathway to the active site does not preclude the existence of other pathways since nonpolar substrates may prefer a less polar route. Second, Seefeldt and co-workers used the program CAVENV from the CCP4 suite with a probe radius of 2.5 Å to identify a hydrophobic substrate pathway, herein called the IS pathway (for authors Igarashi and Seefeldt).29 The third previously proposed pathway, called the NH3
egress pathway by its authors, was identified by a computational cavity analysis of Av1 and Kp1;
it extends through the protein scaffo -subunit surface to the FeMo-cofactor.102 Fourth, molecular dynamic calculations yielded a possible substrate pathway that traces the shortest path from the protein surface to the FeMo-cofactor.101 Like the NH3 egress and IS pathways, it does not utilize any water channels but rather tunnels through the protein scaffold.
Since nitrogenase has a relatively leisurely turnover rate of about 1 N2/sec per active site, migration through the protein scaffold in the absence of permanent pathways should not be rate limiting, by analogy to O2 binding to the buried heme of myoglobin and hemoglobin.19,107 Compared to the four previously proposed pathways, only the interstitial water channel and the IS pathway coincide with pathways identified in the present work, suggesting that there are multiple potential pathways connecting the surface to the active site of nitrogenase.
IV.C. Results and discussion
Xe sites were determined from the X-ray crystal structures of one Av1 and two Cp1 Xe- pressurized crystals (Figure IV-1 and Table IV-1). Similar to previous Xe binding studies,79 81,83
86,88,91,92 the Xe atoms in the MoFe proteins displace water or other small molecules or fill empty pockets, rather than displacing residue side chains (Table VI-2). The three Xe sites in Av1-Xe are
binding sites in Cp1-Xe. The root-mean-square deviations (RMSD) between the Xe-pressurized protein structures compared to their native structures is 0.20 Å. The RMSD of only the Xe binding pockets is between 0.15 and 0.23 Å, indicating little protein distortion from Xe incorporation (Table IV-S1).
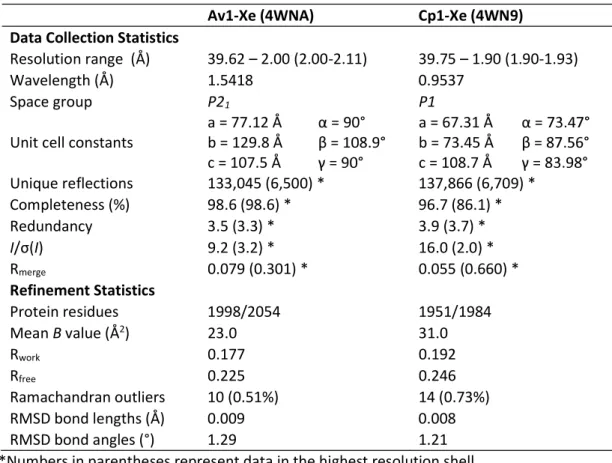
Table IV-1. X-ray crystallographic data collection and refinement statistics for Av1 and Cp1
Av1-Xe (4WNA) Cp1-Xe (4WN9)
Data Collection Statistics
Resolution range (Å) 39.62 2.00 (2.00-2.11) 39.75 1.90 (1.90-1.93)
Wavelength (Å) 1.5418 0.9537
Space group P21 P1
Unit cell constants a = 77.12 Å b = 129.8 Å c = 107.5 Å
90° a = 67.31 Å b = 73.45 Å c = 108.7 Å Unique reflections 133,045 (6,500) * 137,866 (6,709) *
Completeness (%) 98.6 (98.6) * 96.7 (86.1) *
Redundancy 3.5 (3.3) * 3.9 (3.7) *
I I) 9.2 (3.2) * 16.0 (2.0) *
Rmerge 0.079 (0.301) * 0.055 (0.660) *
Refinement Statistics
Protein residues 1998/2054 1951/1984
Mean B value (Å2) 23.0 31.0
Rwork 0.177 0.192
Rfree 0.225 0.246
Ramachandran outliers 10 (0.51%) 14 (0.73%)
RMSD bond lengths (Å) 0.009 0.008
RMSD bond angles (°) 1.29 1.21
*Numbers in parentheses represent data in the highest resolution shell.
Xe binding sites in Av1-Xe (PDB ID 4WNA) and Cp1-Xe (PDB ID 4WN9), as well as the PRL site in the Cp1-Xe structure, were analyzed for potential access routes to the FeMo-cofactor.
Access to the P-cluster was also explored. In addition, imidazole (IMD), ethylene glycol (EDO), carbon monoxide (CO), and sulfur (S) binding sites from previously reported Av1, Cp1, and Kp1
structures were examined (Table IV-S2).22,37,64,66 For all these small molecule binding sites (with the exception of the S site that may be derived from a cofactor sulfur37), we can conclude with certainty that a route from the protein surface to the binding site exists; however, routes from the binding sites to the cofactors are inherently less certain, and indeed, may not exist. Potential pathways were generated using the program CAVER. For reference, Figure IV-2 and the movie provided in the Supporting Information (section IV.I.) summarize all of the known water channels and proposed substrate pathways from this study and previously published studies.
Residues involved in all pathways are provided in Table IV-S3, and close contacts for each small molecule binding site are provided in Tables IV-S6 IV-S13.
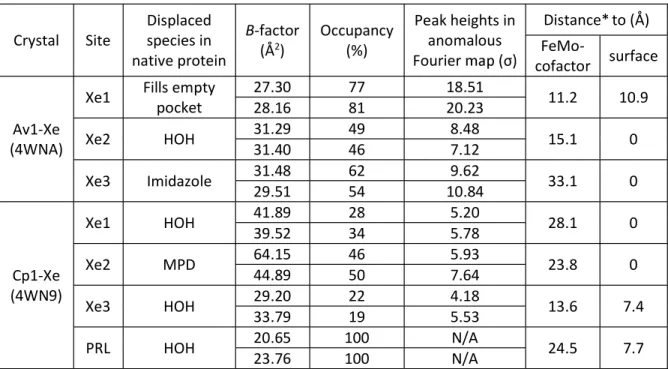
Table IV-2. Properties of small molecule binding sites in Av1 and Cp1 Xe-pressurized crystals
Crystal Site
Displaced species in native protein
B-factor (Å2)
Occupancy (%)
Peak heights in anomalous Fourier
Distance*to (Å) FeMo-
cofactor surface
Av1-Xe (4WNA)
Xe1 Fills empty pocket
27.30 77 18.51
11.2 10.9
28.16 81 20.23
Xe2 HOH 31.29 49 8.48 15.1 0
31.40 46 7.12
Xe3 Imidazole 31.48 62 9.62 33.1 0
29.51 54 10.84
Cp1-Xe (4WN9)
Xe1 HOH 41.89 39.52 28 34 5.20 5.78 28.1 0
Xe2 MPD 64.15 46 5.93
23.8 0
44.89 50 7.64
Xe3 HOH 29.20 22 4.18
13.6 7.4
33.79 19 5.53
PRL HOH 20.65 100 N/A 24.5 7.7
23.76 100 N/A
* Distances were measured from Xe or PRL to the closest non-solvent atom in the FeMo- cofactor or at the protein surface.
IV.D.i. AI/IS and AII pathways: FeMo-cofactor access based on Xe binding sites
Xe binding sites in Cp1 and Av1 were examined to identify potential substrate pathways to the active site. We focused on buried Xe, as these sites have already penetrated into the -subunit, since these are closer to
the FeMo- -subunit: Xe i -subunit (Av1-
Xe1, Av1-Xe2, Cp1-Xe2) are 15, 13, and 23 Å away from the closest Fe atom in the FeMo- -subunit (Cp1-Xe1 and Av1-Xe3) are 28 and 33 Å away, respectively. These constraints narrow the relevant Xe sites to Av1-Xe1 and Cp1-Xe3.
Figure IV-1. Ribbon representation of Cp1 showing locations for all Xe, PRL, and other small - -subunits are colored in green and cyan, respectively. The FeMo-cofactor, P-cluster, Fe16, and small molecules are displayed as small spheres colored by element. Av1 and Cp1 Xe sites are shown in large blue and magenta spheres, respectively.
Binding sites observed in Av1 and Kp1 structures are superposed onto the Cp1 structure. (Cp1- Xe PDB ID: 4WN9; Av1-Xe PDB ID: 4WNA).
Av1 CO
FeMo-cofactor P-cluster
Fe16 Cp1 Xe1
Cp1 Xe2, MPD, EDO
Cp1 Xe3 Av1 Xe1
Av1 Xe2
Av1 Xe3, IMD Cp1 PRL
Av1 & Kp1 IMD, EDO Av1 S
Figure IV-2. Ribbon representation of Av1 illustrating the channels and pathways discussed in
- -subunits are colored cyan
and yellow. The cofactors are shown in ball-and-stick representation colored by element.
Pathways were calculated using CAVER and are displayed as surfaces within the protein structure.108 This figure was created in PyMOL.63
We propose two substrate pathways based on Av1-Xe1 and Cp1-Xe3, called AI and AII, respectively (Figure IV-3). In both pathways, two routes were calculated: one from the protein surface to the binding site and another from the binding site to the FeMo-cofactor. The AI pathway, as calculated by CAVER, may include the surface site Av1-Xe2 as the point of substrate penetration through the protein surface; it is in close proximity (11 Å) to Av1-Xe1. A portion of the AI pathway is conserved in the previously published pathway by Seefeldt and co-workers (herein called the IS pathway) using the program CAVENV.29 The IS pathway differs from the AI pathway at the point that it breaches the protein surface. The program utilized in this paper, CAVER, also identified the breaching point of the IS pathway as more favorable than the breaching point of the AI pathway: the average bottleneck radius of the IS and AI pathways from the Av1-Xe1 atom to the protein surface are 0.83 and 0.48 Å, respectively, and the lengths of
NH3 egress pathway (yellow) MD pathway (red)
FeMo-cofactor BI (forest green) AII (magenta)
Center water channel (brown) AI/IS (blue)
P-cluster CI (green) DI pathway/
interstitial water channel (orange)
the pathways are 18.5 and 21.2 Å, respectively. In fact, the IS pathway is the most favored pathway as calculated by CAVER. However, binding of the Av1-Xe2 suggests that there may be multiple entry routes for the AI/IS pathway. Therefore, we present both entry/exit points as possible substrate pathways. Notably, the AI/IS pathway is predominantly hydrophobic, with the exception of residues at the protein surface and a couple around the water surrounding the FeMo-
nonpolar substrates and/or reduction products. The AI/IS and AII pathways provide access to two of the three faces of the FeMo-cofactor, namely, the Fe2,3,6,7 and Fe3,4,5,7 faces. Since Xe is nonpolar and the interior Xe sites do not overlap with any polar species from other MoFe crystal structures, the AI and AII pathways may be primarily used by nonpolar substrates and/or reaction products.
Fe3 Fe7
-Lys209 -Arg203 -Trp205 -Glu263 -Ile262 -Val202 -Trp253 -Val179 -Trp72 -Met78 -Val71 -Ser254 -Ile75 -Tyr229 -Val70 -Ile282
-Asp200 -Asn199 -His196 -Tyr281 -Met279
-Ser278 -His195 -Cys275
-Arg96 Fe2
Fe6 Av1-Xe1
Av1-Xe2 (a)
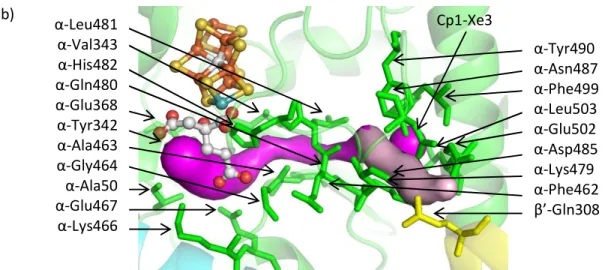
Figure IV-3. (a) The AI/IS pathway. From the protein surface to the Xe binding site, the AI and IS pathways follow the light purple and cyan pathways, respectively. From the Xe binding site to the FeMo-cofactor, the pathways (slate blue) are the same. Substrates may penetrate the protein surface at the Av1-Xe2 binding site following the light blue pathway or as illustrated by the cyan pathway. Upon reaching the Av1-Xe1 binding site, substrates may continue toward the FeMo-cofactor following the slate blue pathway. The Fe atoms accessed on the FeMo-cofactor by this pathway are labelled. Av1-Xe1 and Av1-Xe2 are displayed as large blue spheres. (b) The AII pathway (magenta and light pink surfaces). Substrates may reach the Cp1-Xe3 binding site following the light pink pathway and then continue toward the FeMo-cofactor following the magenta pathway. Cp1-Xe3 is displayed as a large magenta sphere. In both figures, residues respectively.
IV.D.ii. BI pathway: FeMo-cofactor access based on PRL binding sites
-Glu323 -Lys424 (Figure IV-S2 and Table IV-S12). PRL resides in an arm of the center channel that curves toward the cofactors (Figure IV-4). The arm terminates before reaching the FeMo- cofactor; thus, substrates would need to continue through the protein scaffold to reach the active site. With CAVER, we deduced a possible substrate pathway from the PRL binding site to the FeMo-cofactor (pathway BI), which accesses the FeMo-cofactor at the Fe2,3,6,7 face.
-Leu481 -Val343 -His482 -Gln480 -Glu368 -Tyr342 -Ala463 -Gly464 -Ala50 -Glu467 -Lys466
-Tyr490 -Asn487 -Phe499 -Leu503 -Glu502 -Asp485 -Lys479 -Phe462
-Gln308 Cp1-Xe3
(b)
(Figure continues on next page) Part of the center
water channel CI Pathway
P-cluster BI Pathway
FeMo-co
Fe16 (a)
PRL
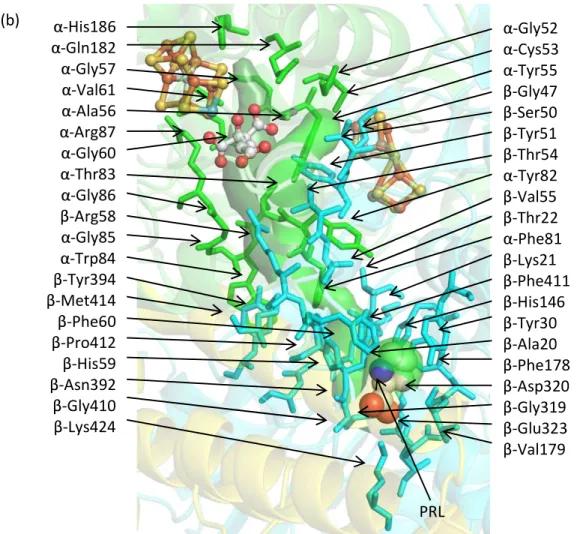
Figure IV-4. (a) PRL binds in an arm of the center channel (brown surface) that reaches toward the cofactors. The arm terminates before reaching the FeMo-cofactor, so substrates must continue to the cofactors within the protein scaffold. The most likely pathway (in terms of size) - -subunits. Branching from this pathway, substrates may either head toward the FeMo-cofactor (forest green surface, pathway BI) or toward the P-cluster (green surface, pathway CI). (b) A close-up view of the BI and CI pathways leading to the FeMo-cofactor and P-
and yellow, respectively. Residues lining the pathway are shown in sticks and labelled. The cofactors and PRL are displayed as spheres colored by element.
IV.D.iii. CI pathway: P-cluster access based on PRL binding sites
Although generally considered as functioning in electron transfer between the Fe protein and FeMo-cofactor, ligand access to and from the P-cluster may be necessary since there is likely elimination of a sulfur atom during P-cluster biosynthesis.109 Also, the redox
-Gly52 -Cys53 -Tyr55 -Gly47 -Ser50 -Tyr51 -Thr54 -Tyr82 -Val55 -Thr22 -Phe81 -Lys21 -Phe411 -His146 -Tyr30 -Ala20 -Phe178 -Asp320 -Gly319 -Glu323 -Val179 -His186
-Gln182 -Gly57 -Val61 -Ala56 -Arg87 -Gly60 -Thr83 -Gly86 -Arg58 -Gly85 -Trp84 -Tyr394 -Met414 -Phe60 -Pro412 -His59 -Asn392 -Gly410 -Lys424 (b)
PRL
properties of the P-cluster indicate that it could potentially reduce protons and perhaps other substrates.82,110 A possible substrate pathway, CI, from the PRL site to the P-cluster (Figure IV-4) was calculated by CAVER. The PRL is 16 Å away from the P-cluster and 24 Å away from the FeMo-cofactor; however, the closest metal center to the PRL binding site is Fe16, at a distance of 14 Å. Although the identity of this third metal site has been confirmed, its function is not currently known.23
Because the volume of the center channel is in excess of 1500 Å3, the walls of the center channel are essentially an extension of the protein surface. As such, the MoFe protein resembles an oblong donut, in which the center channel is the donut hole.21 Water molecules, nonpolar atoms (Xe), and polar molecules (IMD, EDO, MPD) are all found on the protein surface so it is not unexpected that these species have binding sites in the center channel as well. Therefore, the BI and CI pathways may facilitate access to the FeMo-cofactor for all species.
IV.D.iv. DI pathway/interstitial water channel: FeMo-cofactor access based on IMD, EDO, CO, and S binding sites
All published structures of native Av1, Cp1, and Kp1 were investigated for additional non-water, small molecule binding sites. Those containing small molecules are listed in Table IV- S2. These guest molecules come from crystallization solutions, cryo-protectants, or pressurized gas and include imidazole (IMD), 2-methyl-2,4-pentanediol (MPD), Mg2+, 1,2-ethanediol (EDO), and carbon monoxide (CO); the sulfur (S) may be derived from the FeMo-cofactor.22,37,64,66
We focused on small molecules bound to the protein interior, of which there are five from previously reported MoFe protein structures (Table IV-SB). Several of these bind in or near the interstitial channel (Figure IV-5), which has been previously proposed to function as a substrate access pathway, as deduced from the conserved water network in Av1, Cp1, and Kp1.
The exogenous small molecules observed to bind within this channel include IMD in Av1 (3U7Q) and EDO in Kp1 (1QGU) (Table IV-S4).22,66 The CO and S in Av1 (4TKV) bind in a protrusion from the interstitial channel. This protrusion (purple surface in Figure IV-S5 - subunit to the protein surface; however, it is narrower and longer than the DI pathway.
Therefore, only the short protrusion from the DI pathway containing the CO and S atoms is shown. The IMD and EDO sites directly overlap and are 4.8 and 7.7 Å from the CO and S, respectively. The polarity of IMD, EDO, and CO indicates that this channel may be utilized as an access pathway for polar substrates in addition to water or protons. The DI pathway accesses both the Fe2,3,6,7 and Fe3,4,5,7 faces, which are also accessed by the AI and AII pathways.
Figure IV-5. The DI pathway (orange surface). The EDO and IMD molecules bind in the DI pathway/interstitial channel that connects the protein surface to the Fe2,3,6,7 and Fe3,4,5,7 FeMo-cofactor faces (orange surface). The CO and S bind in a channel that extends from the DI pathway (purple su
respectively. Residues lining the pathway are shown in sticks and labelled. The substrates and FeMo-cofactor are displayed as spheres colored by element.
-Ser443 -Tyr446 -Ile231 -Asn98
-Asp520 -Arg97
S CO
IMD & EDO -Tyr100
-Gln513 -Ile101 -Asp516 -Arg28 -Ala514 -His519 -Tyr517 -Asn518 -Tyr99 -Leu24 -Lys21 -Leu16
-Val110 -Phe450 -Thr104
-Arg453 -Arg93
-Lys68 -Thr111 -Ser92 -Gly73 -Tyr98
-Leu521 -Gly69 -Ala94 -Gly95 -Arg105 -Arg96 -His442
-Val522
IV.D.v. Pathway conservation
It is noteworthy that the Av1 and Cp1 Xe binding sites differ, given that Xe is used as an electron dense surrogate for crystallographic analysis of gas binding sites in enzymes.
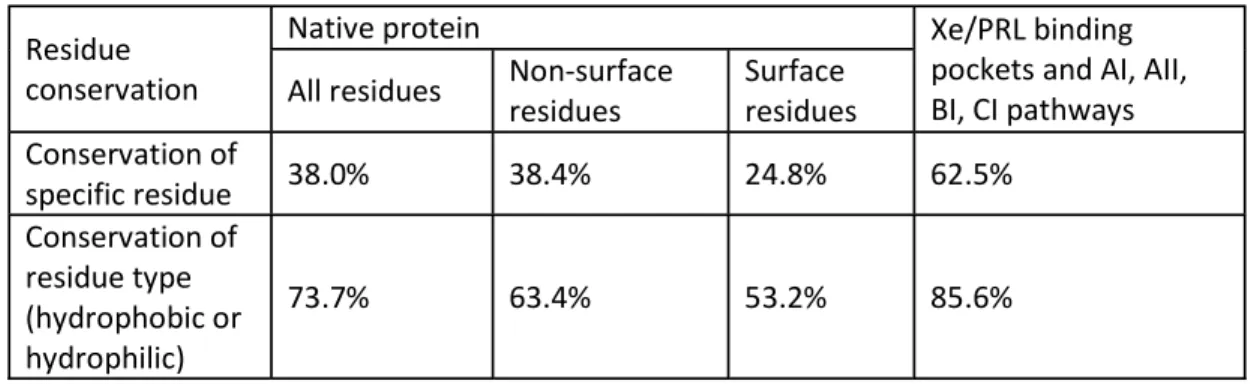
Furthermore, while a diverse set of small molecules have been found to bind to the protein interiors of Cp1, Av1, and Kp1, it is also the case that these binding sites are not identical between the structures. To assess whether the different pathways may be generally relevant to the functioning of nitrogenase or instead primarily reflect the behavior of specific MoFe proteins, the conservations of specific residue and residue type (hydrophobic or hydrophilic) in Av1 and Cp1 were evaluated for (1) all residues in the protein, (2) surface residues, and (3) nonsurface residues (Table IV-S5). This was compared to the conservation of specific residues and residue type for residues lining the substrate binding pockets and proposed pathways (Tables IV-SN SU). The conservation of specific residue for all nonsurface residues compared to that of residues lining the substrate binding pockets and pathways is 38% and 63% respectively, and the conservation of residue type is 63% and 86%, respectively. This shows higher conservation of specific residue and residue type at the substrate pockets and in the proposed pathways, indicating that the AI, AII, BI, and CI pathways may be accessible in Av1 and Cp1. The differences in Xe and another small molecule binding sites in these structures may reflect details of the surrounding residues that alter the thermodynamics of ligand binding, but not necessarily the dynamic accessibility.
IV.D.vi. Comparison to other forms of the MoFe protein
The access pathways were compared to two other forms of the MoFe protein. First, examination of the proposed access pathways in complexes of the MoFe and Fe proteins indicates that the docking of the Fe protein onto the MoFe protein does not block any of the
proposed substrate pathways (Figure IV-S3).28,67 This suggests that binding of the Fe protein may not sterically interfere with substrate access between the protein interior and exterior. This observation is of interest since the Thorneley-Lowe kinetic model assumes that substrates and products can only bind/leave the free MoFe protein.44 Of course, differences in internal structure or protein dynamics could alter the behavior of the MoFe-protein between free and complexed states. Second, an overlay of the FeMo-cofactor-deficient Av1 protein structure shows that the AII pathway partially overlaps with the channel utilized by the FeMo-cofactor to
access its binding pocket (Figure IV-S4).111 -subunit
domains mediating the transfer of the FeMo-cofactor into the active site region of the FeMo- cofactor-less protein may have multiple roles.
IV.D. Conclusion
On the basis of the Xe binding sites, we have identified in Av1 and Cp1, together with small molecule binding sites observed in Av1, Cp1, and Kp1, three new substrate and/or product pathways that can potentially connect the protein surface and the nitrogenase metalloclusters.
The AI and AII pathways, deduced from Xe binding sites, are possible pathways for nonpolar substrates. Notably, the AI pathway is mostly conserved in the previously published pathway based on computational analysis by Seefeldt and co-workers. From the PRL binding site, there is a possible pathway to both the FeMocofactor (pathway BI) and the P-cluster (CI), the latter of which may provide a pathway for proton access. Both pathways contain part of the center water channel and then extend into the protein scaffold toward the metalloclusters. Given the polarity of the small molecules and the binding pocket environment, the BI and CI pathways may facilitate metallocluster access for both polar and nonpolar substrates/ products. IMD, EDO, CO, and S sites in Av1 and Kp1 suggest that the DI pathway/interstitial channel may be used as a
polar substrate pathway; it is conserved in all MoFe proteins. All pathways access the Fe2,3,6,7 and/or Fe3,4,5,7 faces of the FeMo-cofactor; however, this does not necessarily indicate that these faces are the primary targets for substrate binding since substrates may be able to move around the FeMo-cofactor. Overall, our studies establish that a variety of small molecules can access the interior of the MoFe-protein through multiple pathways (see the movie in the Supporting Information). This is based on experimental identification of nonwater, small molecule binding sites in the interior of Av1 and Cp1, which are two of the most structurally divergent bacterial MoFe proteins known. While there may be more favored pathways, given the variety of potential routes available, these observations indicate that there is unlikely to be a unique pathway utilized for substrate access from the protein surface to the active site; in effect, this is a molecular-level exampl
IV.E. Experimental
IV.C.i. Cell growth and protein purification
Av1 and Cp1 protein were obtained using cell growth and protein purification procedures previously described.64,73
IV.C.ii. Crystallization
Crystals were grown in 24-well plates using the sitting-drop method at room temperature in an anaerobic chamber with an atmosphere of 95% argon and 5% hydrogen.
All crystallization solutions were purged with argon prior to use. Av1 crystals were obtained as described previously.73 For Cp1, the reservoir and crystallization solutions consisted of double- distilled water, 23% polyethylene glycol (MW 3350 g/mol, Hampton Research), 0.2 M lithium
citrate (Aldrich), and 5 mM sodium dithionite (J.T. Baker). Several crystals of hexagonal and block morphology formed after 2 days, but only the block crystals diffracted well.
IV.C.iii. Xenon pressurization (expanded from published article)
Crystals were grown inside an anaerobic chamber as described above. Working with one well at a time, the tape covering the well was cut and removed. 100
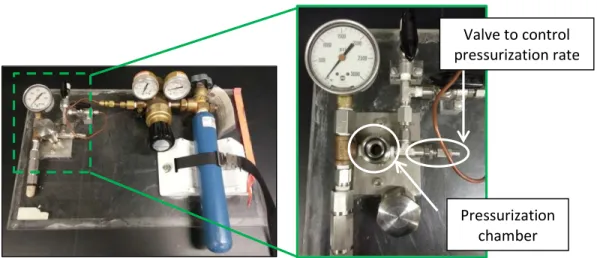
was transferred to an Eppendorf tube. A thin film on top of the crystallization drop was removed with a needle. 2-3 drops of the Fomblin Y mineral oil (cryo-protectant, Sigma-Aldrich) was added to the top of the crystallization drop. The well was re-sealed with tape, and the tray was removed from the tent. A gas pressurization device was made by Michael Stowell.112 On the pressurization device (Figure IV-6), a small wad of Kim wipe was placed at the bottom of the pressurization chamber and was soaked with a couple drops of the reservoir solution from the Eppendorf tube. This is necessary to maintain a relatively constant vapor pressure during the pressurization process.
Figure IV-6. Homemade gas pressurization device.112
Pressurization chamber Valve to control pressurization rate
The sealing tape covering the well was cut and removed. Using a microscope, the crystal was collected on a nylon loop. The crystal was slowly lifted through the cryo-protectant layer of the drop and then very quickly moved to the pressurization chamber of the pressurization device. While lightly venting Xe (Matheson) through the device, the cap to the pressurization chamber was tightened. This process must be done carefully to ensure that all oxygen is forced out of the device without increasing the pressure too quickly, which causes the crystal to crack or become lost from the loop. After fully closing the device to the atmosphere, the pressure was increased to 14 atm over approximately six seconds. The device stood undisturbed for 10-15 minutes after which the pressure in the chamber was slowly released. Here also the pressure change must be done slowly to avoid losing or cracking the crystal. Once the pressure was equilibrated to atmospheric pressure, the crystal was very quickly transferred to liquid nitrogen for storage.
IV.C.iv. Data collection and refinement
Diffraction data for Cp1-Xe was collected remotely from the Stanford Synchrotron Radiation Lightsource (SSRL) on beamline 12-2 with a DECTRIS Pilatus 6 M detector. Reference sets of 1440 diffraction images were collected at 12999.97 eV with an oscillation angle of 0.25°
over 360° rotation. To confirm the identity of the Xe sites, diffraction data were also collected at 6690.11 eV using the same strategy. Although well above the Ledge, Xe exhibits significant -Xe was collected in-house on a Rigaku MicroMax 007-HF X-ray generator with a Rigaku RAXIS-IV++
detector. All data sets were integrated with the XDS program package.57 Scaling was carried out with the CCP4 suite,58 and phasing was determined by molecular replacement against Av1 (PDB ID 3U7Q) and Cp1 (4WES).22,64 Initial refinement was carried out with CNS,59 and alternative
conformations and isotropic B-factors were refined with REFMAC5.60,61 Simulated annealing was performed using PHENIX.62
IV.C.v. Determination of small molecule binding sites
The presence and occupancy of each Xe site were evaluated by examination of electron density maps, anomalous difference Fourier peaks, and the B-factor of Xe and the surrounding residues (Table IV-2). Electron density and anomalous difference maps are shown for each Xe binding site in Figure IV-S1.
Nonprotein electron density was evident in the Cp1-Xe structure that was modeled as a proline ligand (PRL, Figure IV-S2). We propose PRL for use in the model because it nicely fits the observed electron density; however, the actual identity and origin of this species are not conclusively known. It is unlikely that the electron density represents ill-defined water molecules because neighboring water molecules are well-
would be needed to accurately model the observed electron and difference density, which is more than the space can accommodate. Furthermore, the ring of PRL could favorably interact with the five neighboring aromatic side chains in this binding pocket.113,114 Finally, the acid group - -Glu323 via hydrogen bonding. While we will refer to the species throughout the manuscript as PRL (to distinguish it from proline in the peptide chain), we cannot unambiguously identify the species at this site. As it is clearly a nonwater ligand, however, we include it in the present analysis.
IV.C.vi. Pathway calculations and display
Pathways were calculated using the software CAVER.108 Coordinates of the small molecules were provided as the starting point for pathway calculations. CAVER calculates
pathways from the grid point closest to the provided coordinates, so some starting points are slightly offset from the Xe atoms. The probe radius, shell radius, and shell depth were set to 0.5, 4, and 5 Å, respectively. For each small molecule, two pathways were selected: one from the protein surface to the small molecule binding site and the other from the binding site to a cofactor. For any given starting point, many pathways exist; however, the most probable pathways are those with the shortest length and largest width, and are prioritized by CAVER.
Pathways are displayed throughout the manuscript as surfaces generated in PyMOL.63
IV.F. Accession codes
Accession Codes The structural model and structure factors have been deposited with the Protein Data Bank. The PDB ID for the Av1-Xe and Cp1-Xe structures are 4WNA and 4WN9, respectively.
IV.G. Acknowledgments
We acknowledge the Gordon and Betty Moore Foundation, the Beckman Institute, and the Sanofi-Aventis Bioengineering Research Program at Caltech for their generous support of the Molecular Observatory at Caltech. We thank the staff at Beamline 12-2, Stanford Synchrotron Radiation Lightsource (SSRL), operated for the DOE and supported by its OBER and by the NIH, NIGMS (P41GM103393), and the NCRR (P41RR001209). We thank Jens Kaiser and James Howard for helpful discussions as well as Thomas Spatzal for discussions and his assistance with the xenon pressurization.
IV.H. Abbreviations
Cp, Clostridium pasteurianum; Av, Azotobacter vinelandii; Kp, Klebsiella pneumonia;
IMD, imidazole; EDO, 1,2-ethanediol; MPD, 2-methyl-2,4-pentanediol; PRL, proline (ligand)
IV.I. Supporting information IV.I.i. Movie
A movie is accessible, free of charge, at
http://pubs.acs.org/doi/suppl/10.1021/bi501313k. In this movie, the MoFe protein is rotated around the vertical axis to show the location of all pathways discussed in the manuscript, including newly identified and previously published pathways (blue: AI/IS pathway; magenta: AII pathway; forest green: BI pathway; green: CI pathway; orange: DI pathway/interstitial water channel; brown: center water channel; yellow: ammonia egress pathway; red: molecular dynamics pathway). The subunits of the protein are shown as green and magenta ribbon, and the subunits are shown in cyan and yellow ribbon. One FeMo-cofactor and P-cluster are shown as ball and sticks colored by element (yellow: sulfur; orange: iron; cyan: molybdenum;
red: oxygen; grey: carbon). The two black Fe atoms in the FeMo-cofactor are Fe2 and Fe6, which bind the reversible inhibitor, carbon monoxide, in a bridging fashion. The three large black spheres are Xe binding sites in Av1 and Cp1. For clarity, the pathways, cofactors, and Xe binding sites are only displayed in one -subunit of the protein. The protein scaffold is that of Av1 (PDB ID 4WNA) onto which the Cp1 pathways and Xe binding site have been superposed. The movie was made in PyMOL.
IV.I.ii. Tables
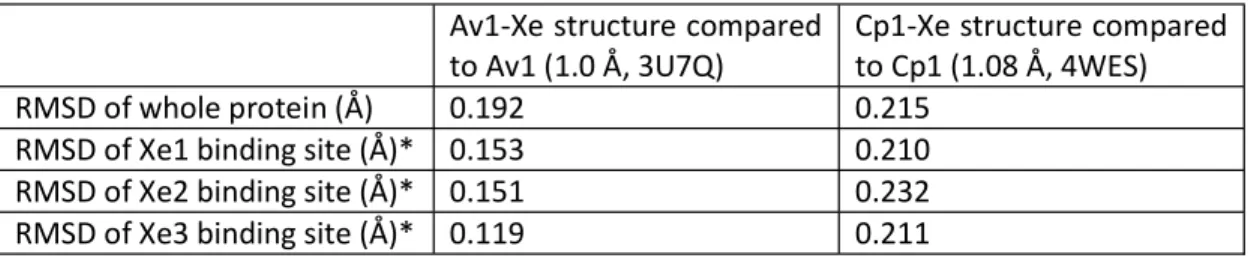
Table IV-S1. RMSD of MoFe protein Xe binding pockets compared to native structures Av1-Xe structure compared
to Av1 (1.0 Å, 3U7Q) Cp1-Xe structure compared to Cp1 (1.08 Å, 4WES)
RMSD of whole protein (Å) 0.192 0.215
RMSD of Xe1 binding site (Å)* 0.153 0.210
RMSD of Xe2 binding site (Å)* 0.151 0.232
RMSD of Xe3 binding site (Å)* 0.119 0.211
* Residues within 6 Å of the Xe site were used in the RMSD calculations.
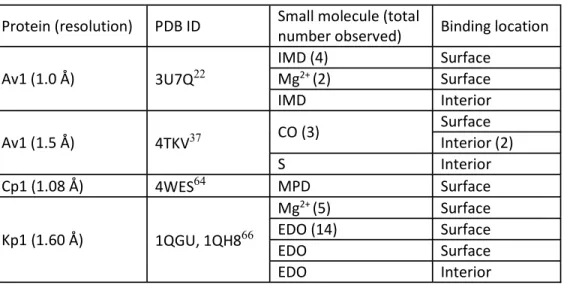
Table IV-S2. Small molecules and ions in published MoFe protein structures Protein (resolution) PDB ID Small molecule (total
number observed) Binding location Av1 (1.0 Å) 3U7Q22
IMD (4) Surface
Mg2+ (2) Surface
IMD Interior
Av1 (1.5 Å) 4TKV37 CO (3) Surface
Interior (2)
S Interior
Cp1 (1.08 Å) 4WES64 MPD Surface
Kp1 (1.60 Å) 1QGU, 1QH866
Mg2+ (5) Surface
EDO (14) Surface
EDO Surface
EDO Interior
Table IV-S3. Residues involved in proposed pathways from previous and current studies Pathway
target Pathway Residues lining pathway (Av1 numbering)
FeMo- cofactor
AI Val70, Val71, Trp72, Ile75, His195, His196, Asn199, Asp200, Val202, Arg203, Tyr229, Trp253, Ser254, Cys275, Ser278, Met279, Tyr281, Ile282
AII
Ile59, Tyr354, Ile355, Glu380, Gly422, Ser423, Gly424, Lys426, Glu427, Arg439, Glu440, Met441, His442, Asp445, Ser447, Tyr450, Phe459, Asp462, Met463
Thr360
BI
Ala65, Gly66, Gly69, Val70, Gln90, Tyr91, Ser92, Arg93, Ala94, Gly95, Arg96, Gln191, His195 Ala67, Lys68, Ala69, Leu67, Tyr102, Arg105, His106, Phe107, His193, Phe230, Thr232, Gly368, Asp369, Phe372, Asn445, Tyr447, Gly470, Phe471, Pro472, Phe474, Thr484
P-
cluster CI
Gly61, Cys62, Tyr64, Ala65, Gln90, Tyr91, Ser92
Ala67, Lys68, Ala69, Leu77, Gly94, Ala97, Tyr98, Ser100, Tyr102, Arg105, His106, Phe107, His193, Phe230, Glu231, Gly368, Asp369, Phe372, Asn445, Tyr447, Gly470, Phe471, Pro472, Phe474, Thr484
FeMo- cofactor
Interstitial water
channel104/DI
Lys68, Gly69, Gly73, Ser92, Arg93, Ala94, Gly95, Arg96, Arg97, Asn98, Tyr99, Tyr100, Ile101, Thr104, Val110, Thr111, Ile231, His442, Ser443, Tyr446
Leu16, Lys21, Leu24, Arg28, Tyr98, Arg105, Phe450, Arg453 Gln513, Ala514, Asp516, Tyr517, Asn518, His519, Asp520, Leu521, Val522 IS Val70, Val71, Trp72, Ile75, Met78, Arg96, Val179, His195, Val202, Trp205, Lys209, Tyr229, Trp253, Ile262, Glu263, Met279 NH3 egress102 Gln53, Met57, Thr58, Ile59, Arg60, Ala65, Gln191, Glu380, Asp403, Lys426
Gln93, Gly94, Ser115, Ser117 MD
simulation101
Asn49, Gly66, Val70, Ser190, Gln191, Ser192, Leu193, His195, His196, Asn199, Arg277, Ser278, Met279, Asn280, Tyr281, Gly357, Phe381, Ala382, His383
Table IV-S4. IMD, CO, S, and EDO binding sites in Av1 and Kp1 Crystal
(PDB ID) Site Displaced species in
native protein Occupancy (%) Distance*to (Å) FeMo-
cofactor surface
Av1 (3U7Q) IMD HOH 100 11.5 11.6
Av1 (4TKV) CO HOH 60% 17.0 8.7
Av1 (4TKV) S Empty pocket 100% 19.0 10.9
Kp1 (1QGU) EDO HOH 100 11.6 10.1
* Distances were measured from the closest substrate atom to the closest metal in the FeMo- cofactor or to the closest non-solvent atom on the protein surface.
Table IV-S5. Conservation of specific residues and residue type in Av1 and Cp1 Residue
conservation
Native protein Xe/PRL binding
pockets and AI, AII, BI, CI pathways All residues Non-surface
residues Surface residues Conservation of
specific residue 38.0% 38.4% 24.8% 62.5%
Conservation of residue type (hydrophobic or hydrophilic)
73.7% 63.4% 53.2% 85.6%
Table IV-S6. Close contacts and residue conservation for Av1-Xe1 (protein interior) Residue Atom Distance from Xe (Å) Corresponding residue in Cp1
1 -Val71 CG1 3.88 -Val60
2 -Trp72 CE3 4.48 -Met61
3 -Ile75 CD1 3.29 -Ile64
4 -Ala198 O 5.95 -Ala187
5 -Val202 CG2 3.59 -Val191
6 -Trp253 CE3 4.34 -Leu238
7 -Ser254 CB 4.31 -Thr239
8 -Ile262 CD1 4.59 -Val247
9 -Met279 CE 4.49 -Ile264
Hydrophobic residues: 89%
Conservation of specific residue: 44%
Conservation of residue type*: 100%
* Residues are categorized as hydrophilic or hydrophobic
Table IV-S7. Close contacts and residue conservation for Av1-Xe2 (protein surface)
Residue Atom Distance from Xe (Å) Corresponding residue in Cp1
1 -His196 CD2 5.20 -His185
2 -Asn199 O 3.98 -Asn188
3 -Asp200 OD1 3.08 -Asn189
4 -Arg203 NE 4.17 -Met192
5 -Tyr281 O 3.67 -Tyr266
6 -Ile282 CD1 3.87 -Ile267
7 -His285 CB 4.18 -Met270
Hydrophobic residues: 29%
Conservation of specific residue: 57%
Conservation of residue type*: 71%
* Residues are categorized as hydrophilic or hydrophobic
Table IV-S8. Close contacts and residue conservation for Av1-Xe3 (protein surface)
Residue Atom Distance from Xe (Å) Corresponding residue in Cp1
1 -Tyr233 OH 5.24 -Gly180
2 -Arg468 O 5.61 -Arg408
3 -Ile469 CD1 4.36 -Phe409
4 -Ser482 CB 4.50 -Asn422
5 -Thr483 C 4.81 -Pro423
6 -Thr484 O 3.92 -Lys424
7 -Gly489 O 5.10 -Gly429
8 -Gln492 CB 4.19 -Arg432
9 -Ile493 CG1 3.83 -Leu433
10 -Thr496 OG1 4.44 -Glu436
Hydrophobic residues: 40%
Conservation of specific residue: 20%
Conservation of residue type*: 90%
* Residues are categorized as hydrophilic or hydrophobic
Table IV-S9. Close contacts and residue conservation for Cp1-Xe1 (protein surface)
Residue Atom Distance from Xe (Å) Corresponding residue in Av1
1 -Asp107 OD2 5.84 -Asp117
2 -Lys120 CE 5.99 -Lys130
3 -Glu127 OE1 5.40 -Glu137
4 -Arg12 O 3.81 -Arg59
5 -Lys13 C 4.11 -Glu60
6 -Ala14 N 3.93 -Ala61
7 -Leu15 O 3.51 -Leu62
8 -Arg16 NH1 3.73 -Thr63
9 -Ile17 N 5.81 -Val64
10 -Glu371 O 5.84 -Gly424
11 -Asp373 OD2 5.09 -Asp426
Hydrophobic residues: 27%
Conservation of specific residue: 64%
Conservation of residue type*: 91%
* Residues are categorized as hydrophilic or hydrophobic
Table IV-S10. Close contacts and residue conservation for Cp1-Xe2 (protein surface) Residue Atom Distance from Xe (Å) Corresponding residue in Av1
1 -Asp254 O 3.57 -Lys269
2 -Leu255 CB 4.30 -Leu270
3 -Pro278 CG 5.41 -Pro293
4 -Cys300 O 3.38 -Lys315
5 -Phe301 CZ 3.84 -Phe316
6 -Val406 CG1 3.90 n/a
7 -Ile407 CD1 4.18 n/a
Hydrophobic residues: 71%
Conservation of specific residue: 43%
Conservation of residue type*: 80%
* Residues are categorized as hydrophilic or hydrophobic
Table IV-S11. Close contacts and residue conservation for Cp1-Xe3 (protein interior)
Residue Atom Distance from Xe (Å) Corresponding residue in Av1
1 -Phe460 CE1 4.63 -Gly422
2 -Lys477 CG 3.95 -Arg439
3 -Leu479 CD2 5.55 -Met441
4 -Asp483 OD2 5.94 -Asp445
5 -Tyr488 OH 3.61 -Tyr450
6 -Asn496 O 5.39 -Ile458
7 -Phe497 CD1 3.29 -Phe459
8 -Gly498 N 5.37 -Ala460
9 -Glu500 CB 3.83 -Asp462
10 -Leu501 N 3.71 -Met463
Hydrophobic residues: 60%
Conservation of specific residue: 30%
Conservation of residue type*: 90%
* Residues are categorized as hydrophilic or hydrophobic
Table IV-S12. Close contacts for Cp1-PRL
Residue Atom Distance from ligand (Å) Corresponding residue in Av1
1 -Tyr30 CZ 3.7 -Leu77
2 -His59 NE2 3.7 -His106
3 -Phe60 CZ 3.8 -Phe107
4 -Phe178 CE2 3.4 -Phe230
5 -Val179 CA 3.5 -Glu231
6 -Gly180 C3 3.4 -Thr232
7 -Asp183 OD2 4.1 -Asn236
8 -Glu323 OE2 3.0 -Phe375
9 -Gly410 O 3.8 -Gly470
10 -Phe411 C1 3.8 -Phe471
11 -Lys424 NZ 2.7 -Thr424
Conservation of specific residue: 46%
Conservation of residue type*: 73%
* Residues are categorized as hydrophilic or hydrophobic
Table IV-S13. Close contacts for Av1-IMD
Residue Atom Distance from ligand (Å) Corresponding residue in Cp1
1 -Ala94 O 4.1 -Gly85
2 -Gly95 N 5.2 -Gly86
3 -Arg96 O 3.1 -Arg87
4 -Arg97 CA 3.9 -Arg88
5 -Asn98 ND2 3.9 -Phe89
6 -Tyr99 CE1 3.3 -Lys90
7 -Tyr100 CE2 4.2 -Pro91
8 -Val110 CG1 4.2 -Asn102
9 -Thr111 CG2 3.9 -Glu103
10 -Asp516 O 5.7 -Glu451
11 -Tyr517 C5 4.1 -Glu452
12 -Asn518 N 6.0 -Asp453
13 -His519 C 5.4 -Phe454
14 -Asp520 OD1 3.7 -Glu455
15 -Leu521 N 4.9 -Val456
Conservation of specific residue: 20%
Conservation of residue type*: 60%
* Residues are categorized as hydrophilic or hydrophobic
Table IV-S14. Residues lining the AI pathway in Av1 and Cp1
AI pathway in Av1 AI pathway in Cp1
-Val70 -Val59
-Val71 -Val60
-Trp72 -Met61
-Ile75 -Ile64
-His195 -His184
-His196 -His185
-Asn199 -Asn188
-Asp200 -Asn189
-Val202 -Val191
-Arg203 -Met192
-Tyr229 -Tyr214
-Trp253 -Leu238
-Ser254 -Thr239
-Cys275 -Cys260
-Ser278 -Ser263
-Met279 -Ile264
-Tyr281 -Tyr266
-Ile282 -Ile267
Conservation of specific residue: 67%
Conservation of residue type*: 94%
* Residues are categorized as hydrophilic or hydrophobic
Table IV-S15. Residues lining the AII pathway in Cp1 and Av1
AII pathway in Av1 AII pathway in Cp1
-Ile59 -Ala48
-Tyr354 -Tyr340
-Ile355 -Val341
-Glu380 -Glu366
-Gly422 -Phe460
-Ser423 -Ala461
-Gly424 -Gly462
-Lys426 -Lys464
-Glu427 -Glu465
-Arg439 -Lys477
-Glu440 -Gln478
-Met441 -Leu479
-His442 -His480
-Asp445 -Asp483
-Ser447 -Asn485
-Tyr450 -Tyr488
-Phe459 -Phe497
-Asp462 -Glu500
-Met463 -Leu501
-Thr360 -Gln308
Conservation of specific residue: 45%
Conservation of residue type*: 90%
* Residues are categorized as hydrophilic or hydrophobic
Table IV-S16. Residues lining the BI pathway in Cp1 and Av1
BI pathway in Av1 BI pathway in Cp1
-Ala65 -Ala54
-Gly66 -Gly55
-Gly69 -Gly58
-Val70 -Val59
-Gln90 -Phe79
-Tyr91 -Tyr80
-Ser92 -Thr81
-Arg93 -Trp82
-Ala94 -Gly83
-Gly95 -Gly84
-Arg96 -Arg85
-Gln191 -Gln180
-His195 -His184
-Ala67 -Ala20
-Lys68 -Lys21
-Ala69 -Thr22
-Leu67 -Tyr30
-Tyr102 -Val55
-Arg105 -Arg58
-His106 -His59
-Phe107 -Phe60
-His193 -His146
-Phe230 -Phe178
-Thr232 -Val179
-Gly368 -Gly319
-Asp369 -Asp320
-Phe372 -Glu323
-Asn445 -Asn392
-Tyr447 -Tyr394
-Gly470 -Gly410
-Phe471 -Phe411
-Pro472 -Pro412
-Phe474 -Met414
-Thr484 -Lys424
Conservation of specific residue: 68%
Conservation of residue type*: 82%
* Residues are categorized as hydrophilic or hydrophobic
Table IV-S17. Residues lining the CI pathway in Cp1 and Av1
CI pathway in Av1 CI pathway in Cp1
-Gly61 -Gly50
-Cys62 -Cys51
-Tyr64 -Tyr53
-Ala65 -Ala54
-Gln90 -Phe79
-Tyr91 -Tyr80
-Ser92 -Thr82
-Ala67 -Ala20
-Lys68 -Lys21
-Ala69 -Thr22
-Leu77 -Tyr30
-Gly94 -Gly47
-Ala97 -Ser50
-Tyr98 -Tyr51
-Ser100 -Thr54
-Tyr102 -Val55
-Arg105 -Arg58
-His106 -His59
-Phe107 -Phe60
-His193 -His146
-Phe230 -Phe178
-Glu231 -Val179
-Gly368 -Gly319
-Asp369 -Asp320
-Phe372 -Glu323
-Asn445 -Asn392
-Tyr447 -Tyr394
-Gly470 -Gly410
-Phe471 -Phe411
-Pro472 -Pro412
-Phe474 -Met414
-Thr484 -Lys424
Conservation of specific residue: 66%
Conservation of residue type*: 81%
* Residues are categorized as hydrophilic or hydrophobic
Table IV-S18. Residues lining the DI pathway/interstitial water channel in Cp1 and Av1 DI pathway in Av1 DI pathway in Cp1
-Lys68 -Lys57
-Gly69 -Gly58
-Gly73 -Gly62
-Ser92 -Thr81
-Arg93 -Trp82
-Arg96 -Arg85
-Arg97 -Arg86
-Asn98 -Ser89
-Tyr99 -Lys90
-Tyr100 -Pro91
-Ile101 -Glu92
-Thr104 -Thr95
-Val110 -Asn100
-Thr111 -Glu101
-Ile231 -Ile216
-His442 -His480
-Ser443 -Ser481
-Tyr446 -Tyr482
-Leu16 n/a
-Lys21 n/a
-Leu24 n/a
-Arg28 n/a
-Tyr98 -Tyr50
-Arg105 -Arg57
-Phe450 -Phe397
-Arg453 -Arg400
-Gln513 n/a
-Ala514 -Cys449
-Asp516 -Glu451
-Tyr517 -Glu452
-Asn518 -Asp453
-His519 -Phe454
-Asp520 -Glu455
-Leu521 -Val456
-Val522 -Val457
Conservation of specific residue: 50%
Conservation of residue type*: 87%
* Residues are categorized as hydrophilic or hydrophobic
Table IV-S19. Residues lining the IS pathway in Av1 and Cp1
IS pathway in Av1 IS pathway in Cp1
-Val70 -Val59
-Val71 -Val60
-Trp72 -Met61
-Ile75 -Ile64
-Met78 -Met67
-Arg96 -Arg85
-Val179 -His168
-His195 -His184
-Val202 -Val191
-Trp205 -Glu194
-Lys209 -Lys198
-Tyr229 -Tyr214
-Trp253 -Leu238
-Ile262 -Val247
-Glu263 -Gln248
-Met279 -Ile264
Conservation of specific residue: 56%
Conservation of residue type*: 94%
* Residues are categorized as hydrophilic or hydrophobic
Table IV-S20. Residues lining D 3 egress pathway in Av1 and Cp1102 NH3 egress pathway in Av1 NH3 egress pathway in Cp1
-Gln53 -Val42
-Met57 -Ile46
-Thr58 -Thr47
-Ile59 -Ala48
-Arg60 -Arg49
-Ala65 -Ala54
-Gln191 -Gln180
-Glu380 -Glu366
-Asp403 -Asp441
-Lys426 -Lys464
-Gln93 -Gln46
-Gly94 -Gly47
-Ser115 -Thr68
-Ser117 -Ser70
Conservation of specific residue: 71%
Conservation of residue type*: 93%
* Residues are categorized as hydrophilic or hydrophobic
Table IV-S21. Residues l molecular dynamics pathway in Cp1 and Av1101 MD pathway in Av1 MD pathway in Cp1
-Asn49 -Asn38
-Gly66 -Gly55
-Val70 -Val59
-Ser190 -Ser179
-Gln191 -Gln180
-Ser192 -Ser181
-Leu193 -Ala182
-His195 -His184
-His196 -His185
-Asn199 -Asn188
-Arg277 -Arg262
-Ser278 -Ser263
-Met279 -Ile264
-Asn280 -Asn265
-Tyr281 -Tyr268
-Gly357 -Gly343
-Phe381 -Phe367
-Ala382 -Ala368
-His383 -His369
Conservation of specific residue: 90%
Conservation of residue type*: 100%
* Residues are categorized as hydrophilic or hydrophobic
IV.I.iii. Figures
Figure IV-S1. Electron density maps (blue mesh) and anomalous difference maps (orange mesh) for each Xe binding site, including noncrystallographically-related pairs, and their surrounding closer to the Xe atom are shown in sticks. Note that the electron density for Cp1-Xe3 is not
Av1-Xe1 and -Xe2
Av1-Xe3
Cp1-Xe1 Cp1-Xe2
Cp1-Xe3
Figure IV-S2. PRL binding site with the neighboring residues in sticks. The PRL molecule is shown with spheres and sticks and is colored by element. The electron density of the PRL and nearby - -Glu323 are given. Note the well-defined electron density of the water molecules. See Experimental section of the main text for further discussion.
-Glu323 H-bond: 3.2 Å
-Lys424 H-bond: 2.7 Å -Phe178
-Tyr30
-Phe411 -His59 -Phe60
Figure IV-S3. Overlays of four different Av1-Av2 complexes: ADP·AlF4- stabilized Av1-Av2 (PDB ID 1M34, red cartoon), nucleotide-free Av1-Av2 (PDB ID 2AFH, blue cartoon), MgAMPPCP-bound Av1-Av2 (PDB ID 2AFK, forest green cartoon), and MgADP-bound Av1-Av2 (PDB ID 2AFI, orange cartoon). The docking of the Fe protein does not block any of the proposed substrate pathways.28,67
Figure IV-S4. Overlay of the molecular surface of the FeMo-cofactor-deficient Av1 protein (wheat surface, PDB ID 1L5H).111 The channel used for transportation of the FeMo-cofactor is visible as the hole in the wheat surface that connects the protein surface to the location of the
FeMo- -subunit of the Av1-
Xe structure, and the other colored surfaces belong to the substrate access pathways. Three are visible: the AI (blue surface), AII (magenta surface), and NH3 egress (yellow surface) pathways.
Part of the AII pathway overlaps with the FeMo-cofactor insertion pathway.
Different orientations of Fe protein