Max Murialdo was tireless in helping with measurements during the last part of this thesis work, and the amount of data that contributed to the quality of the final results is largely due to his efforts. A volumetric Sieverts apparatus was designed, constructed, and commissioned to accurately measure adsorption uptake at high pressures, and an appropriate thermodynamic treatment of the experimental data is presented.
Nomenclature
Chapter 1 Mobile Energy
- Introduction
- Hydrogen and Energy
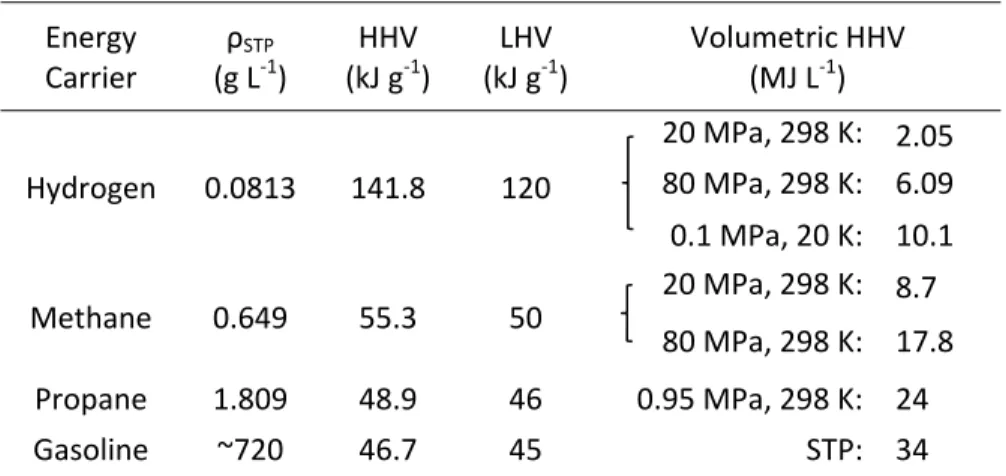
- Hydrogen Storage
Experiments with hydrogen and coal gas vehicles continued until about World War II, when they were almost universally discarded in favor of the much denser energy available in liquid petroleum. Liquid hydrogen-liquid oxygen mixtures became the main propellant in chemical rocket engines from the 1960s onwards and are still used today. a) The Echo Mountain House and Mount hydrogen storage container are shown in the red box. On the left, approximately 6 cubic meters of coal gas is being towed in a trailer to be used in the vehicle's internal combustion engine.
Chapter 2
Physical Adsorption
Van der Waals Forces
- Intermolecular Potentials
- Dispersion Forces
- Modern Theory of Physical Adsorption
Nevertheless, the sum of the attractive and repulsive forces between atoms or molecules is now collectively referred to as "van der Waals forces." Strength. In his time, the range of van der Waals' attractive interaction was predicted to be of molecular scale, but the shape of the potential as a function of distance, U(r), was unknown.
Gas‐Solid Adsorption Models
- Monolayer Adsorption
- Multilayer Adsorption
- Gibbs Surface Excess
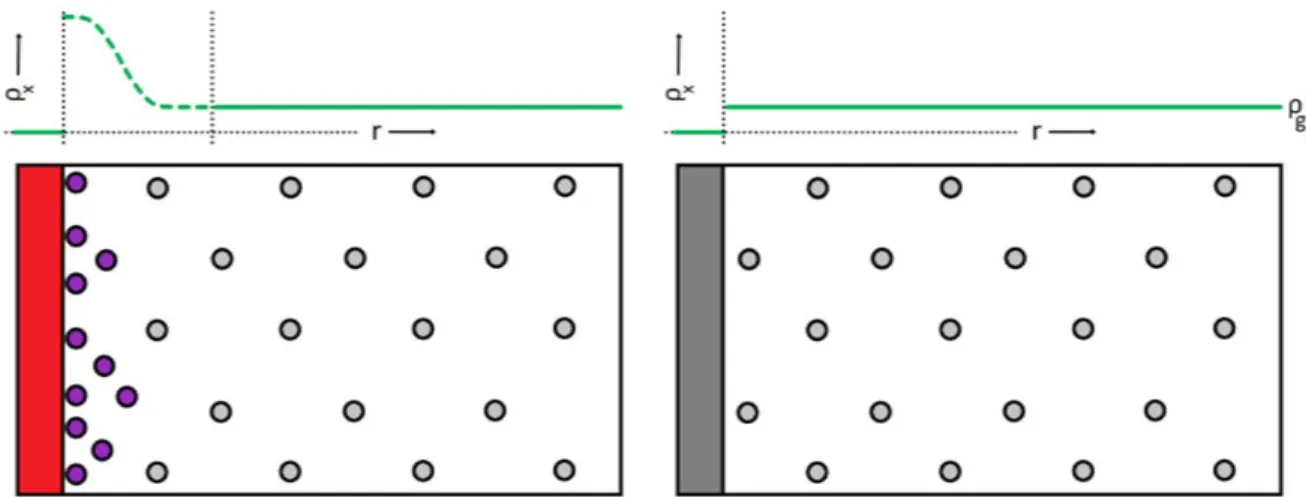
The reason for the discrepancy can be traced to the finite volume of the adsorbed phase, shown in Figure 2.3. The bulk gas density (gray) is a function of the pressure, and is depicted as a regular pattern for clarity.
Adsorption Thermodynamics .1 Gibbs Free Energy
- Enthalpy of Adsorption
The specific volume of the free gas is usually much greater than that of the adsorbed gas. To simplify further, we need to specify the bulk gas phase equation of state.
Thermodynamic Calculations from Experimental Data
- Ideal Gas Assumption
- Isoexcess Assumption
- Calculations Without Fitting
- Linear Interpolation
- Virial Type Fitting Equation
- Generalized‐Langmuir Fitting Equation
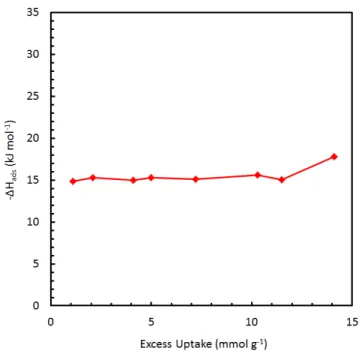
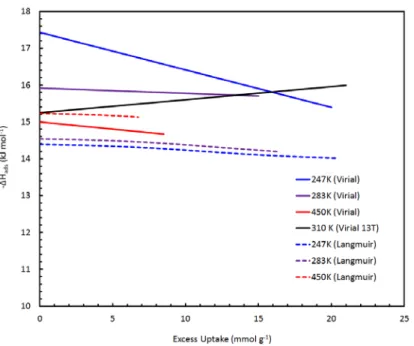
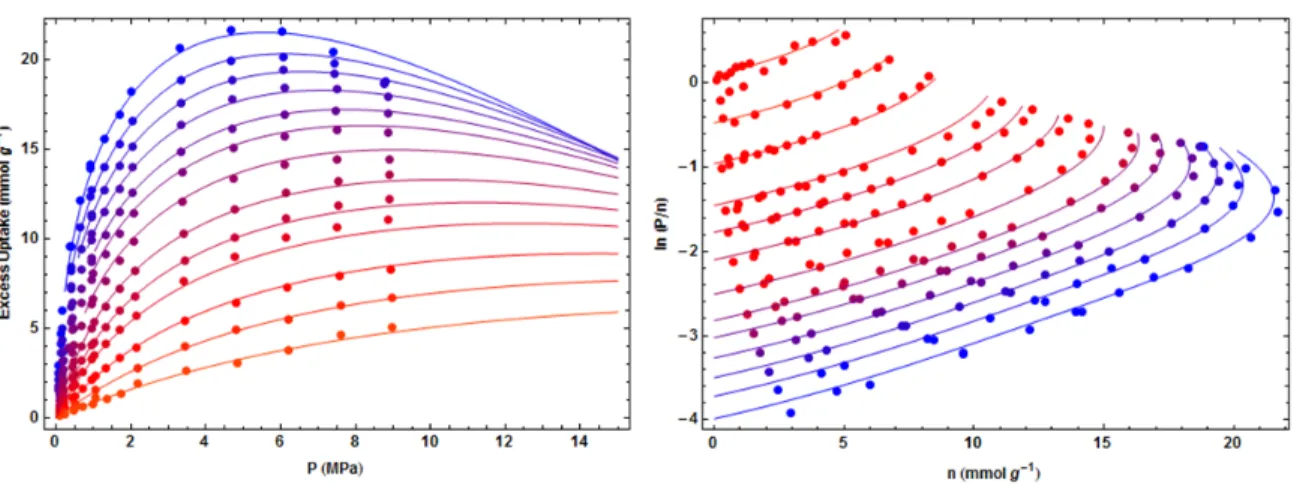
This approach can therefore be effective in approximating the "Henry's law" value of the isosteric enthalpy of adsorption. Linear interpolation of the experimental (excess) uptake data of methane on MSC-30 (top), and the corresponding van't Hoff plot showing the relative linearity of the data. The fits of selected data give values of the Henry's law enthalpy in the range of 13.5‐.
Generalized‐Langmuir High‐Pressure Adsorption Model
Due to the dependence of the density of an ideal gas on the pressure, the enthalpy reaches a plateau at high uptake values. For methane adsorption on MSC-30 in this study, the usual approximation that treats the volume of the adsorbed phase as negligible compared to the volume of the gas phase is valid in the low pressure limit, but becomes invalid above 1 MPa. For our methane data on the MSC-30, it is the difference between the molar volume of the gas and the adsorbed.
Conclusions
In both the iso-excess and absolute results, the enthalpy of adsorption showed physically justifiable characteristics and gave the Henry's law value closest to that for a model-free analysis of low-pressure data. All the simplifying approximations within the derivation of the isosteric enthalpy of adsorption were found to be extremely limited in validity for methane adsorption within a near-ambient pressure and temperature range. Therefore, the real gas equation of state data should be used, and a simple finite molar volume approximation of the adsorbed phase was proposed.
A double-Langmuir-type equation with a built-in definition of Gibbs surface excess was a suitable equation for methane uptake on MSC-30 in the model-independent case and could also be used as a model to determine the absolute amount of adsorption and to perform a true isosteric enthalpy analysis. Yoon, 'Thermodynamic trends in the uptake capacity of porous adsorbents on methane and hydrogen', Appl.
Chapter 3
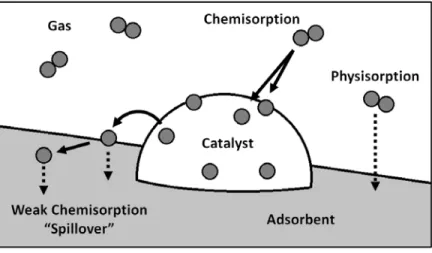
Hydrogen Spillover in Platinum‐Doped Superactivated Carbon
- Overview
- Materials Processing and Synthesis .1 MSC‐30 and AX‐21
- Synthesis Methods
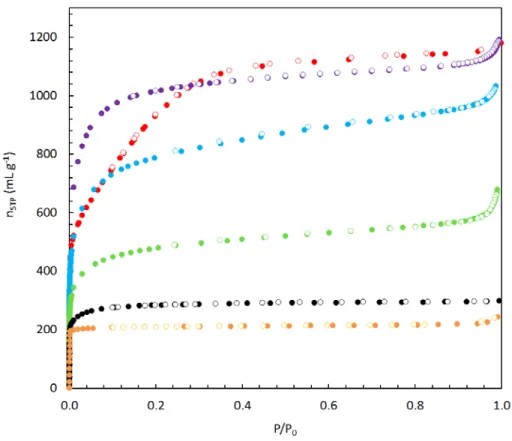
- Materials Characterization .1 Nitrogen Adsorption
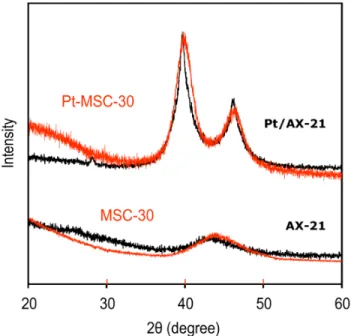
- X‐Ray Diffraction
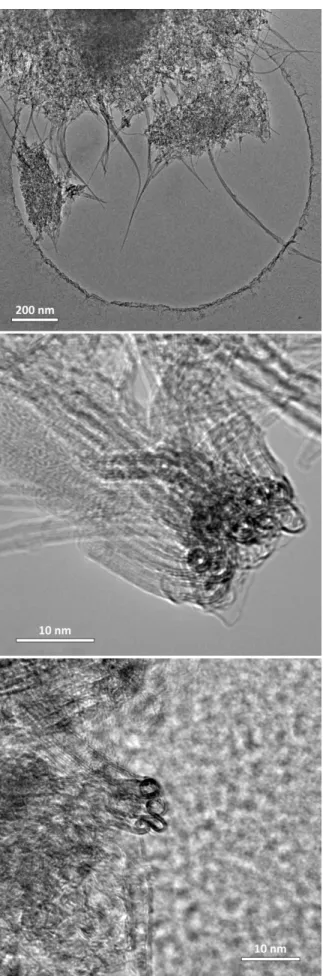
- Transmission Electron Microscopy
- Hydrogen Sorption .1 Experimental Methods
- Long‐Duration Experiments
- Hydrogen Cycling
- Discussion
- Conclusions
- References
- Chapter 4
Hydrogen uptake isotherms of samples containing platinum (Pt-MSC-30) were measured at room temperature (296 K), where overflow is expected. Hydrogen uptake isotherms were measured for MSC-30 and Pt-MSC-30 at room temperature, varying the sample size from 0.2 to 3.4 g. Also, the slope of the isotherm in Pt-MSC-30 slowly decreases at pressures above 2 MPa.
Zeolite‐Templated Carbon: Characterization and Hydrogen Adsorption
Overview .1 Background
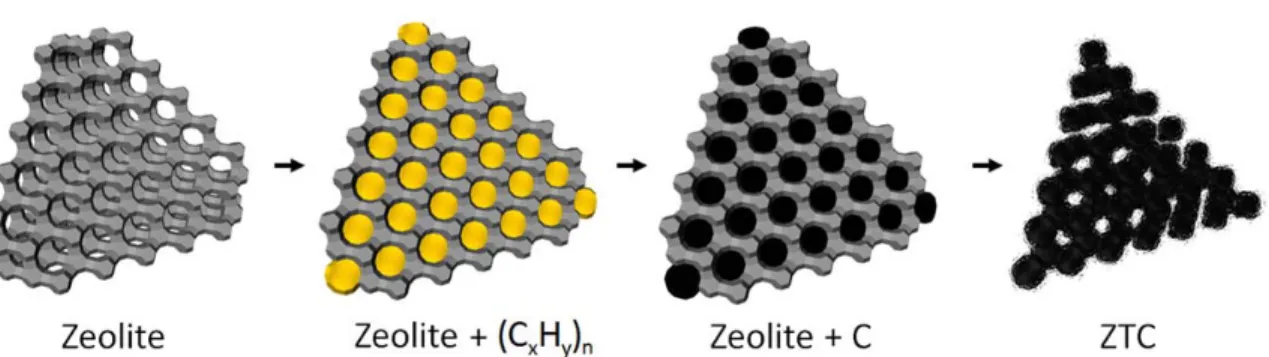
- Zeolite‐Templated Carbons
- Further Investigation
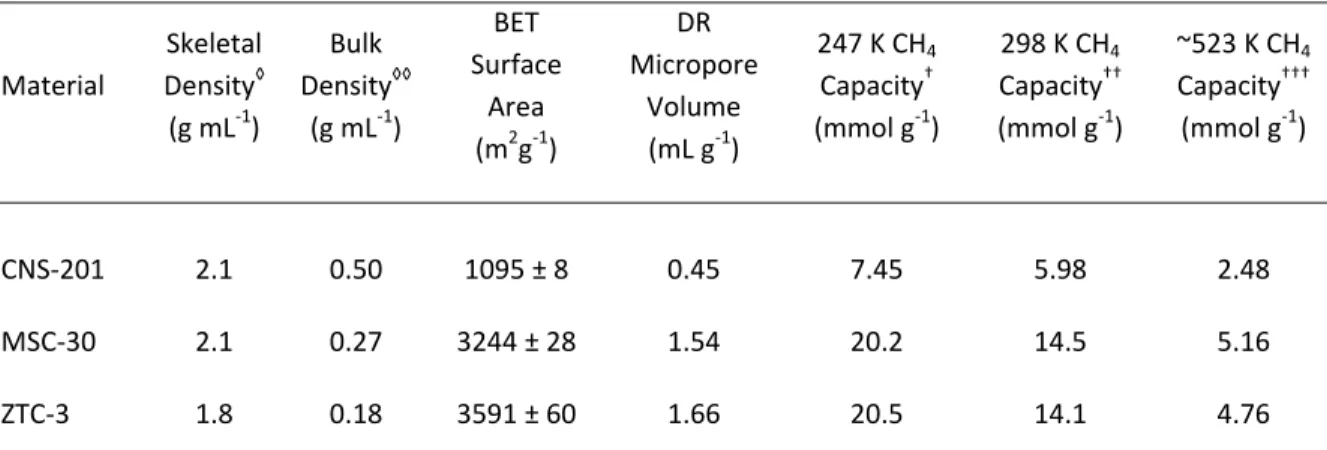
There is no general rule relating specific surface area to excess hydrogen uptake capacity at 298 K because a Gibbs surface maximum is not obtained. However, hydrogen uptake at a given pressure and 298 K is actually known to be linearly correlated with specific surface area: ∼0.2 wt% excess uptake of hydrogen. In addition, BET surface area is notoriously susceptible to errors in highly microporous materials such as ZTCs and can be a significant source of error in the characterization of uptake capacity per surface area at room temperature.
Materials Synthesis
- Raw Materials
- HRL Experiments
The zeolite-furfuryl alcohol mixture was collected by vacuum filtration and washed with excess mesitylene (99.0%, Sigma Aldrich), yielding 3.5 g of a white-gray powder. The zeolite-furfuryl alcohol mixture was collected via vacuum filtration and washed four times with 100 ml portions of xylenes. The ZTC was dried and stored at 150°C under vacuum in a Buchi glass oven, yielding 1.4 g of final product.
Materials Characterization .1 Nitrogen Adsorption
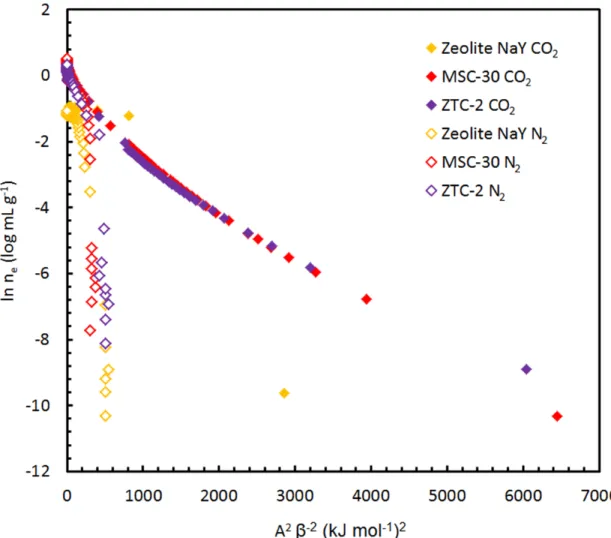
- Carbon Dioxide Adsorption
- Skeletal Density Measurements
- X‐Ray Diffraction
- X‐Ray Photoelectron Spectroscopy
- Electron Microscopy
- Solid‐State Nuclear Magnetic Resonance
Diffraction patterns of ZTC-2 and ZTC-3 are shown in Figure 4.4, compared to the pure zeolite NaY precursor and the composite. EELS spectra showing the carbon 1s edge in ZTC-3 compared to MSC-30, graphite, carbon nanotubes and the amorphous hole-shaped carbon lattice. 89% of carbon ZTC-3 is protonated, from the contribution of the single peak centered at Figure 4.11.
Hydrogen Adsorption .1 Standard‐Pressure Experiments
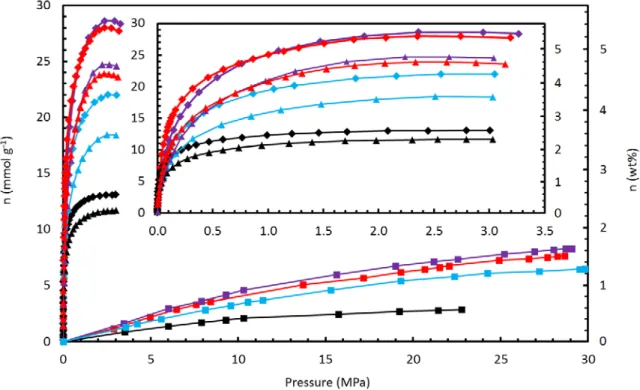
- High‐Pressure Experiments
The complete set of equilibrium adsorption isotherms of hydrogen on CNS-201, MSC-30, ZTC-2 and ZTC-3 is shown in Figure 4.13. The isosteric enthalpy of adsorption calculated using the actual gas density of hydrogen on CNS-201, MSC-30 and ZTC-3 is shown in Figure 4.16. Isosteric enthalpy of adsorption of hydrogen on CNS-201 (black), MSC-30 (red) and ZTC-3 (purple) as a function of absolute uptake, at temperatures of 77–298 K.
Discussion
- Skeletal Density
- Surface Area
- Enthalpy of Adsorption
Elemental composition (CHN) of MSC-30 and ZTC-3 was determined by triple combustion experiments, using the. Hydrogen uptake at 77 K and 298 K is generally proportional to the surface area of the material studied, as shown in Figure 4.17. Equilibrium excess adsorption uptake of hydrogen as a function of BET surface area at 77 K (Gibbs excess surface maximum capacity: diamond) and 298 K (at 30 MPa: . square).
Conclusions
The hydrogen uptake character in ZTCs at 77 K, especially ZTC-3, is slightly different from MSC-30 because the uptake is lower between 0-1.0 MPa, but exceeds MSC-30 between 1.0-2.4 MPa. This implies that there are no significant differences in the dispersion forces responsible for hydrogen physisorption in ZTCs compared to MSC-30. Unlike other carbons, ZTCs have been measured to have significantly lower skeletal density; this has the effect of increasing calculated uptake and straightening the uptake curve with increasing pressure.
That is, a "Chahine's rule" type trend is observed at room temperature and fixed pressure for carbon-based materials, including ZTCs. Sheppard, 'Microchannel development and hydrogen adsorption properties in templated microporous carbons containing platinum nanoparticles', Carbon. Tomita, 'Very large surface area microporous carbon with a three-dimensional nano-array structure: synthesis and its molecular structure', Chem.
Chapter 5
Zeolite‐Templated Carbon: Anomalous Methane Adsorption
Introduction .1 Background
- Materials
A more effective approach to tuning the thermodynamics of adsorption is by controlling the pore size distribution and average pore width to achieve optimal binding interactions. Theoretical models of adsorption in graphitic slit pores show that pore widths corresponding to three molecular diameters of the adsorptive gas are ideal for maximizing adsorbate-adsorbate interactions and. This regularity of pore size in ZTC-3 was confirmed by X-ray diffraction (XRD), which shows a sharp peak centered at 2θ = 6° (see Figure 4.4), and transmission electron microscopy (TEM), which shows a periodic spacing of diffraction contrast corresponding to pores with width 1 nm (see figure 4.8).
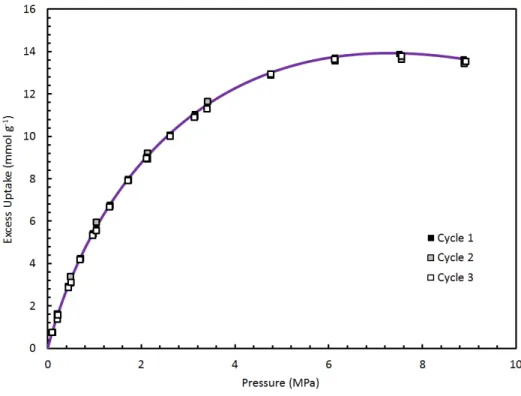
Methane Adsorption .1 High‐Pressure Experiments
- Fitting the Experimental Data
- Trends
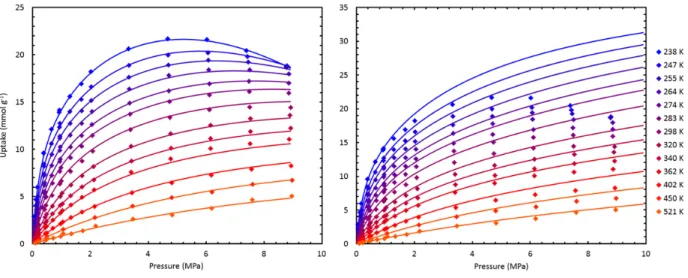
While excess adsorption increases faster for MSC-30 at pressures between 0-0.8 MPa, uptake in ZTC-3 increases most rapidly between 0.8-5.7 MPa. At all temperatures, methane uptake in ZTC-3 is characterized by a gradual initial increase and a delayed increase at pressures between 0.2-2 MPa, leading to a higher final methane capacity than MSC-30, a material with comparable specific surface area. Examples of least-squares methane adsorption isotherms (on CNS-201, MSC-30 and ZTC-3) to the generalized Langmuir equation are shown in Figure 5.7, adjusted excess adsorption (left) and calculated absolute adsorption (right) at all measured temperatures.
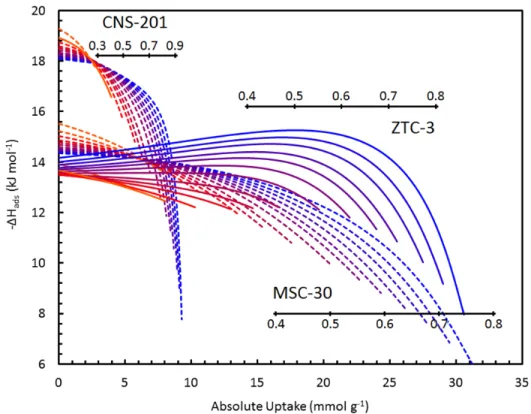
Enthalpy of Adsorption
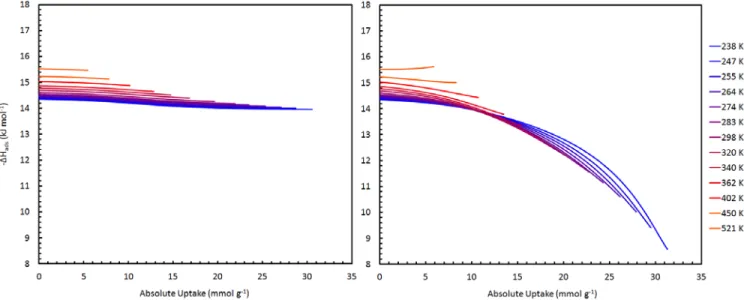
Methane adsorption characteristics as a function of partial site occupancy, θ, on activated carbons (CNS-201 and MSC-30) are typical of other carbon materials, gradually decreasing with increasing uptake. On the contrary, the dependence of the isosteric enthalpy of adsorption on site occupancy in ZTC-3 increases with θ at all temperatures, from 238–518 K. The isosteric enthalpy of methane adsorption on CNS-201, MSC-30 and ZTC‐3 from 238 -523 K (color indicates temperature from low to high as blue to red).
Entropy of Adsorption
Discussion
Surface homogeneity is not a requirement for increased interactions between binding sites, but it would certainly increase the measurable effect on the adsorption enthalpy at high uptake. The average distance between adsorbed methane molecules (approximated as the square root of the BET surface area per molecule) at the surface excess maximum was the same in all three materials in this study (e.g., 0.5 nm at 238 K) and well within distance applicable to lateral attractive interactions. Therefore, we postulate that lateral interactions play a major role in methane adsorption on ZTC-3, overcoming any surface heterogeneity and causing a significant overall increase in the adsorption enthalpy with increasing site occupancy, although it is not possible to determine the exact size of this effect since the homogeneity of the surface is unknown.
Conclusions
Jaroniec, 'Thermodynamics of high pressure adsorption of argon, nitrogen and methane on microporous adsorbents', Langmuir. Chahine, 'Determination of the adsorption isotherms of hydrogen on activated carbons above the critical temperature of the adsorbate over wide temperature and pressure ranges', Langmuir. Ritter, 'Roles of surface heterogeneity and lateral interactions on the isosteric heat of adsorption and adsorbed phase heat capacity', J.
Chapter 6 Conclusions
- Summary of Results
- Hydrogen Spillover for Storage Applications
- Anomalous Adsorption Properties of Zeolite‐Templated Carbons
- Zeolite‐Templated BC x Materials
- Pressure to Change Chemical Potential: Carbon Nanotubes
- References
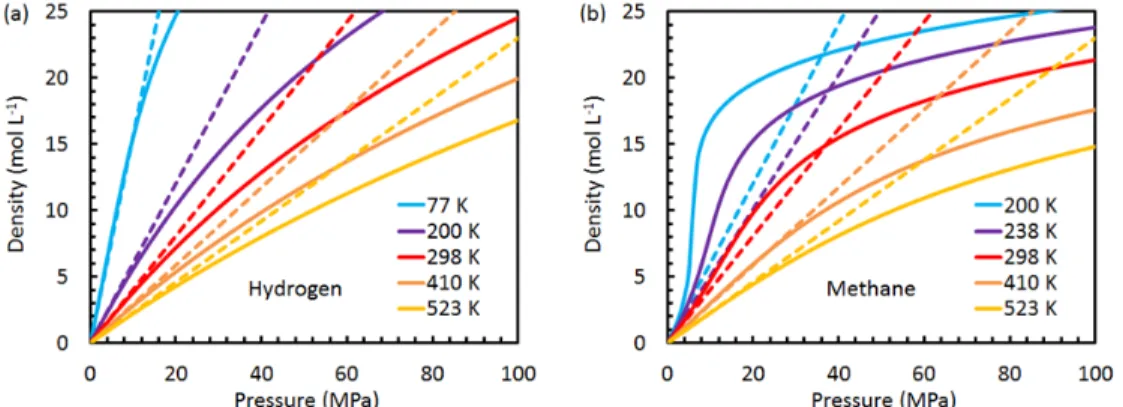
Finding a material that deviates from this trend (significantly higher than scattering) has been the goal of the physisorptive hydrogen storage community in recent years. We cannot rule out entropic contributions, and analysis showed that the entropy of the adsorbed phase resembled that of liquid methane in the high-pressure region. The nature of the chemical potential in the non‐ideal gas region for hydrogen and methane is plotted as a function of pressure in Figure 6.3, with reference to an arbitrary condition such that μ(P,T) is 0 at P = 0.001 MPa.
Appendix A: Experimental Adsorption Measurements
Overview
As adsorption occurs at the gas-solid interface, the weight of the solid increases and the pressure of the gas decreases. Schematic representations of the volumetric (left) and gravimetric (right) methods for the determination of equilibrium gas-solid adsorption isotherms. A second mass, shown in orange, is used for simultaneous determination of the gas density to correct for buoyancy.
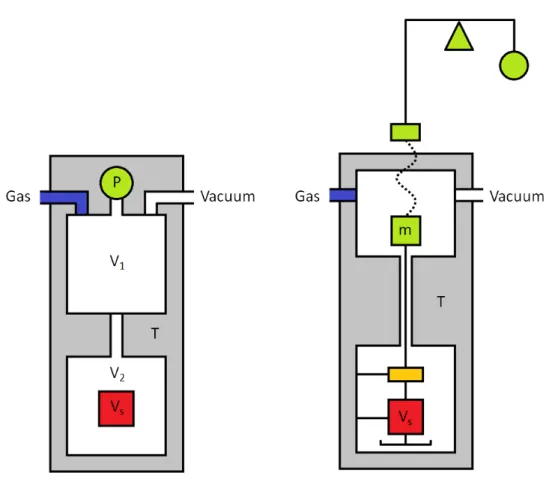
Volumetric Principles
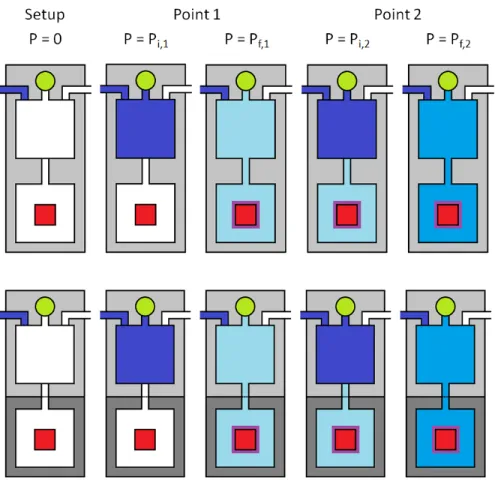
A practical device is shown in Figure A.3b, where only the sample medium is immersed in a temperature-controlled bath while the remainder of the apparatus is kept at a constant temperature near ambient. The amount absorbed is reported as a function of the final conditions in the sample environment. A scheme of the procedure corresponding to the cumulative measurement of two adsorption points by the volumetric method is shown in figure A.4.
Appendix B: Further Results Concerning Hydrogen Spillover
Further studies of the hydrogen diffusion phenomenon and its role in hydrogen storage have been carried out since our report. To control for differences in materials preparation, etc., the same samples were split into multiple groups for uptake measurements. While the identity of the materials is not known to us, the results show a significantly higher hydrogen uptake capacity in sample 2 (indicating the possibility that Sample 1 is the standard and Sample 2 is the diffuse material).
Appendix C: Carbon Dioxide Adsorption on ZTCs
Further work remains to be done, and it is likely that more promising results can be obtained with the higher-fidelity ZTC sample, ZTC-3.
Appendix D: BET and DR Trends of Adsorption Uptake
Appendix E: Pressure Driven Phase Transition
Initial calculations of the effective chemical potential that could be applied for different experimental conditions are shown in Figures E.3-4. The change in chemical potential after a one-step hydrogen expansion between two fixed volumes, one of which contains adsorbent, in a temperature bath of 77 K, and. bottom) the corresponding effective change per carbon atom (a function of surface coverage) in seven different devices with total volumes: top). The change in chemical potential after a 1-step methane expansion between 2 fixed volumes, one containing adsorbent, in a fixed temperature bath, and (below) the.
Appendices References