Transient particle collection from an unlubricated stainless steel tube in crossflow for small, medium, and large effective Stokes numbers. Efficiency of particle collection for tubes in each row for the four cases of solid ammonium fluorescence particles in crossflow over lubricated and.
BACKGROUND
PROBLEM
TEST CASES
PARTICLE COLLECTION ON SINGLE TUBES
Two cases were investigated: stainless steel tubes coated with a very thin layer of grease to ensure that particles hitting the tube surface would stick, and clean tubes used to investigate the degree of particle jump that occurs when solid particles hit a fixed tubular surface. Overall, the proportion of the tube surface covered with particles was kept low to minimize possible particle-particle interaction.
TRANSIENT DEPOSITION ON SINGLE TUBES
Lubricated tubes were found to show no significant removal of particles from the collected deposits, and thus a steady state between particle deposition and removal was not achieved over the time period tested.
TUBE BANK DEPOSITS
OBJECTIVES
BIBLIOGRAPHY
Epstein, N., Fouling: Technical Aspects (Afterword on Fouling of Heat Transfer Exchangers), Fouling of Heat Transfer Equipment, Hemisphere, Washington, D.C. Leach, S.H., and Factor, S.A., Monitoring Fouling in Refinery and Petrochemical Heat Exchanger Plants, ASME Heat Transfer Division Publication, vol.
ORGANIZATION OF THIS CHAPTER
PREVIOUS REVIEWS OF FOULING BEHAVIOR
ROLE OF FOULING CONSIDERATIONS IN THE DESIGN
The transfer of heat from the hot working fluid to the cold working fluid involves heat transfer film coefficients, h, on both the hot and cold sides of the exchanger, plus a resistance to heat transfer due to conduction through the metal wall separating the two fluids. From Equation 2.10, it is quickly seen that as the heat exchanger fouling resistances Ro and Ri increase due to deposit accumulation, the overall design heat transfer coefficient, Ud, decreases.

FOULING MODELS
- OVERVIEW
- THEORETICALLY BASED MODELS FOR FOULING
- MODELS BASED ON LABORATORY EXPERIMENTS
- MODELS BASED ON DATA FROM IN-SERVICE UNITS
Most theoretically based fouling models use the observation that industrial heat exchangers often foul asymptotically. They found that the effect of diesel exhaust pollution on the required oversizing of the heat exchanger was approximately independent of the quality of the fuel used, with an asymptotic value of pollution resistance which.

PARTICULATE FOULING OF HEAT EXCHANGERS
MECHANISMS OF TRANSPORT TO THE SURFACE
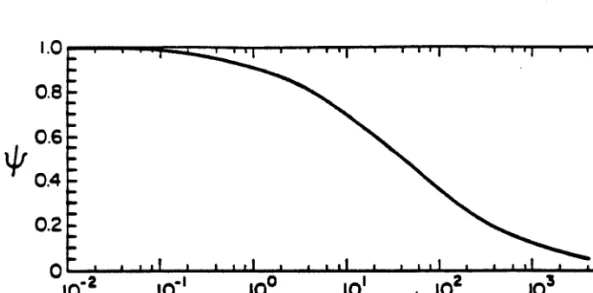
However, in most real cases, especially if the Stokes number is large, the relative velocities of the particle and the fluid are sufficiently different that derivation of Stokes' law is inadequate. The Stokes number is based on the cylinder radius as the characteristic dimension of the assembly. collection efficiency as a function of the Stokes number and the parameter P=Rep2∕St.
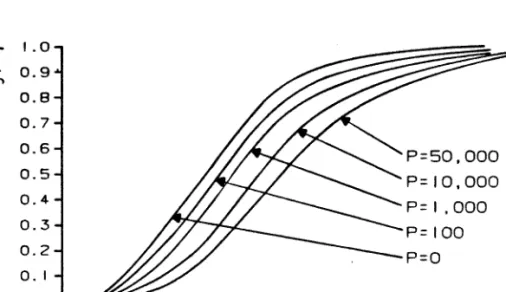
PARTICLE ATTACHMENT
- EXAMPLES OF PARTICLE BOUNCE
The Stokes number is based on the radius of the cylinder as a characteristic dimension. 40). boundary condition), this assumption has been shown to be inadequate to describe many ranges of impact velocities, impact angles, and particle and surface properties where particle reflection occurs (1,41-44). This section presents information on examples of particle repulsion from the literature, followed by a discussion of the forces involved in particle attachment.
THE FORCES INVOLVED IN PARTICLE ATTACHMENT . 35
- CAPILLARY FORCES
- DEFORMATION
- CHEMICAL BONDING
- COEFFICIENT OF RESTITUTION
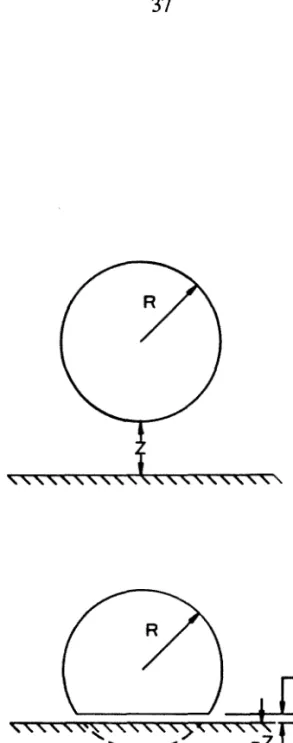
An estimate of the relative magnitude of the interactive forces as a function of particle size is given by Leong et al. In the case of a spherical particle and a flat surface, the force is most easily obtained by the textbook example of the Van der Waals attraction between to use two spheres and let the diameter of one sphere go to infinity.
LIMITING VELOCITY FOR PARTICLE CAPTURE
- PARTICLE STICKING PROBABILITIES
Clearly, for any given situation, there must be some value of the velocity of the incident particle above which the particle will bounce rather than hang; problems arise in the determination of Ei, Er and e. Little is known about the detailed dependence of P on these factors, although general trends can be identified from analysis and analysis.

DEPOSIT REMOVAL
PARTICLE RE-ENTRAINMENT
They suggest that the removal of deposited material is proportional to the wall shear stress and the thickness of the deposit layer:. Here, φr is the rate of removal of heat transfer resistance due to deposit removal, τ is the wall shear stress, and x is the deposit thickness.
AUGMENTED REMOVAL
From these predictions, a piece removal criterion based on the wall shear stress, Tw, can be obtained. The lance can be rotated and pulled back and forth for direct concentrated cleaning as needed.
SUMMARY
The experiments described in Chapters 4, 5 and 6 were chosen to bridge these two areas of knowledge. The single tube deposition experiments in Chapter 4 were chosen to attempt to verify the model discussed in Section 2.5.2.3 and to quantify particle bouncing for particles impinging on the inward flow of a cylinder (a common geometry of a heat exchanger).
BIBLIOGRAPHY
Com, M., and Silverman, L., Removal of solid particles from a solid surface by turbulent air flow, American Industrial Hygiene Association Journal. MacDuff, E.J., and Clark, N.D., Ljungstrom design and operation of the air preheater - Part II: Corrosion and fouling, combustion.
EQUIPMENT
PARTICLE GENERATION
It is recommended (2) that the molarity of the ammonium hydroxide solution be at least twice that required by the stoichiometry of the solution. A disposable 60 mL plastic syringe was used with the syringe pump assembly to produce an approximate flow rate of 0.21 cm3∕min.
WIND TUNNEL
The variable speed fan provides air velocities in the empty test section ranging from a minimum of 1489 ft/min (756 cm/s) to a maximum of 9820 ft/min (4989 cm/s). A double thickness of air conditioner fiberglass filter material is placed in the filter holder to capture particles that are not deposited on the models in the test section.
PROCEDURE
PARTICLE SAMPLING PROCEDURE
Single tubes and staggered or in-line tubes can be inserted into the test section and then removed for analysis. Since it was necessary to provide a conductive filter path which would be covered with a 10 angstrom layer of gold and palladium in the SEM, the filter segment was attached to the stub by "gluing" it by infusing it with a colloidal silver suspension ( Ted Pella, Inc.).

TUBE PREPARATION
A 47 mm diameter, 0.4 micrometer pore size nucleopore filter was used in the filter holder, and flow was controlled by means of a critical orifice located downstream of the filter holder. Preparation of samples for SEM examination involved cutting a small segment from the center of the filter and attaching it to the SEM stub.
EXPERIMENTAL PROCEDURE
DEPOSIT EXTRACTION
- UNGREASED TUBES
- GREASED TUBES
During each wash cycle, the flask was agitated on a small shaking table for about 30 minutes, and then the extract was transferred to a ground glass-stoppered 125 ml Erlenmeyer flask. Preparation of a solution suitable for analysis was then accomplished by stirring the toluene eluents with 25 ml of 0.1 molar sodium hydroxide solution.
FILTERS
After the settling period, the aqueous phase was removed and the fluorescein concentration was determined spectrophotofluorimetrically as in the case of clean test tubes.
SPECTROPHOTOFLUORIMETRIC ANALYSIS
DATA REDUCTION AND ANALYSIS
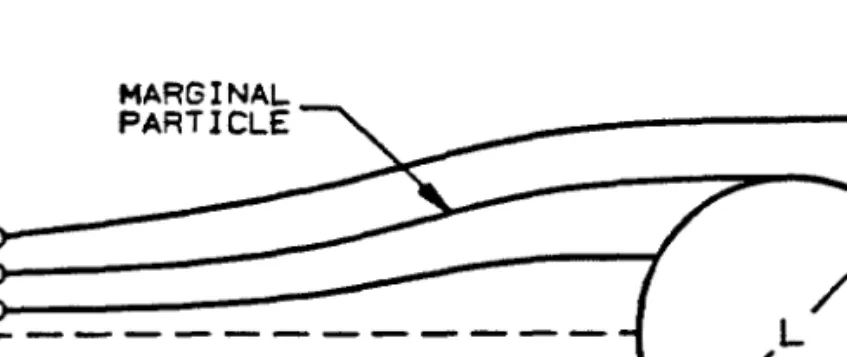
For any general collector, the collection efficiency is defined as the number of particles deposited on the collector divided by the number of particles in the upstream cross section. For a single pipe in crossflow, the collection efficiency is the ratio of the number of particles actually collected in the pipe to the total number of particles present in the upstream projected cross-sectional area of the pipe.
ESTIMATION OF ERRORS
Because the strength of the emission signal is a linear function of the solution concentration, it is possible to use linear regression to determine the relationship between the two. Errors in reading the emission signal strength on the SPFM meter were approximately 1.0% and thus the worst-case error in determining the solution concentration is 1.4%.
BIBLIOGRAPHY
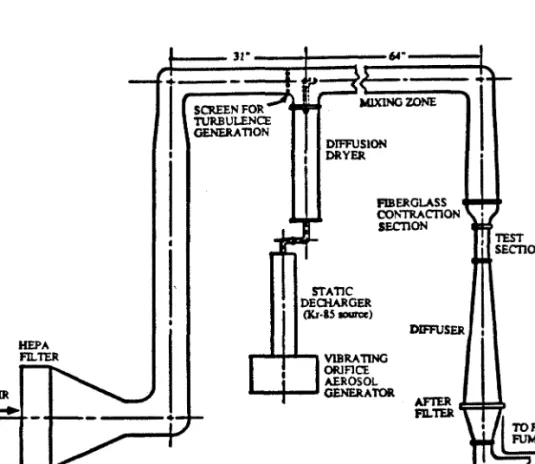
Using the aerosol process eswind tunnel described in Figure 3.10 and Section 3.1.2, experiments have been conducted to investigate the interaction of particles in a gas stream with both lubricated and unlubricated tubes.
EXPERIMENTAL RESULTS
GREASED TUBES
This is to be expected for the "perfect sticking" case, as increasing Syndicates results in an increasing dominance of inertial over viscous forces on the particle and thus a reduced ability of particles to follow the fluid streamlines around the tube (see Section 2.5.1 ). As the effective Stokes number increases, more particles hit the tube and as the tube is lubricated to simulate "perfect sticking" more particles stick.
UNGREASED TUBES
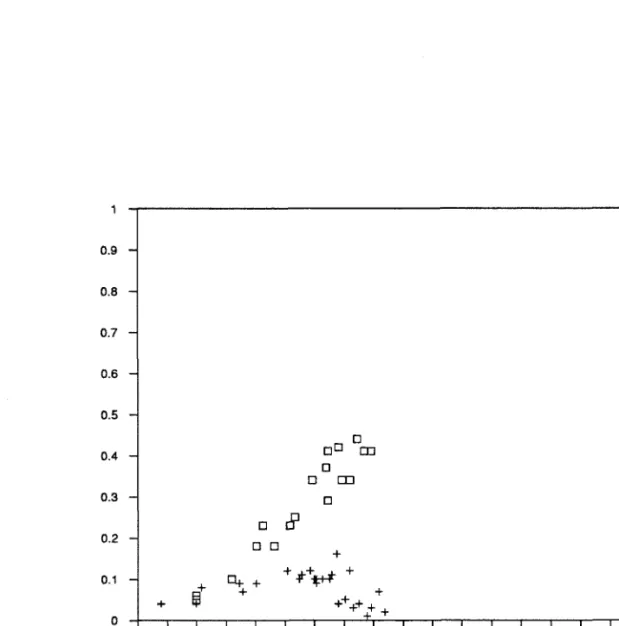
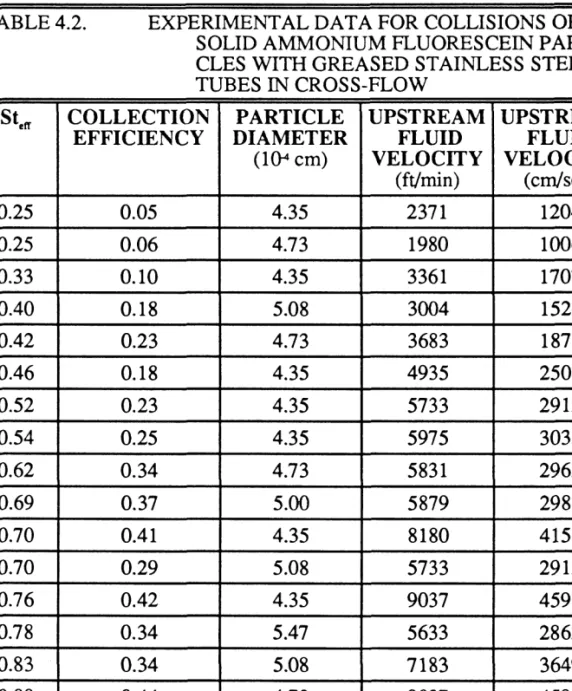
EXPERIMENTAL DATA FOR COLLISIONS OF SOLID AMMONIUM FLUORESCEIN PARTICLES WITH LUBRICATED STAINLESS STEEL PIPES IN CROSS FLOW. This difference increases with Steff until almost no particles are captured at the largest effective Stokes numbers considered here.
ANALYSIS
- TRAJECTORY GENERATION
- GREASED TUBES
- UNGREASED TUBES
- CRITICAL VELOCITY CURVES
- COMPARISON OF EXPERIMENTAL DATA TO PREDICT
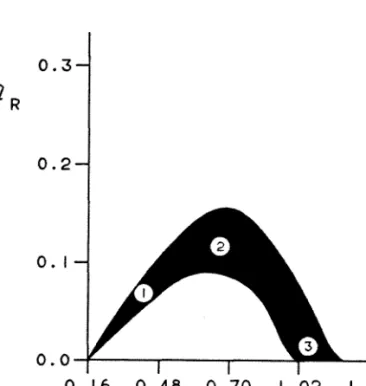
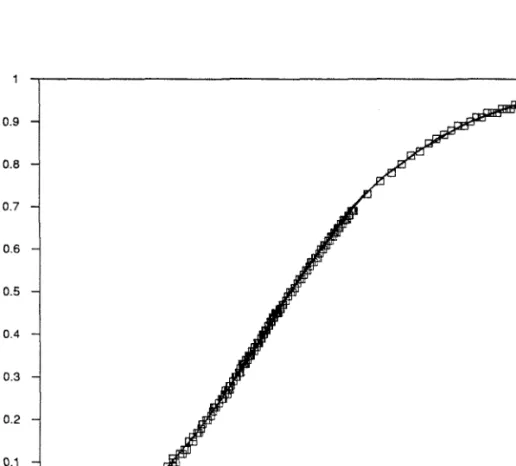
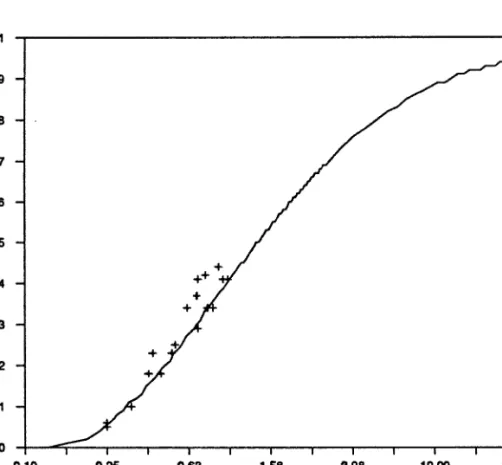
This can be seen in Figure 4.1 as the divergence of the unlubricated tube data from the lubricated tube results. Comparison of theoretical collection efficiency curve based on particle trajectory calculations (Figure 4.3) with experimental data from Figure 4.1 for the case of solid particle collisions with lubricated tubes in crossflow.
CONCLUSIONS
In any case, it can be seen that the assumption of a critical incident with a normal particle velocity required to completely escape collection through the tube of 1000 centimeters/second as the criterion for particle bouncing fits well with the data in regime in which particle bouncing is negligible (i.e. for small Steff) and in the regime in which particle bouncing dominates (i.e. for high Steff). The onset of particle bouncing can be explained for the case of collisions between solid particles and clean tubes, based on a critical normal incident velocity required to induce particle bouncing.
BIBLIOGRAPHY
Using the aerosol processes wind tunnel described in Section 3.1.2 and Figure 3.10, experiments were conducted to determine the rate of particle accumulation as a function of the total deposition over time on both clean and lubricated tubes. is accumulated. Medium-efficiency Stokes number experiments are designed to determine the transient behavior when short-term particle collection efficiency for unlubricated tubes is at its maximum.
EXPERIMENTS
GREASED TUBES
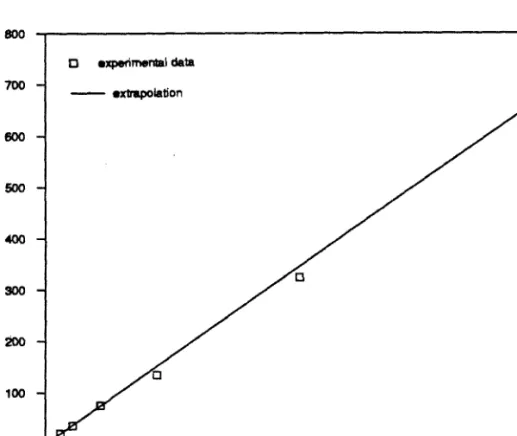
The line represents an extrapolation of the initial deposition rate and the small squares are experimental results. Also given in Figures 5.2, 5.3 and 5.4 is the number of particles that would have collected in the tube if the initial deposition rate had been maintained indefinitely and no removal had occurred.
UNGREASED TUBES
Figures 5.5, 5.6 and 5.7 show the number of particles collected in the tube as a function of the total number of particles that were ever present in the upstream cross-sectional area of the tube, again for the low, medium and high Steff cases , respectively. Also given in Figures 5.5, 5.6 and 5.7 is a line showing the predicted number of particles that would have collected in the tubes if the initial deposition rate had been maintained indefinitely and no particle removal had occurred.

ANALYSIS
GREASED TUBES
UNGREASED TUBES
The small diamonds represent data for an effective Stokes number of 0.30, the crosses represent data for an effective Stokes number of 0.64 and 0.65, and the squares represent data for a Stβff of 1.04. The small effective Stokes number curves in Figure 5.9 (Stcff=0.30) were produced using particles with diameters of 3.67xlCF and 4.60xlCH centimeters.
CONCLUSIONS
The total fraction of the tube surface covered by particles in steady state is even lower in this case. Because the portion of the surface covered in steady state is small, it is unlikely that the.
BIBLIOGRAPHY
Models of tube banks of compact heat exchangers were placed in the test section of the wind tunnel for aerosol processes, described in section 3.1.2 and Figure 3.10, and the particle deposition on the tubes was measured.
IN-LINE TUBE BANKS
GREASED TUBES
Total number of particles in each row for the case of solid ammonium fluorescent particles in cross-flow through a lubricated tube array. The total number of particles in each tube in the case of solid ammonium fluorescein particles in cross-flow through a greased in-line set of tubes.

UNGREASED TUBES
The number of particles collected from the last row, row E, was about one-fourth that collected from the first row, row A. The total number of particles in each row for the case of solid ammonium fluorescein particles flowed interlaced over a bank of ungreased tubes.

STAGGERED TUBE BANKS
GREASED TUBES
Total number of particles in each row for the case of solid ammonium fluorescein particles in cross-flow over a bank of grease-lubricated tubes. Total number of particles in each tube for the case of solid ammonium fluorescein particles in cross-flow over a grease-lubricated bank of tubes.

UNGREASED TUBES
Total number of particles in each row for the example of solidammonium fluorescein particles in cross-flow through an unlubricated staggered tube. Total number of particles in each tube for the case of ammonium fluorescein solids in cross-flow across an unlubricated staggered tube.

ANALYSIS
IN-LINE TUBE BANKS
Efficiency of particle collection for tubes in each row for two boxes of solid ammonium fluorescein particles in cross-flow across greased and ungreased in-line tube banks.

STAGGERED TUBE BANKS
The behavior of a staggered unlubricated tube group is qualitatively similar to that of a sequential lubricated tube group. The staggered tube arrangement results in much more efficient heat transfer; however, increased pressure drop and more particle settling also result from the staggered pipe arrangement.

COMPARISON TO SINGLE TUBE EXPERIMENTS
The behavior of the offset, ungreased tube bank is qualitatively comparable to that of the offset, greased tube bank. However, any efficiency of collecting ungreased rows is much smaller than the corresponding efficiency of collecting greased rows. This is a reasonable conclusion, as the limitation of available flow area in the test section is much greater with the tube bank in place than when a single tube is in place.
CONCLUSIONS
Antifouling recommendations should include the need to keep surfaces as dry, clean, and particles as possible to increase particle bounce and use velocities as high as are consistent with heat transfer or power consumption limitations. in the system, also to increase particle hopping.
BIBLIOGRAPHY
OVERVIEW
It was found that a steady state (ie, a constant number of particles in the tube) can be reached in some cases. The amounts of aerosol deposited in different tubes depended on the position within the tube bank as well as the overall geometry of the bank.
SUMMARY OF RESULTS
SINGLE TUBE EXPERIMENTS
It has been shown that although particle reflectivity increases with larger particle size and/or higher particle velocity, particle reflectivity is not simply a function of the effective Stokes number. Since particle rebound is a phenomenon that will occur at high incident velocities, it is possible to stop the build-up of solid particles on the cross-flow tubes by selecting sufficiently high fluid velocities.
TRANSIENT EXPERIMENTS
For the range of the effective Stokes number (0.29 to 1.04), the number of particles deposited on the tube quickly reaches a steady state, with particle deposition and particle removal occurring at equal rates. In the transient case, this means that stable particle deposit coverage with less total particles on the tube is achieved when the clean tube-solid particle system is used at high fluid velocities.
TUBE BANK EXPERIMENTS
However, the qualitative nature of the particle deposition pattern within the tube bank was dependent on the tube bank geometry and was similar regardless of the tube surface condition. For the in-line tube banks, it was found that a majority of the particles collected by the tube bank were deposited on the first row of tubes in both the greased and ungreased tube experiments.
CONCLUSIONS
Although a staggered tube arrangement improves heat transfer from the fluid to the tubes, it has been shown to improve particle collection (fouling) as well. The overall solids collection efficiency from ungreased tube banks has been shown to be lower than the overall solids collection efficiency from greased tube banks.
BIBLIOGRAPHY


![(2)[2] Before dealing with the merits of the matter it is necessary to correct the citation of the respondent](data:image/gif;base64,R0lGODlhAQABAIAAAP///wAAACH5BAEAAAAALAAAAAABAAEAAAICRAEAOw==)