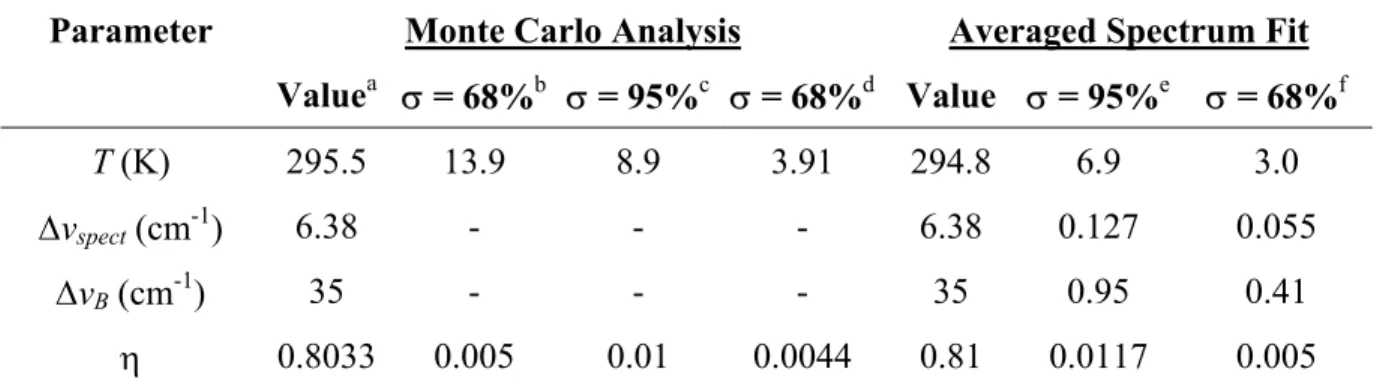
The lineshape parameter set for the minimal free parameter set (T, ∆vspect, ∆vB and η) from the fit of the H2 Raman spectrum in Fig. Through examination of the sensitivity coefficients, the number of free parameters has been reduced, yet is linearly dependent due to the inherent non-linearity of the spectral problem. Additionally, 2% fluctuation in the constant background is assumed to simulate the noise level of the CCD.
Comparison of the statistical results of the Monte Carlo analysis with those obtained from the 95% confidence interval parameter estimates from the variance matrix of both the Monte Carlo analysis and the average spectral fit in the figure. The only significant deviation between Monte Carlo and parameter estimation calculations is in the determination of the uncertainty T. As a result, the single-pulse measurement has approximately the same uncertainty in terms of the quality of fit (confidence interval estimate based on χ2).
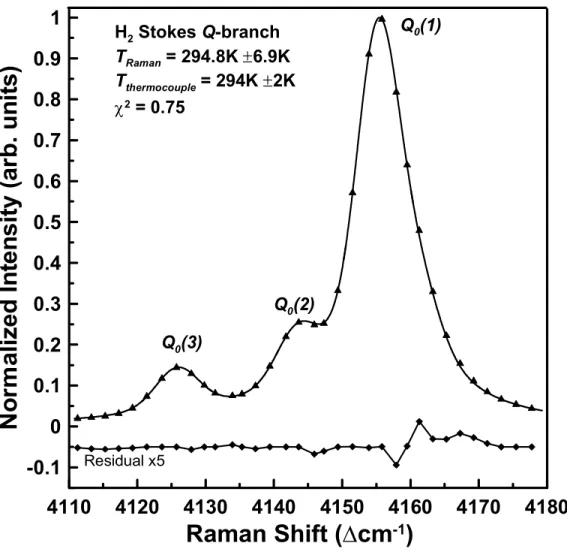
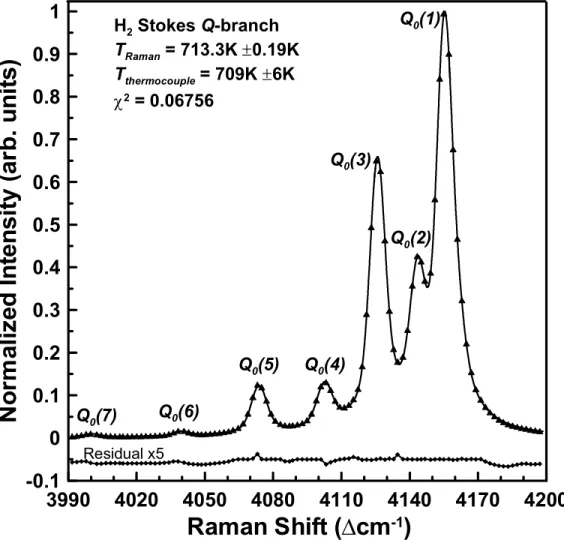
Since the fit of the average spectrum is almost perfect (χ, the true uncertainty of the Raman measurement is obtained by inspecting the pdf of the single pulse.
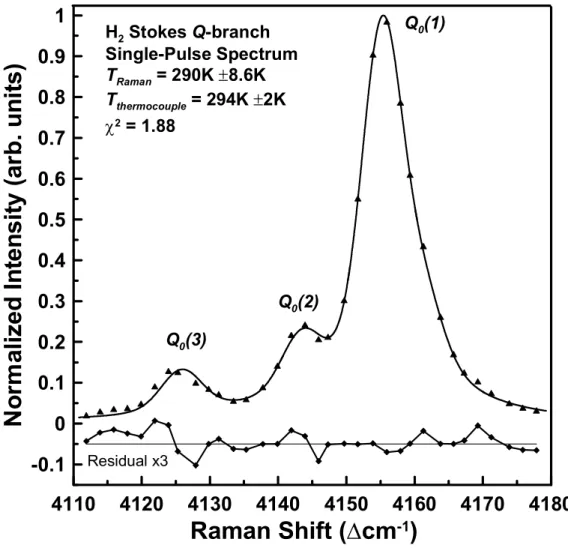
Raman Shift (∆cm -1 )
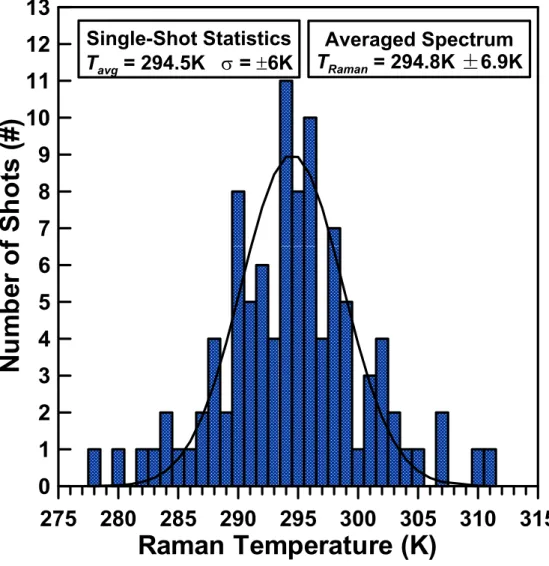
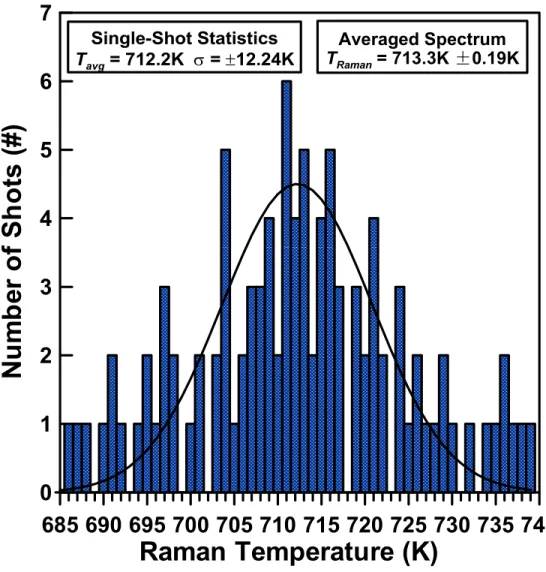
The uncertainty in TRaman is determined by the 95% confidence interval for parameter estimates and χ2 goodness of fit (σ K. The uncertainty in TRaman is determined by the 95% confidence interval for parameter estimates and χ2 goodness of fit (σ = ±0.09K) 5 -3, this limited sample size does not give an accurate indication of the true measurement deviation as the spread in the distribution is over a large range of temperatures resulting in low count numbers in the respective bins.
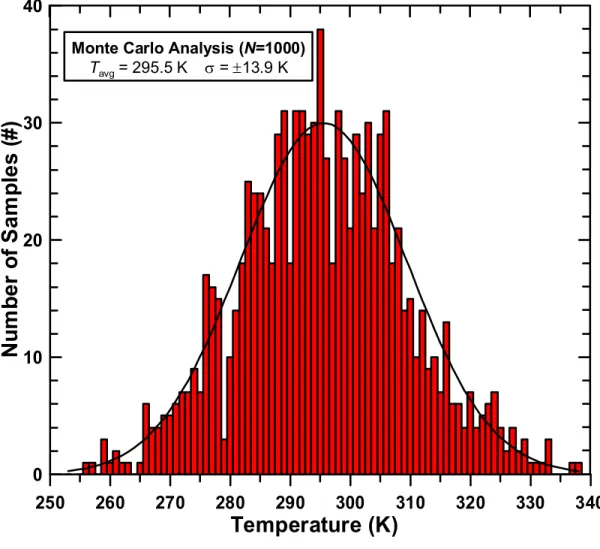
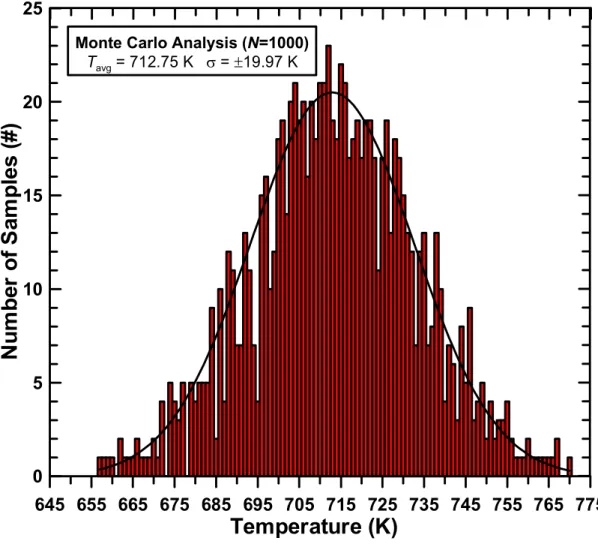
A histogram showing the Monte Carlo results for N = 1000 H2 Stokes Raman spectra with a reference spectrum of T = 713K, peak S/N. Thus, based on σ = ±19.97K from the Monte Carlo calculations and the confidence interval estimates in the fits (±5.6 for the Monte Carlo fits and ±0.09 for the mean spectrum fit), the total uncertainty in the Raman-derived fit is in fig. A fitted time average (400 pulses) H2 Q-branch Raman spectrum obtained in a laminar atmospheric H2 air flame produced from a Hencken burner is shown in Fig.
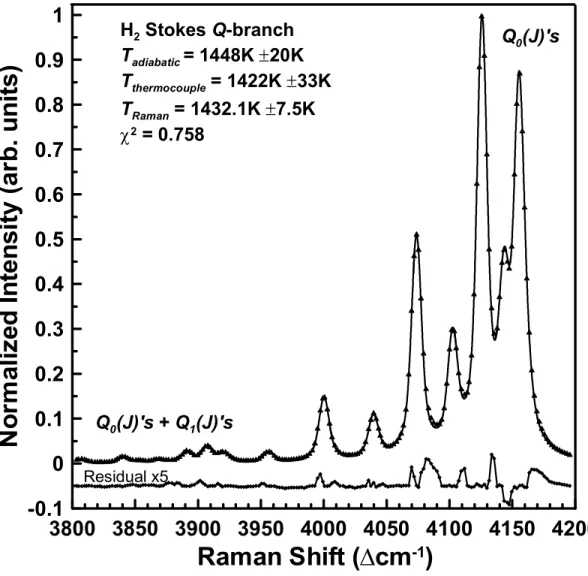
Adiabatic flame temperature, Tadiabatic, for an extremely rich flame (equivalence ratio, φ=5.5) probed in Fig. Adiabatic flame temperatures are based on equilibrium calculations using measured mass flow rates with uncertainties based on the combined relative error of the mass-flow meters. The temperatures measured by Raman and thermocouple are slightly lower than the adiabatic flame temperature because incomplete combustion occurs due to the extremely rich φ and high mass flow rates required to produce such a "cold" flame.
Based on the exceptional goodness-of-fit χ spectral point), the confidence interval estimate of the uncertainty in TRaman for the fit in Fig.
Raman Temperature (K)
Temperature (K)
Furthermore, based on an examination of previous Monte Carlo calculations, the spread in the measurement distribution is expected to be of the order of magnitude (3σ). Therefore, to determine the measurement uncertainty in TRaman for the image, Monte Carlo calculations are used with the number of samples increased to N = 2000 to account for the increased T range of the measurement distribution. Then, combined with an average spectral fit error of ± 3.8K, the absolute uncertainty of the fitted Raman spectrum in Fig.
These combined effects are illustrated by the quality of the fit and the increased residuals in Figure. The single-shot experimental spectrum is representative of one of the 400 spectra that make up the average spectrum shown in figure. Even though the data set is quite small, because the distribution is so large and the bin counts in the histogram are small, the Monte Carlo simulations still provide an accurate indication of the measurement distribution structure and statistics.
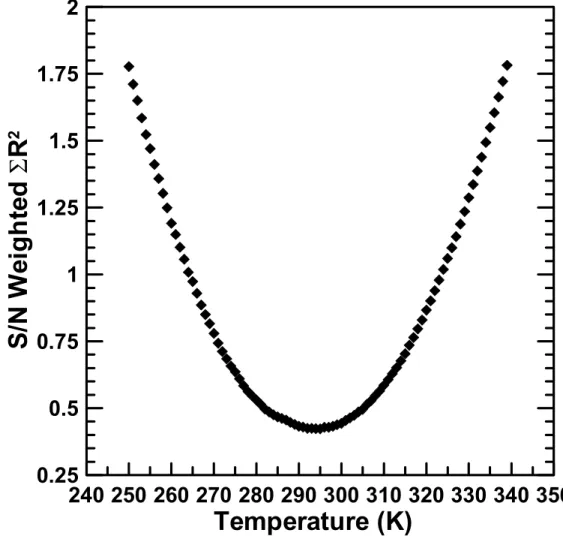
A comparison of the average Raman spectrum fitting errors, Monte Carlo simulations, the total uncertainty in the Raman measurement, and the measured S/N ratios is given in Table 5-2. Examination of the results in Table 5-2 clearly shows that most of the total uncertainty in the Raman measurement is due to the distribution/standard statistics resulting from the Monte Carlo calculations, which accurately simulate the single-pulse spectra and the true nature of the Raman measurement, while the contributions from the fitting errors associated with the average Raman spectrum and the Monte Carlo spectra are minimal. 5-15 indicate that the uncertainty in the Raman measurement is a strong function not only of T, but also of the S/N levels, as indicated by a decrease/increase in the uncertainty of the measurement as T increases, also though the S/N levels are decreasing.
Thus, the optimal use of the Raman contour fitting method depends on the experimental system and conditions, as the accuracy of the measurements is a strong function of T and signal strength. At higher pressures, such as those associated with MCTA P = 122 atm, the measured S/N levels in the spectra will increase, reducing the error in the measured Raman signals and shifting the curve in the figure. spectra will increase because Raman signals scale linearly with P (number density, nD).
This will extend the application limits of the contour-fit Raman method to higher T as the uncertainty estimates will decrease. 5-15 Absolute uncertainty (standard deviations) in the H2 Raman measured temperatures as a function of ∆T and % of the measured T versus the derived Raman T.
Temperature (K)0
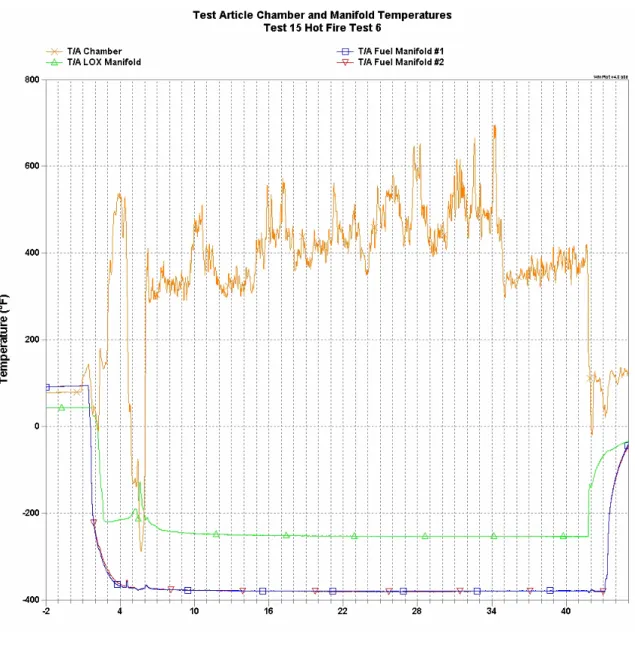
Hot-fire tests of the Modular Combustion Test (MCTA) product were conducted at MSFC to simulate the combustion of cryogenic propellants (LH2 and LOX) in advanced rocket engine preburners as part of the Combustion Injection Technology (SCIT) Demonstration Program. The combustion chamber flow field conditions are listed in Table 3-3, and the MCTA image during the hot fire test is shown in Fig. The hot fire test sequence begins with GN2 and GHe scrubbers LOX and LH2.
Single-pulse Raman measurements were attempted in the nozzle exhaust, ∼10 cm from the nozzle throat, for several hot-fire tests of the MCTA. Raman measurements were obtained for approximately the first 6 s of the tests, after which the Raman signal disappeared. The vibrational stability of the Raman system was also affected by the calorimeter installed on the MCTA during the Raman exhaust nozzle measurements.
In addition, the infrared (IR) signature of the exhaust flame entered the spectrograph as stray light and caused a large background emission. Combustion of the purified gases through the flare igniter generates a relatively low pressure (Pc = 300psi) and temperature (Tc = 338K) gas mixture. 5-18 Single-pulse H2 Raman Q-branch spectrum obtained in the exhaust plume of the MCTA during a hot-fire test at t = 3s.
Consequently, the spectrum fit and Raman-derived temperature have a large uncertainty TRaman = 325K ±98K. In addition, the large background induced by the scattered IR radiation from the combustion of the excess propellants in the exhaust plume through the exhaust flare can be seen in Figure 5-19 Single-pulse H2 Raman Q-branch spectrum obtained in the exhaust plume of the exhaust gases . MCTA during a hot fire test at t = 5.75s.
CCD Pixel Number (#)
-19 Single-pulse H2 Raman Q-branch spectrum acquired in the MCTA exhaust plume during a hot-fire test at t = 5.75s. Single-pulse Raman measurements were attempted during several MCTA hot-fire tests. The configuration of the MCTA was as follows: injector and injector faceplate, an optical section with four windows for shadowgraphy and video monitoring of the injection process, torch igniter, 2.5 cm spacer, three thermocouple racks, 10 cm spacer, an optical section with four windows for Raman measurements and video monitoring of the downstream combustion zone and nozzle assembly. 2002) shadowgraphy of the injection process was prevented by the optically thick supercritical LH2 spray core.
The main combustion zone occurs ~17-25 cm from the front of the injector, and the thermocouple racks are positioned at ~20 cm, 22.5, and 25 cm. At positions closer than 20 cm, the thermocouples are destroyed due to high temperature regions (~1200K) produced by combustion in the shear layer of the LOX spray core. The maximum room temperatures, measured at ∼20 cm from the injector faceplate, for the first and second MR are Tc = ∼750K and ∼1000K, respectively.
5-20, subsequent measurements of Tc show a decrease with increasing distance from the combustion zone/injector faceplate due to relaxation of the hot gases to equilibrium conditions. The Raman measurements in the chamber were performed approximately 50 cm downstream of the injector faceplate to ensure equilibrium conditions. However, Raman measurements were prevented by the formation of ice and water on the chamber windows.
Video footage monitoring the injector face also revealed ice formation on the injector face caused by H2O products recirculating back onto the injector faceplate. Despite the formation of water and ice on the chamber windows, an extremely small Raman signal (~2000 counts on the CCD) was detected throughout the duration of the hot fire test, and the induced IR background from the discharge ignition was not detected. Tcs are measured at and 25 cm downstream of the injector face with the main burn zone occurring at ∼17–25 cm.
Time (s)
Chamber Temperature and Pressure (oF, PSI)
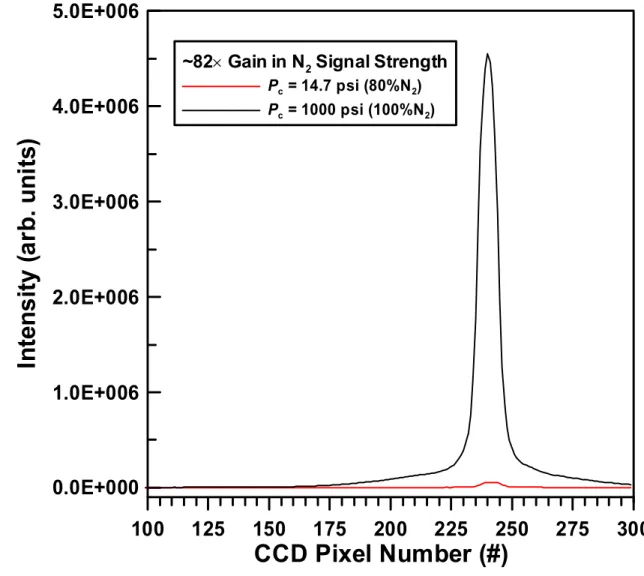
The resulting scattered Raman signals are shown to scale approximately linearly with P and Ci by ∼82× increase in signal strength for the 100%–1000psi N2 spectrum compared to the 79.5%–14.7psi N2 spectrum. For the MCTA hot fire test condition of Tc = 800K and Pc = 1800psi with Ci = ~0.9, the Raman H2 signal enhancement should be ~205x the signal intensity measured in laboratory experiments, which is consistent with the value of theoretically calculated of 200x. in Table 3-3. No significant collision-induced broadening is observed in the comparison of normalized Raman spectra.
Despite the weak spectral resolution, the normalized Raman spectra illustrate the change in transition frequencies due to the ρ-dependent energy-changing collisions. In addition, stimulated Raman scattering has been a problem in previous use of pulsed lasers for high-pressure Raman diagnostics (Wehrmeyer et al. 2001 and Farhangi et al. 1994), but stimulated Raman scattering effects were not observed during the acquisition of high-pressure pressure N2 spectra in fig.
This increase in signal level will increase the accuracy of temperature measurements obtained by Raman (<3%), as the error in