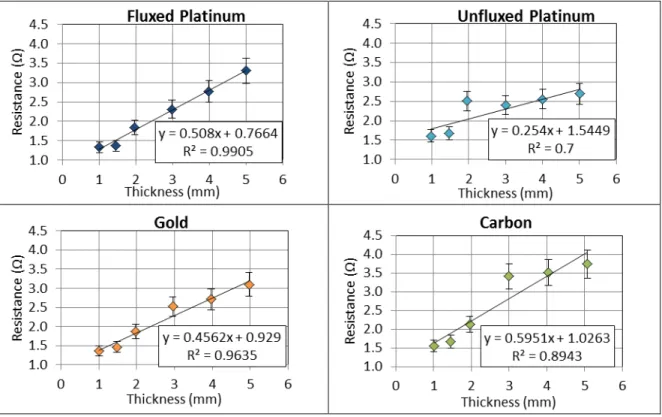
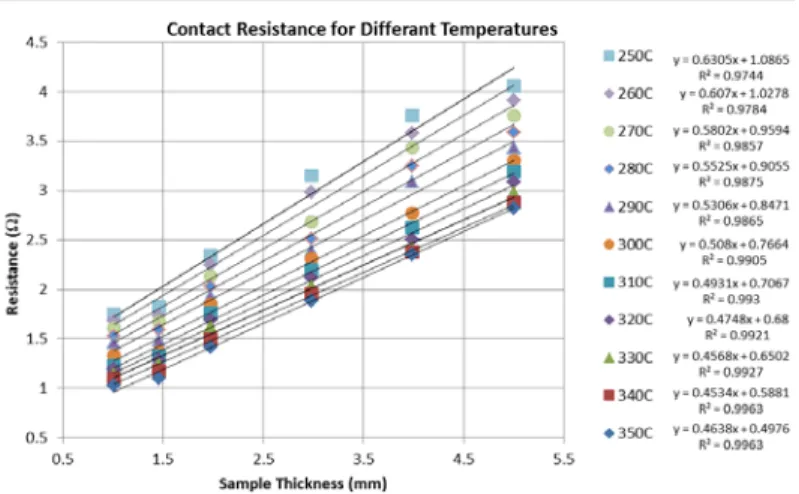
Linear trend lines were fitted to the data with varying success (see text). Sample thickness at 300 °C for samples measured with four. The effects of sample thickness and electrode material were evaluated to determine the repeatability of data across these parameters.
INTRODUCTION
One purpose of this work was to evaluate the effects of small amounts of excess soda on the properties of the final product, including density, grain size, and ionic resistance. In particular, it is hypothesized that the type of electrode material used in sample testing, as well as variations in sample thickness, can influence the final experimental results.
LITERATURE REVIEW
Material Background
- β and β"-Alumina Background
- Applications
- Zinc Doped β” Alumina
- Processing Na β”-Alumina
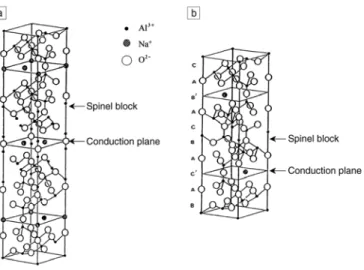
This causes the thickness of the conduction plane of β"-alumina to be greater than that of β-alumina, approximately 3 Å. The reason for the cylindrical shape of the cell is due to the mechanical performance of β"-alumina.
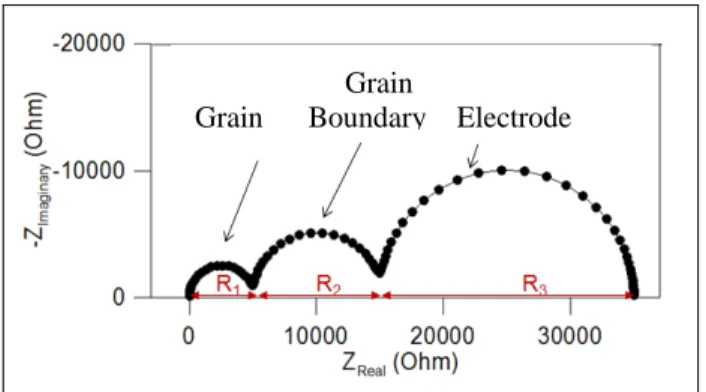
Impedance Spectroscopy Background
EXPERIMENTAL PROCEDURE
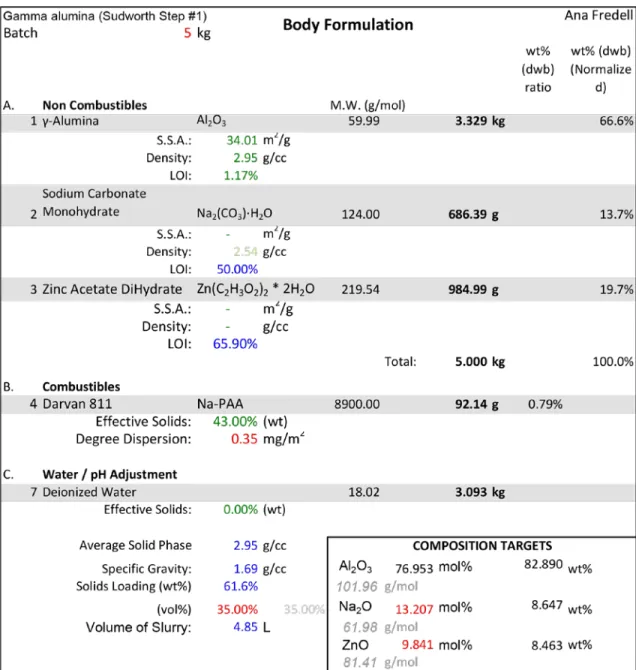
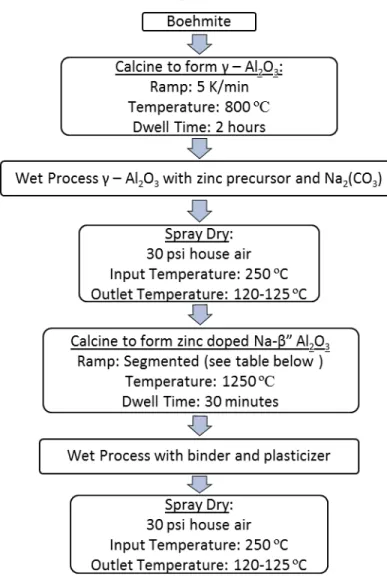
Powder Synthesis
Dehydration of boehmite resulted in the formation of γ-alumina, which served as the aluminum precursor for the compound. Second, gamma alumina has a spinel structure very similar to that of the desired beta alumina phase, making it easier to synthesize the correct phase during calcination. The aluminum range was wet processed with the remaining components of the group; zinc acetate dihydrate ((Zn(C2H3O2)2•2H2O), sodium carbonate monohydrate (Na2CO3•H2O) and Darvan 811 (Na-PAA).
It should be noted that heat treatments were performed on all precursors prior to batch calculation to accurately account for the loss on ignition (LOI) that occurs during the second calcination procedure. A small piece of graphite paper was used to hold the lid of the crucible open before calcining. After calcination, another wet processing and spray drying step was performed to introduce a binder and plasticizer into the powder, resulting in better powder flow behavior and increased green strength.
Sample Forming
Binder and plasticizer could not be introduced before calcination, as they would have burned out during heat treatment. This slurry was milled and spray dried for 1 hour using the same parameters as found in Figure 6. This resulted in the synthesis of a homogeneous zinc doped Na β” alumina with favorable powder flow and die filling.
All samples were placed between pieces of felt and vacuum packed in FoodSaver® bags to create a 'wet bag' for isostatic pressing. Samples were isostatically pressed in a 10 cm diameter isostatic press (Ilshin Autoclave, Deajeon South Korea) for 60 s under pressure up to 18 kPsi.
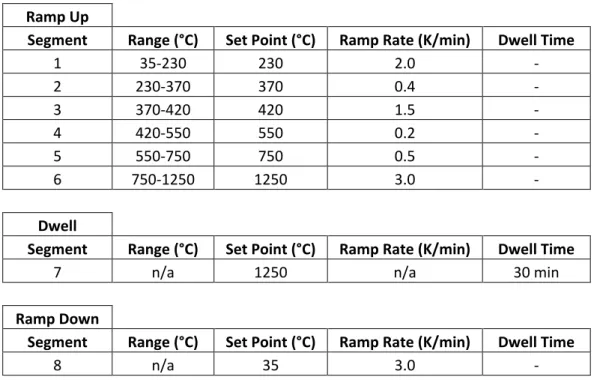
Sintering of Samples
Sintering Setup
Sintering Perameters
Density Measurments
The density of kerosene varies slightly, so the density of this particular kerosene was measured to increase calculation accuracy. Powder from each composition was collected after calcination, but before the addition of binder and plasticizer, and bulk powder density was measured using an AccuPyc II 1340 He pyknometer (Micromeritics, Norcross, GA).
SEM
Sample Preparation and Imaging Conditions
Grain Size Analysis
Impedance Spectroscopy
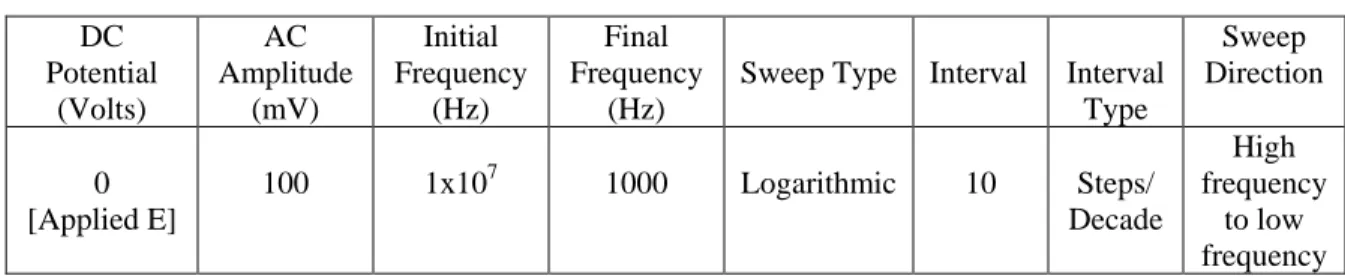
Sample Preparation and Equipment Operation
Prior to the measurements, a special template was made that compressed the sample and allowed the perimeter of the electrode to be drawn on the sample with a mechanical pencil. The electrodes were placed in the middle part of the sample, as close as possible to the center. The sample was then placed between the platinum leads of the IS fixture and the sample tested to ensure proper connection between the sample and the instrument.
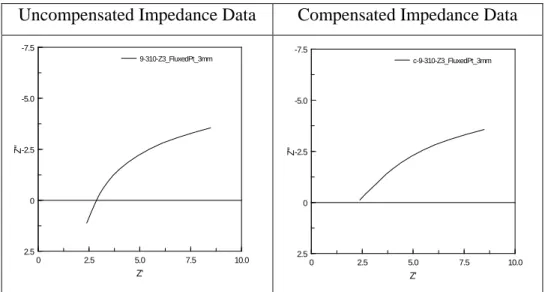
To do this, an additional sweep was performed at ambient temperatures, using the same parameters used to test the solid electrodes. If a good connection was not made, the cables were repositioned and an additional frequency sweep was performed to recheck the connection. After sample data was collected, equivalent circuit values were used to correct the impedance of the equipment cables and fixed electrodes.
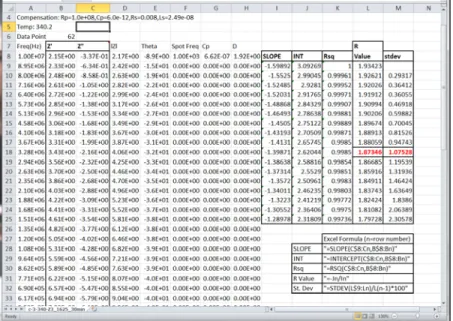
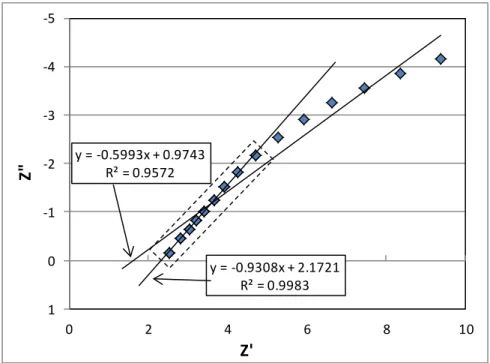
Data Analysis
Therefore, the goal was to use enough data points to be representative of the sample, while still maintaining a good fit from the trend line. The Excel program was used to calculate the running slopes and intercepts of the Z' direction. Finally, a run standard deviation was performed to monitor the standard deviation of the resistance values in the configuration up to the given frequency.
The resistance value corresponding to this point in the data was taken as the absolute resistance of the sample at that particular measurement temperature. By plotting resistance data on an Arrhenius plot with axes ln(ρ/T) vs. 1/T) determined the activation energy of the conduction mechanism in the material. When plotted in this way, determining the slope of the line created by the data allowed back-calculation of activation energy using Boltzmann's constant.
XRD
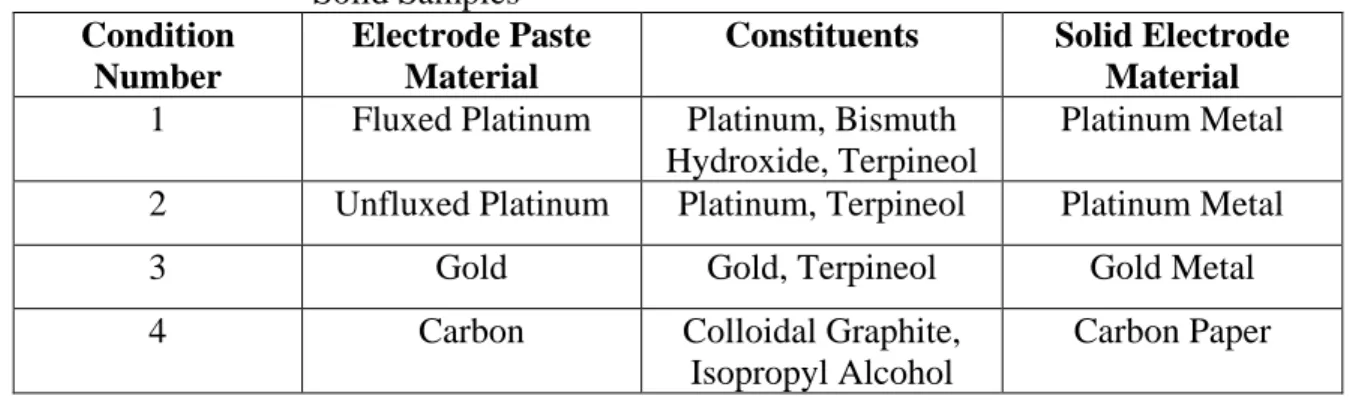
To evaluate the effect of electrode material on impedance measurements, four different electrode materials were selected. As previously discussed, both a paste and a solid component were used to create the electrode that acted as an interface between the sample and the instrument leads. Four different sample pastes and three solid components were used to create four separate sampling conditions.
For the electrode material study, these four conditions were used to measure a variety of samples, each sintered under the same conditions and printed from the same powder composition. The one parameter in this case that was kept constant was which electrode material was used to perform the impedance spectroscopy measurements. For this sample set, only one electrode setup was used; bismuth fluidized platinum paste in conjunction with a solid platinum metal electrode.
ICP
RESULTS AND DISCUSSION
Effect of Electrode Material on Impedance Spectroscopy Measurements
Example of a graph used to determine contact resistance for samples over a range of temperatures. Calculation of the cross-section for all temperatures at which the samples were measured allowed the evaluation of temperature effects on the contact resistance for different electrode materials under these conditions. It was found that the contact resistance for all four electrode materials varied with the measurement temperature.
Quantification of contact resistance in the different electrode scenarios allowed the data to be corrected accordingly. It was expected that after the data had been corrected and the contributions from the contact resistance subtracted, the resistance of a sample of zero thickness would be zero ohms. Examination of sample resistance was very useful, especially in determining the amount of contact resistance in the samples.
Excess Soda Studies
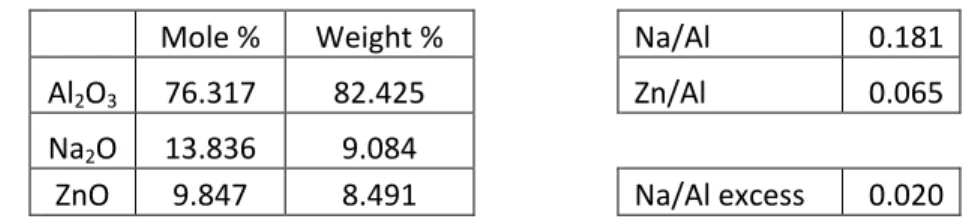
Composition
Compositions Z3 and Z4 were chosen to introduce excess soda ash into the basic beta alumina composition without changing the basic structure. This Z3 formulation introduced a small amount of excess sodium into the batch, increasing the final sodium content after production. A composition developed to incorporate a larger amount of excess soda into the base unit was the Z4 composition.
Composition effects on spray-dried granule size for the two batches are seen in the images above. Z3 compositions had an average granule size of 22.4 µm, while the Z4 composition had an average granule size of 25.1 µm. This 10% difference in average granule size did not have noticeable effects on the sintered samples.
Material Properties
XRD patterns for samples of composition Z3 comparing the relative size of the two main peaks for the secondary phase (NaAlO2) during the sintering conditions. XRD patterns for samples of composition Z4 comparing the relative size of the two main peaks for the secondary phase (NaAlO2) during the sintering conditions. We would certainly expect the Z4 formulation to have a higher sodium aluminate peak area due to the greater amount of excess sodium in the formulation.
Overall, it was not possible to quantitatively determine the relative amount of the secondary phase in these samples. It was determined that the crystallite size of the sodium aluminate material was between 400 nm and 600 nm. The size of these grains is smaller than the average grain size of β"-alumina.
Electrical Properties
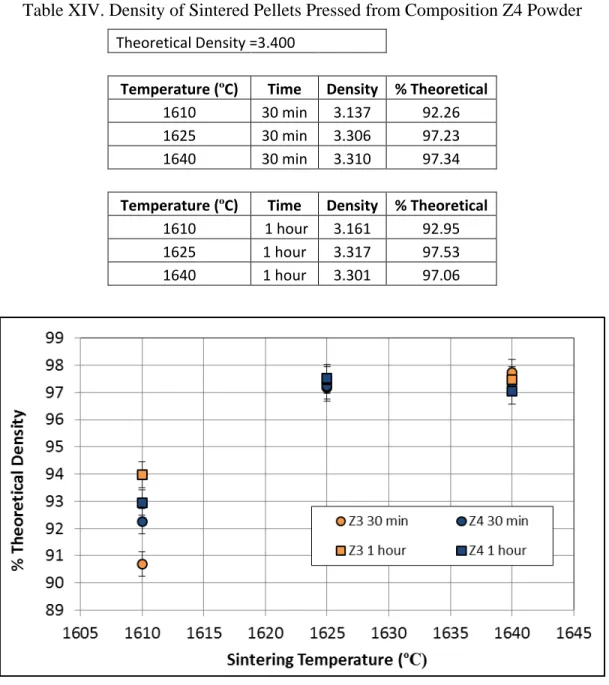
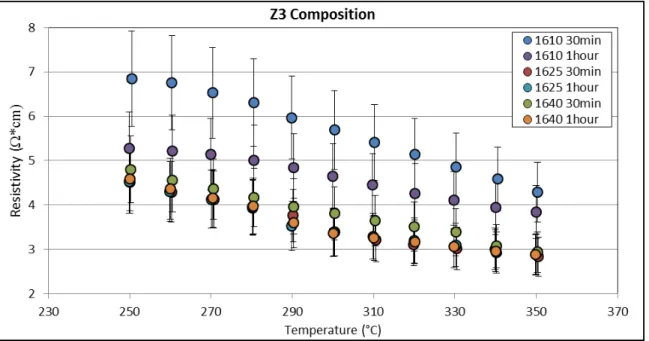
This was attributed to an increase in density and grain size for the samples sintered at higher temperatures. Samples of Z3 and Z4 compositions sintered for up to 1 hour had data at 1625°C and 1640°C very close compared to those of samples sintered for up to 30 minutes. This small variation was attributed to the difference in grain size resulting from longer sintering times.
For samples sintered from Z3 powder, the remaining samples (1625 °C, 1640 °C for 30 minutes and 1 hour) all had very similar resistance values. It was observed that samples of Z3 composition had higher overall resistance values than Z4 samples when sintered at 1610 °C. This suggested that sample composition had much less effect on the ionic conductivity of sintered samples than the effects of density and grain size.
Relationships
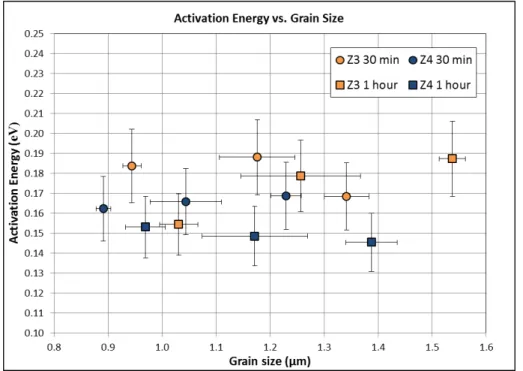
There was a linear decrease in resistivity as the grain size increased from the smallest grain size (0.891 µm) to about 1.1 µm. This indicated that the grain size affected the ionic resistivity of the material, but not the entire grain size range evaluated in this work. The correlation of grain size and activation energy for different sintering conditions and compositions is shown in Figure 36.
It was observed that the samples prepared from Z3 powders had slightly higher activation energy than those prepared with Z4 samples; however, the results were very similar. In general, it was observed that the grain size had no effect on the activation energy. It was observed that for samples of both compositions the activation energy was constant, regardless of density.
SUMMARY AND CONCLUSIONS
Effect of Electrode Material on Impedance Measurements
Effect of Composition and Sintering on Electrical Properties
FUTURE WORK
The first area will focus on measurements of electrical properties using impedance spectroscopy. Therefore, a detailed study of the use of impedance spectroscopy for the quantification of different types of conductive materials could be a very interesting area for future work. The other area that could be further investigated is the effect of higher soda ash on the formation of sodium aluminate and the performance of the sintered materials.
This study focused on small amounts of sodium excess in the system, but did not examine the effects of large sodium excesses on phase development and electrical properties. Roth, “A critical appraisal of the literature on beta alumina and related phases: I, phase equilibria and phase characterization of beta alumina,” J. Birnie, “On the structural integrity of the spinel block in the β"-alumina structure," Acta Crystallogr.