A special thank you to my parents, Mark and Jennifer Ciccarella, for their support and care of me over the past four years. Thank you to my brothers, Christopher and Dominic Ciccarella, for being the best friends I could have asked for. Thanks to my grandparents, David and Diana Bluman, for the long phone calls to talk about my day.
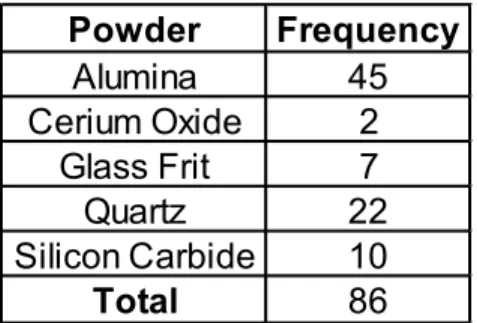
Thanks to Hyojin Lee and Dan Dalia for their assistance in obtaining the data analyzed in this study. Particle size distributions present unique challenges for analysis and presentation and simply reporting the D50 value fails to capture any information describing the width of the distribution. By fitting the particle size distribution to a statistical model, it is possible to describe a distribution with a two-parameter model, similar to that obtained from a Weibull analysis of mechanical test data.
As shown in this thesis, many native particle distributions actually fit a Weibull distribution, but when the distribution is scalped, as is common in industrial powders, the distribution is better described by a log-normal model. The two-parameter model can then be plotted on x-y coordinates to enable tracking of particle size distributions for milling studies or quality control purposes.
INTRODUCTION
In this study it was found that 64 particle size distributions fit a log normal distribution while 22 fit a Weibull distribution based on the R2 value for the linear approximation. The distributions were fitted to a plot as a point described by their D50 and the slope from a linear approximation of a log-normal distribution in order to analyze and compare different particle size distributions at once. Industrial applications of this procedure can be used for quality control applications to facilitate tracking of incoming raw particle size distributions.
This can also be used to analyze and track changes in particle size distribution during a milling study. However, if the distributor does not provide the distribution data, it is very easy to collect the data with the right equipment. This means that this method of displaying particle size distributions should have no barrier beyond simple statistical analysis software, a set of sieves and a scale.
Unfortunately, the scientific community is sitting on tons of particle size data with very few efficient ways to analyze multiple distributions at once. This would immediately allow the scientific community to look at and study particle size in a new way.
LITERATURE REVIEW
In a previous study, Kini concluded that there are only three ways in which a particle size distribution can be described statistically: as log-normal, Weibull, or neither.3 Her work suggested that the type of distribution is linked to the presence or absence of cleavage planes in the crystal. In a subsequent study, Decker concluded that Weibull distributions are more accurate in describing particle size distributions obtained directly from minification.6 However, these studies both make steps toward the graphical representation of particle size distributions linearly providing for the creation of a two-parameter model to show multiple distributions in a single plot.
EXPERIMENTAL PROCEUDURE
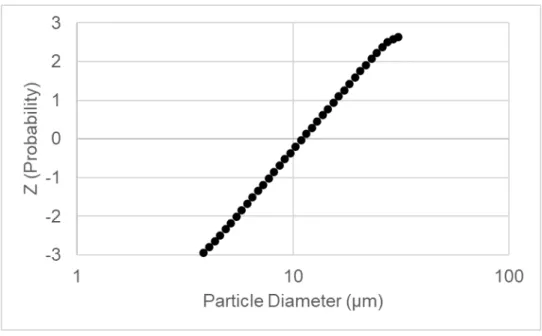
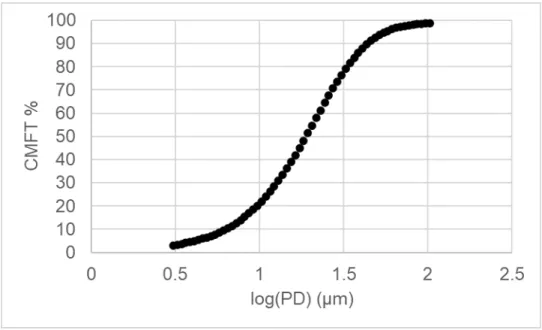
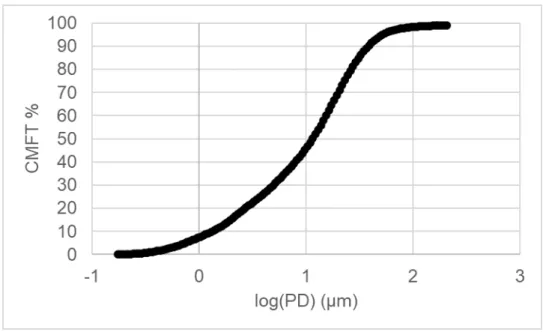
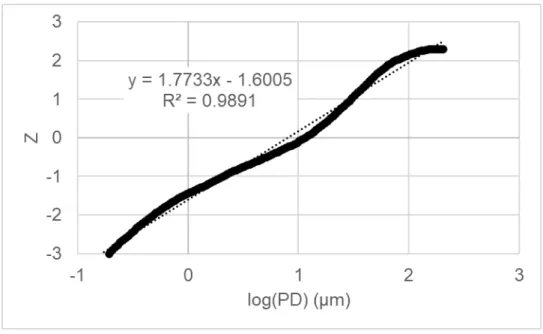
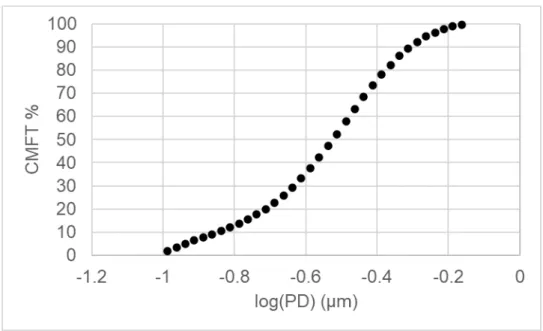
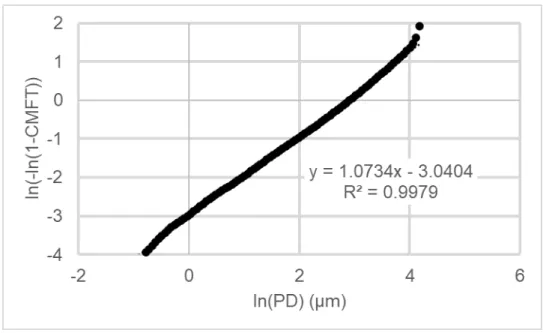
After obtaining the Z-values relative to a specific particle diameter reported by the x-ray sedimentation instrument, a plot can be produced that will provide a linear approximation of the particle size. An example of the plot is shown in Figure 1 and the equation for the Z-modulus of a log-normal distribution is shown in Equation 1. The two parameters can then be plotted against other particle size distributions for similar and different materials.
Similarly, the particle size distributions can be represented as Weibull plots, leading to the parameters analyzed being D50 and Weibull modulus. Highlighted is Z=0, where the D50 is identified as the particle size at 50% or the mean of a lognormal distribution.
RESULTS AND DISCUSSION
Log-Normal Analysis
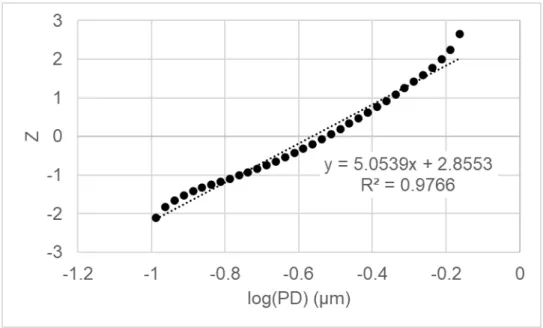
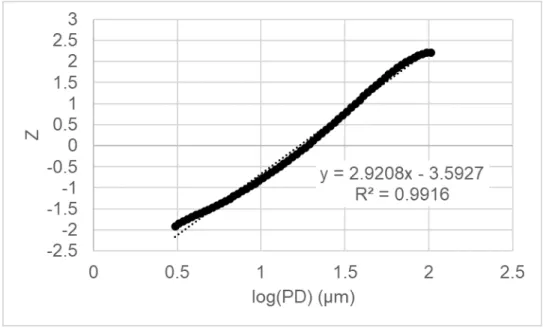
By following the procedure to convert CMFT% to a Z value, D50 and Z modulus can be collected for each evaluated data set. Included in the table is the value for R2 or the coefficient of determination, this value indicates the amount of linear association between two variables. In this case, the variables that are evaluated to indicate the R2 value are the Z value and the log particle diameter.
These parameters can be used to create a D50 vs Z modulus plot to compare multiple particle size distributions at once. Note that Figure 10 does not include the two data sets for cerium oxide as there are not enough points to adequately compare the distributions. In Figure 10 it is evident that in every case, except for silicon carbide, the Z modulus for each material remains relatively closely clustered.
This strongly suggests that a given material will exhibit a native Z-modulus which provides an opportunity to detect contamination or changes to the material, possibly through processing variations in the manufacture of the powder. Supporting evidence for this hypothesis can be gathered from the silicon carbide data sets drawn together. The increase in frequency of the Z-modulus of silicon carbide at about 4.5 may indicate that a native Z-modulus also exists there.
The function of the Z-modulus as an indicator for the behavior of the particle size distribution is also shown in Figure 3. The similarity of the different yet different Z-moduli suggests that the A3000 aluminum is produced with, or scalped, significantly tighter . distribution of A-16 S.G.
Weibull Analysis
By converting CMFT% to Weibull axis values, the D50 and slope can be collected for each dataset evaluated. In this case, the R2 value is the result of comparing the relationship between the Weibull value and the natural logarithmic particle diameter. The graphs in Figures 20 and 21 illustrate similar properties to those shown using lognormal graphs to represent the data sets.
This suggests that both particle size distribution display methods can display data with relatively similar results.
Scalped Distributions
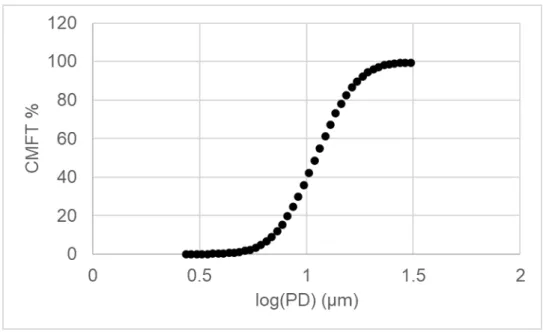
The same particle size dataset for quartz is shown in Figure 23 as a log-normal distribution. The linear approximation is relatively poor compared to the fit of the Weibull plot. This trend probably means that a better log-normal linear approximation should be obtainable by scalping the same distribution.
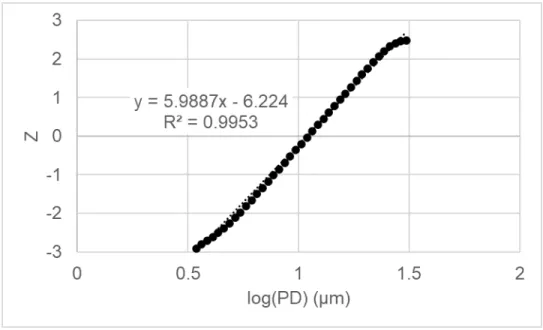
In Figure 24, the same data set is scalped, removing particles smaller than 3.0 μm and larger than 30 μm to simulate industrial scalping (based on particle size). A scalped quartz data set plotted as a Weibull distribution, illustrating that the fit is worse than observed for log-normal (in Figure 24). This difference in fit for the linear approximation would suggest that for the same data set, an original distribution is best represented as a Weibull distribution, and a scalped distribution is best represented using log-normal analysis to determine the Z-modulus.
The difference in Z modulus and Weibull modulus between the original and scalped distributions is indicative of the properties shown by the respective modulus, i.e.
SUMMARY AND CONCLUSIONS