Increasing the energy in the crystal lattice allows the phase transition temperatures to be constructed, from the Clausius-Mossotti relation. I was fortunate to work with the current professor of the Electronic, Magnetic and Optical Properties class, Dr. I was able to gain more hands-on experience in the laboratory, working with the materials and new testing equipment.
I also learned how to be more motivated, knowing that if I didn't work on my thesis, I would regret it in the long run. The team meetings were effective and I was able to learn about the work of the other senior students.
Energy Storage Materials and Devices
The anode keeps active ions, molecules or atoms in a relatively high energy state, and the higher the energy state, the greater the resulting voltage of the battery. Once the anode oxidizes and discharges to the cathode, the energy of the ion is greatly reduced. The potential difference of the electrochemical reactions determines the amount of charge storage in a battery.
![Figure 1: Ragone plot of some energy storage technologies [1], modified through hypothetical energy density from increasing the breakdown strength of the capacitor, as indicated by the dashed rectangles](https://thumb-ap.123doks.com/thumbv2/123dok/10515959.0/13.918.238.711.107.443/technologies-modified-hypothetical-increasing-breakdown-capacitor-indicated-rectangles.webp)
BaTiO 3
Dipole moments also occur when the positive nucleus of the atom moves in the positive direction of the applied field, shifting the negative electron cloud. In Figure 4b, note the shift of the center titanium ion position, which changes the crystal symmetry. This shift results in permanent polarization of the unit cell, which can be aligned to provide the maximum saturation polarization by exposure to an appropriately strong electric field, with large remanent polarization remaining in the absence of an electric field for.
Double perovskites have the same 12 coordination sites, with two different ions in the B sites at the cube center, doubling the unit cell of a typical cell. In this case, Zn is in the center of one subunit cell of the doubled perovskite, and W is in the central ion in the other, alternating to form the doubled perovskite, shown in Figure 6 [14]. It is important to note this structure upon substitution in a single perovskite to understand the location and nature of the dipoles in BaTiO3.
The rheology of the material determines the molding technique to create the desired shape, composition and microstructure. The synthesis of dielectric materials depends on the desired reaction phases and the atoms present, as well as the atomic arrangement in the structure, which determine the permeability of the material. In addition, increasing the breakdown strength of the capacitor material increases the power density and energy density of capacitors, so they can become larger than batteries.
In contrast, the two-step process leads, by careful control, to stoichiometric BaTiO3 and Ba2ZnWO6 whose proportions will lead to charge-neutral stoichiometric dipole-substituted materials regardless of the mixing ratios.
![Figure 3: Electronic polarization of an atom [7].](https://thumb-ap.123doks.com/thumbv2/123dok/10515959.0/17.918.195.747.789.944/figure-3-electronic-polarization-atom-7.webp)
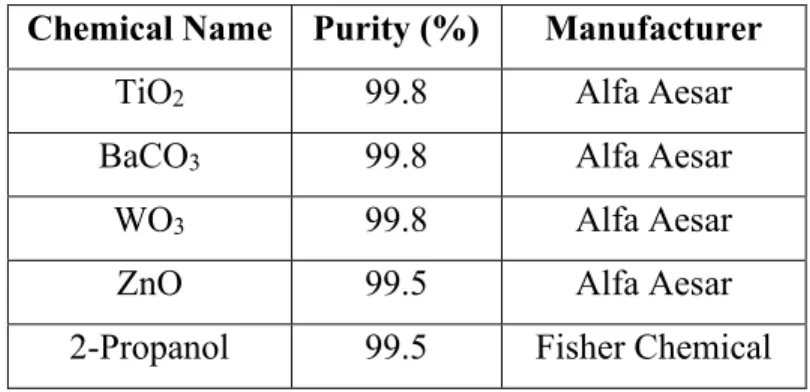
Batching BaTiO 3
Batching Ba 2 ZnWO 6
Dipole Substitution
Sintering
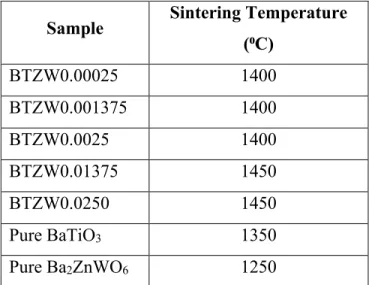
Pellets were vacuum sealed in plastic bags, then placed in a cold isostatic press (CIP) (Autocave Engineers, Erie, PA) and pressed to 27,000 psi (186,200 kPa). After CIP, the pellets were sintered at the temperatures listed in Table 5, all for 25 hours of holding at a heating and cooling rate of 5 ⁰C/min. Note that it has been reported from previous research that as the concentration of dipoles in BaTiO3 increases, the sintering temperature increases to compensate for the increasing grain surface energy; smaller grains with increasing dipole concentration for a given temperature require higher sintering temperatures for densification.
Characterization and Structure
Resistivity Measurements
Permittivity Measurements
Spectroscopy
Microstructure
Crystal Structures
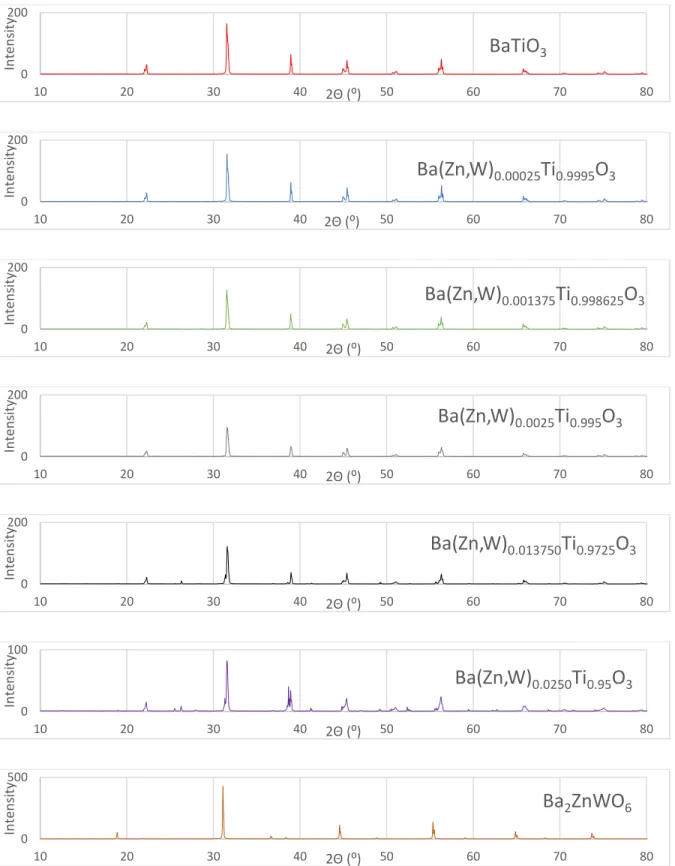
The additional peaks indicate a changing crystal structure due to the increase in energy introduced by the dipole pairs, which reduces the overall symmetry, as these samples change to resemble the double perovskite parent material more than pure BaTiO3. Additional peaks may also indicate an additional phase that may occur as the samples transition from perovskite to double perovskite structures and have a transition or intermediate phase. Based on the XRD measurements of each sample, the unit cell expansion and lattice constant changes were determined.
Normally this data is calculated using Reitveld Refinement, based on BaTiO3 peaks in Figure 10 below. There was a strong peak fit with the BaTiO3, but for the small peaks from the dipole additions there was no match. This peak fitting technique was inaccurate for samples with higher dopant concentration, with some peaks missing completely due to the changing crystal structure observed by increasing the energy in the form of adding dipoles.
Therefore, the data from this method did not follow the expected trend of increasing volume with increasing dopant concentration. In Figure 11, the increase in unit cell volume shows that the trend for the c/a ratio follows the prediction that dipole doping adds energy, so the unit cell grows to accommodate the dipole energy. When there is a change in structure for BTZW0.01375 and BTZW0.02500, there is initially a slight decrease in the unit cell volume because the new structure accommodates the additional energy through structural rearrangement and binding energy conservation, which can result in a smaller unit cell volume.
Microstructure
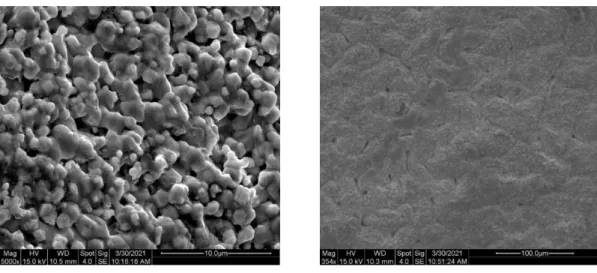
For BTZW0.01375, BTZW0.0250, shown in Figure 14, crystallites are formed at the grain boundaries, indicating that the extra peaks in the XRD pattern may be a secondary phase. Under higher magnification, the ceramic phase has an approximate grain size of 1 μm for both samples, which is consistent with previous dipole replacement materials where grain size decreases with increasing dipole concentration, due to the high surface area formed to withstand the dipole energy.
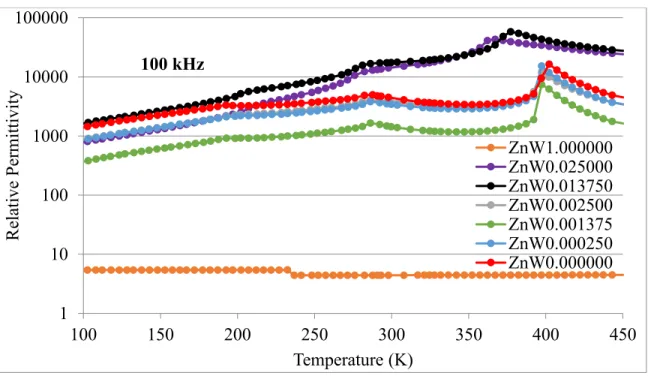
Dielectric Permittivity
Compared to previous research, the changes in Tc and variations in magnitude of relative permittivity are much larger than previous 3+, 5+ dipole pair investigations, presumably from the higher strength dipoles used in this work [10]. If the polarizability of the dipole pair of this work Zn-W is greater than the polarizability of the Ti-Ti pair they replace, then Tc must increase and Tc must separate from Tm. The dielectric loss factor occurs when an alternating field is applied to a material, and the inertia and impedance align with the electric current, resulting in what is known as the electrical energy dissipation factor or loss tangent [7].
Dielectric losses for the samples studied are indicated in Table 6, where the dissipation factor was measured at different frequencies as a function of temperature. The material with the highest average loss factor is BTZW0.0250, and BTZW0.01375 was the second highest average loss factor. The other samples had the same relative values with small losses, but the most variation in loss with frequency was BTZW0.0250, which has the highest concentration of Zn-W dipoles.
Note that the same sample has a higher dissipation factor and a higher relative permittivity measurement than the pure barium titanate. Therefore, more wavelengths of energy are stored, but there is more loss per wavelength in BTZW0.025. It is possible to make BTZW0.025 physically smaller than pure barium titanate; at a certain size, the increased energy storage from BTZW0.025 outweighs the higher loss tangent.
If the BTZW0.025 had a loss tangent like that of barium titanate, the physical size of the capacitor could be even smaller with the same energy storage capacity as pure BaTiO3.
Electrical Resistivity
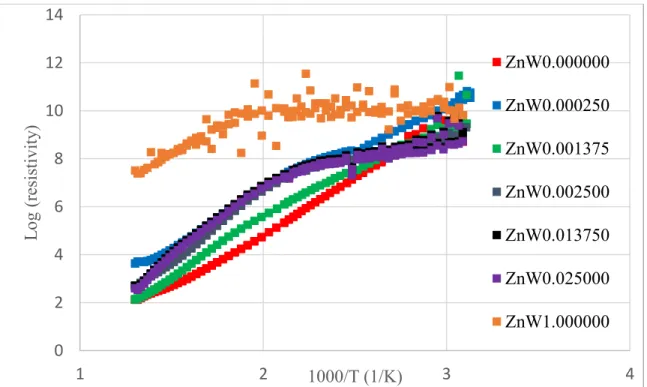
Ultimately, the nanoscale dipole fields may appear to act as localized p-n junctions that resist the flow of both electrons and holes. Overall, the resistivity at room temperature is between 1011 Ω·m and 109 Ω·m for all samples; increased over that of BaTiO3, which contradicts the teachings of semiconductor theory by adding donors and acceptors in equal proportions. Resistivity trends for the samples with varying dipole concentrations change as temperature varies.
The resistance of BTZW0.001375 is lower, and pure BaTiO3 has the lowest resistance of all samples at high temperature. At lower temperatures, between 300 K and 400 K, there is more variation in the resistance data for each individual sample. The changes in slope for the resistance limits may be due to grain boundary activation energy being measured, rather than the bulk activation energy.
To measure resistance, the current desires to travel the path of least resistance, so the grain boundary resistance most likely dominates the resistance measurement. The change in slope shown for the pure double perovskite at 500 K may be an artifact due to the limitations of resistance measurements, where a higher applied voltage or thinner sample would increase the signal-to-noise ratio for more precise data. The higher the slope of the line at high temperatures, the greater the activation energy.
Slope position differs for each material due to the scattering factor, but it does not change the activation energy.
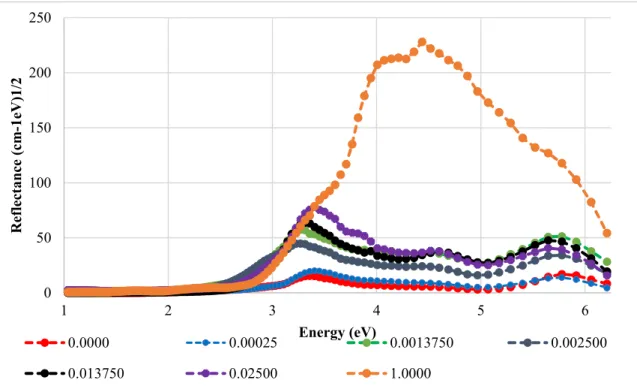
Optical Band Gap
The data are not consistent with this ratio and may be due to the nature of the measurements. Resistance is supposedly measured through the bulk of the material, although it wants to travel along the path of least resistance. From this behavior, the resistivity was most likely measured through the grain boundaries of the material.
UV-Vis measures the bulk of the material, does not see the grain boundary, which is much smaller than the wavelength of light, and is a more accurate representation of the band gap energy. This may be due to the samples mimicking the properties of the parent material they most closely resemble. The dipoles are associated with an increase in relative permittivity at low concentrations, which may allow these materials to be made at a smaller volume and possess a higher energy density, since pure BaTiO3 assumes that the breakdown strength of the material is unchanged from that of of BaTiO3.
Future work with these specific materials includes high-temperature XRD to differentiate Tm from Tc in relative permittivity data, sintering at different temperatures to prevent crystallization of high dipole concentration samples, and increasing the density and purity of materials through the best laboratory processing. It would be intriguing to perform this study also at different dipole concentrations, for comparison and better understanding of the material's behavior. Solid Oxide Fuel Cells: Principles, Designs, and State-of-the-Art Technologies." Recent Trends in Fuel Cell Science and Technology, 2007, p.
What is the mechanism of change in capacitance of ceramic capacitors over time? Murata Manufacturing Co., Ltd., www.murata.com/en-global/support/faqs/capacitor/ceramiccapacitor/char/0013.
![Table 1: Comparison of the characteristics of various battery chemistries [3]](https://thumb-ap.123doks.com/thumbv2/123dok/10515959.0/14.918.112.812.290.634/table-1-comparison-characteristics-various-battery-chemistries-3.webp)
![Figure 2: Schematic of SOFC electrochemical energy generation principles and operation [5]](https://thumb-ap.123doks.com/thumbv2/123dok/10515959.0/15.918.292.687.107.310/figure-schematic-sofc-electrochemical-energy-generation-principles-operation.webp)
![Table 2: Comparison of Electrochemical Double Layer Capacitor (EDLC), pseudocapacitors, and hybrid capacitors [6] (reformatted)](https://thumb-ap.123doks.com/thumbv2/123dok/10515959.0/16.918.117.799.185.558/table-comparison-electrochemical-double-capacitor-pseudocapacitors-capacitors-reformatted.webp)
![Figure 4: (a) Cubic and (b) tetragonal BaTiO 3 structures [7].](https://thumb-ap.123doks.com/thumbv2/123dok/10515959.0/18.918.185.793.469.687/figure-4-cubic-b-tetragonal-batio-3-structures.webp)
![Figure 5: Temperature dependent phase transitions corresponding to relative permittivity of BaTiO 3 [11]](https://thumb-ap.123doks.com/thumbv2/123dok/10515959.0/19.918.226.758.484.740/figure-temperature-dependent-transitions-corresponding-relative-permittivity-batio.webp)
![Figure 6: Double perovskite Ba2ZnWO6 structure, with Ba represented by the green spheres, O the red, Zn the blue and W the purple [14]](https://thumb-ap.123doks.com/thumbv2/123dok/10515959.0/20.918.350.614.610.904/figure-double-perovskite-ba2znwo6-structure-represented-spheres-purple.webp)
![Figure 7: Ceramic processing steps and the corresponding characteristics [15].](https://thumb-ap.123doks.com/thumbv2/123dok/10515959.0/21.918.179.788.517.678/figure-7-ceramic-processing-steps-corresponding-characteristics-15.webp)