A Thesis Presented to The Faculty of Alfred University
Nanoscale Dipole Engineering of BaTiO3 Using Y+3-Ta5+ Dipoles by
Victoria R. Pellegrino
In partial fulfillment of the requirements for
the Alfred University Honors Program
May 2021
Under the Supervision of:
Chair: Dr. Steven C. Tidrow, Inamori Professor of Materials Science and Engineering
Committee Members:
Dr. Kaijie Ning, EIP Research Scientist Mr. Jordan Crouch, Life Skills Coach
ii
HONORS INTRODUCTION
I was beginning my junior year of high school when I injured my ankle and could not play my tennis season. My mom decided a responsible use of my newly freed up time would be to visit colleges. Alfred University was the first scheduled visit, and I did not want to go, did not want to sit in the car for 3+ hours. And once we finally arrived, we realized we read the website wrong, and AU did not even have the program I was looking for. However, by the end of the tour I had fallen in love with the university and decided to pursue a degree in materials science and engineering. We cancelled my remaining college tours and I applied early decision in the Fall of my senior year of high school. My time at Alfred has been so enjoyable and educational that I will be beginning my journey in the ceramic engineering master’s program in the Fall.
I developed an interest in electroceramics, ceramic materials produced for use in electronics, when a friend of mine told me about his senior thesis, which was very similar to mine. He was working with Dr. Tidrow and I asked if Dr. Tidrow if he would be my advisor as well, since he is the head of the electroceramics group here at Alfred University. The semester after beginning my thesis I took an electroceramics elective with Dr. Pilgrim which allowed to me develop a larger understanding of their components and usage. Unfortunately, I lost some time in the lab due to the COVID-19 pandemic, but I was able to get back on track and complete a thesis that I am proud to present.
This thesis and experiment were executed with the objective of increasing the electrical energy storage capabilities of barium titanate (BaTiO3) ceramic capacitors by using pairs of yttrium and tantalum atoms known as dipole pairs. Capacitors are used in many electronics and they serve the purpose of storing and then releasing electrical charge. To create the final
iii
substituted materials, a two-step process was utilized. This two-step process involves creating two parent materials, BaTiO3 and a double perovskite featuring the cations in the dipole pairs, separately, and then combining them in the proper ratios to create the substituted samples at five different dipole concentrations. To create the BaTiO3. I mixed barium oxide, titanium oxide, spherical milling media made of yttrium stabilized zirconia and isopropyl alcohol in the appropriate proportions in a plastic bottle and allowed the bottle to roll on a mill for 24 hours.
Once the milling was complete, the milling media was removed, and the mixture was dried, manually broken up, and pressed into pellets. The pellets were pressed using a uniaxial press which involved loading the powder into a cylindrical metal die and then pressing the powder down with 22,241 Newtons of force. They were then calcined at 1200°C to burn off oxygen from the material, leaving pure BaTiO3. The pellets were then ground with a mortar and pestle and sieved to a 150micron particle size, a processes which took several hours as the calcined BaTiO3
was very hard A small portion of the BaTiO3 was set aside before grinding for x-ray diffraction analysis (XRD). X-ray diffraction involves using a beam of x-rays to collect information of a material such as its crystal orientations, lattice parameters, and the compositions of the phases present and was utilized in this instance to verify the crystal structure, lattice parameter and the completion of the calcination process the powder. By repeating the aforementioned procedure, the second parent material was created by mixing the sieved BaTiO3 powder yttrium oxide and tantalum oxide to create a double perovskite material, Ba2YTaO6, which was used to substitute Y3+-Ta5+ dipole pairs for Ti4+-Ti4+ dipole pairs in pure BaTiO3. This material was calcined at 1500°C for 25 hours to create a single phase material. The two parent materials were then combined in the appropriate ratios to create five samples of barium titanate with different fractional substitutions of yttrium-tantalum dipole pairs based on the chemical equation
iv
Ba[(Y3+,Ta5+)xTi1-2x]O3 with 0.0000≤x≤0.0500, This experiment used x values 0.0025, 0.0050, 0.0100, 0.0250, and 0.0500. The mixtures were calculated to be 40g each after sintering. The milled samples were dried, then ground and sieved as before and pressed into pellets. These pellets were then sealed in a FoodSaver food sealer twice. Care was needed when executing this process to avoid damaging the pellets when inserting them into the bags to be sealed. The purpose of sealing the samples twice was to give them an extra barrier in case one of the bags opened while in the cold isostatic press, which involves having samples submerged in water. The purpose of the cold isostatic press was to compress the samples in all directions, not just one direction like the uniaxial press. The press is full of cold water that is then put under pressure which, in turn, applies pressure to the samples. Unfortunately, all of the samples cracked under the pressure of the press forcing them against each other in the sealed bags. Fortunately, there were pieces that were large enough to be able to finish the experiment.
The large pieces that remained were sintered in air, with the x=0.0000 being sintered at 1350°C for 25 hours, x=0.0025, 0.0050, and 0.0100 being sintered at 1400°C and the x=0.0250 and 0.0500 samples being sintered at 1500°C for 25 hours. Higher temperatures were needed for the samples with a higher fraction of substitution in order to obtain a single phase material. The samples underwent XRD analysis to verify that all the materials had a single phase, and to give the lattice parameters of the samples. The samples were also observed through a scanning
electron microscope (SEM) to observe the microstructure of each sample, specifically the size of the grains. It was seen that the BaTiO3 had the largest grain size of all the samples and the average grain size decreased with increasing dipole pair concentration. The SEM analysis also observed a change in structure with x≥0.0250. One final analysis was done on the sintered pellets before the electrical characterization, ultra-violet, visible and infra-red light (UV-Vis-IR)
v
spectroscopy analysis, which examines how light interacts with a sample. This analysis allowed for the collection of activation energy and bandgap data which directly relates to the amount of energy that can be stored in the materials. The remaining electrical analysis to find the resistivity and relative permittivity of the materials could only be performed once the samples were
electroded with a silver conductive paste, to make the materials conductive. An LCR (Inductance, Capacitance, Resistance) meter was used to find the capacitance of the five
substituted materials, and the pure parent materials at 100Hz, 1KHz, 10KHz, 100KHz and 1MHz from approximately 125°C to 450°C. This capacitance measurement can be used to calculate the resistivity of the materials. The LCR meter was also used to take resistivity measurements between approximately 50°C and 490°C.
The outcomes of the several forms of analysis are in line with previous nanoscale dipole engineering experiments performed by the electroceramics research group here at Alfred
University. Differences between the results from this and previous research could be attributed to the larger size of the Y3+ cation used in this experiment as it is larger than the cations used in previously studied dipole pairs. These results of the analysis were very promising. The resistivity of the materials generally decreased with increasing dipole pair concentration while the
permittivity increased with increasing dipole concentration. Both of these changes in parameters make Ba[(Y3+,Ta5+)xTi1-2x]O3 with 0.0000≤x≤0.0500 a promising material in applications where reduced size, weight and volume are required of the material within in electroceramic device.
Future work for this experiment could include temperature dependent XRD to observe how the structural parameters of the materials change with increasing temperature. Transmission electron microscopy (TEM) could be performed to help identify the positions of the Y3+-Ta5+
dipoles, and whether or not they are randomly dispersed or cluster, whether core-shells exist in
vi
these materials. I hope to be able to perform these analyses and take a further look into the properties of these created materials with my graduate work.
As previously mentioned, capacitors are used in an almost infinite number of electronics, and the research done in this thesis has shown that these new materials can store energy in a smaller volume. I hope to see this new technology be put to use in medical equipment. With medical procedures becoming more and more precise, it is important to have materials that can be utilized in smaller volumes. Alternatively, these materials can be used at the same volume as current materials, but would be able to hold more charge, increasing the life of some medical- grade electronics.
vii
ACKNOWLEDGMENTS
I would like to express my sincerest gratitude to Dr. Tidrow for his guidance and assistance in the completion of this thesis. His shared is knowledge and experience greatly helped my understanding of the engineering of electroceramics. His leadership has helped me grow academically and given me the confidence to further my education. I would also like to thank Dr. Ning for his guidance both in and out the laboratory. His readiness to assist with my comprehension of the topics of this thesis is deeply appreciated. I also thank my professors, peers, teammates, and coaches for standing with me throughout my time at Alfred University, and for helping me thrive both academically and socially. I thank my family for their endless support throughout this journey. Thank you for all the visits, cards and care packages that helped me make it through. And, finally, I thank my parents for their unwavering support through this entire adventure. Thank you for helping and guiding me to be the person I am today.
viii
TABLE OF CONTENTS
HONORS INTRODUCTION ... ii
ACKNOWLEDGMENTS ... vii
TABLE OF CONTENTS ... viii
LIST OF TABLES ... ix
LIST OF FIGURES ...x
ABSTRACT ...1
INTRODUCTION ...3
EXPERIMENTAL ...7
RESULTS AND DISCUSSION ...13
CONCLUSIONS AND FUTURE WORK ...36
REFERENCES ...38
ix
LIST OF TABLES
Table I - Dopant Concentrations of the Processed Samples ...9
Table II - Masses of Pressed Pellet Samples ...10
Table III - Fitting parameters of primary permittivity peaks for x=0.0000, 0.0025, 0.0050, 0.0100, 0.0250 and 0.0500 at 1MHz ...17
Table IV - Bandgap energy values of Ba[(Y3+,Ta5+)xTi1-2x]O3 with 0.0000≤x≤0.0500 ...21
Table V - Activation energies of Ba[(Y3+,Ta5+)xTi1-2x]O3 with 0.0000≤x≤0.0500 ...22
Table VI - Resistivity values at two different temperatures; 150°C and 400°C ...25
x
LIST OF FIGURES
Figure 1 - Cubic unit cell of BaTiO3 ...4
Figure 2 - Plot of relative permittivity against temperature for Ba[(Y3+,Ta5+)xTi1-2x]O3 with 0.0000≤x≤0.0500 at 100Hz ...15
Figure 3 - Behavior of primary permittivity peak for x=0.0000 ...16
Figure 4 - Behavior of primary permittivity peak for x=0.0025 ...16
Figure 5 - Behavior of primary permittivity peak for x=0.0050 ...16
Figure 6 - Behavior of primary permittivity peak for x=0.0100 ...16
Figure 7 - Behavior of primary permittivity peak for x=0.0250 ...17
Figure 8 - Behavior of primary permittivity peak for x=0.0500 ...17
Figure 9 - Plot of optical bandgap used to derive bandgap energies ...21
Figure 10 - Arrhenius plot of resistivity against temperature for Ba[(Y3+,Ta5+)xTi1-2x]O3 with 0.0000≤x≤0.050 ...24
Figure 11 - XRD data for all substituted samples and parent materials ...26
Figure 12 - Microstructure of BaTiO3 at 2500x magnification ...28
Figure 13 - Microstructure of Ba2YTaO6 at 2500x magnification ...29
Figure 14 - Microstructure of Ba[(Y3+,Ta5+)xTi1-2x]O3 with x=0.0025 at 2500x magnification ..30
Figure 15 - Microstructure of Ba[(Y3+,Ta5+)xTi1-2x]O3 with x=0.0050 at 2500x magnification ..31
xi
Figure 16 - Microstructure of Ba[(Y3+,Ta5+)xTi1-2x]O3 with x=0.0100 at 2500x magnification ..32 Figure 17 - Microstructure of Ba[(Y3+,Ta5+)xTi1-2x]O3 with x=0.0250 at 1000x magnification ..33 Figure 18 - Microstructure of Ba[(Y3+,Ta5+)xTi1-2x]O3 with x=0.0500 at 1000x magnification ..34 Figure 19 - Average grain size of Ba[(Y3+,Ta5+)xTi1-2x]O3 with 0.0000≤x≤1.0000 ...35
1 ABSTRACT
Electric-field dipole engineering at the nanoscale (E-DENS) allows scientists and engineers to investigate and modify the electric-field interactions of atoms at the atomic level and determine how those interactions affect material properties. To further elucidate this construct, dipole pairs of Y5+-Ta5+ have been substituted for pairs of Ti4+ in barium titanate (BaTiO3), using the formula Ba[(Y3+,Ta5+)xTi1-2x]O3 with 0.0000≤x≤0.0500, to maintain charge neutrality. BaTiO3 is prominently used in the production of ceramic capacitors, due to its ability to store electrical charge in reduced size, volume, and weight. Since Y+5 and Ta+3 each are more polarizable than Ti4+ and since dipole formation of Y+5-Ta+3 pairs add additional energy into the lattice, the newly formed materials are anticipated to behave similar to previously reported E- DENS materials, where dipole pairs Ga3+-Ta5+, transformed BaTiO3 from ferroelectric to diffuse phase to relaxor-like material within a solid solution range Ba[(Ga3+,Ta5+)xTi1-2x]O3,
0.0000≤x≤0.05001. Compared with Ga3+, Y3+ is a cation that possesses higher polarizability (3.84 Å3 versus 1.50 Å3) and larger ionic radii (1.040 Å versus 0.76 Å) with radii no longer able to freely fit and move within the same octahedral cage in which Ti4+, Ga3+ and Ta5+ may “rattle”.
Hence, although the dipole strength using Y3+ in place of Ga3+ with Ta5+ should be roughly the same, though slightly reduced due to separation distance from constraints of Y3+, use of Y3+, as indicated by the new simple material model including Clausius – Mossotti relation, is anticipated to increase Tm and Tc, while the dipole interaction is expected to result in roughly the same concentration dependent diffuseness (slightly less diffuseness due to anticipated slight decrease in dipole field strength). Further, due to the strength of the dipole field, the lattice parameter Ba[(Ga3+,Ta5+)xTi1-2x]O3 is expected to be larger and expand more quickly than
Ba[(Y3+,Ta5+)xTi1-2x]O3. Room temperature x-ray diffraction was performed throughout the experiment to verify crystallinity and lattice parameters. UV-VIR-NIR data was collected to
2
determine the energy bandgap of the doped materials to compare it to pure BaTiO3, along with temperature dependent resistivity to determine activation energy, and temperature dependent LCR analysis to determine relative permittivity, and dielectric loss of the substituted and parent materials.
3
INTRODUCTION
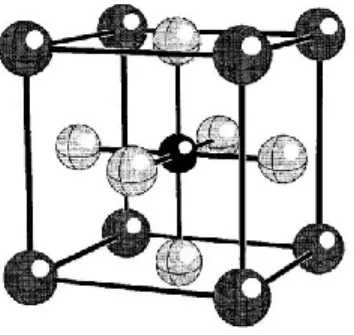
Barium titanate (BaTiO3) was the first ceramic material that ferroelectric behavior was observed in2. This ferroelectric behavior has since been monopolized for the production of multi- layer capacitors, which are used to store electric charge in electronic devices and systems. The exhibited ferroelectric properties are a result of spontaneous polarization which can be attributed to the perovskite structure of BaTiO3. The “ideal” perovskite structure features an ABX3
chemical formula and a cubic unit cell, Figure 1. For BaTiO3 the A-sites are occupied by Ba2+
cations, the B-site is occupied by a single Ti4+ ion in the center of the cube, and the C-sites are occupied by O2- cations3. The A-sites are located at the eight corners of the unit cell and the C- sites are located at the center of each of the six faces of the cube3. The previously mentioned spontaneous polarization is due to the polarizability of the titanium atom at the center of the cubic unit cell4. Spontaneous polarization for a randomly oriented polycrystal generally gives a net zero polarization, though the grains in the polycrystal are polarized but the randomness of the polarization gives the fields a near net zero polarization5. Spontaneous polarization of single crystal domain and polycrystalline materials can occur by the application of an electric-field to that is strong enough to pole the material. Poling the material results in a permanent net dipole moment, which occurs via remnant polarization that remains in the material until it is heated above its Curie temperature, Tc, the temperature below which spontaneous polarization occurs on the material5.
4
Figure 1: Cubic unit cell of BaTiO34
The BaTiO3 perovskite structure, which is formed at high temperature, undergoes phase transitions with decreasing temperature. These transitions occur due to the aforementioned spontaneous polarization or temperature induced spontaneous polarization5. Presently, BaTiO3 is prominently used in the production of ceramic capacitors, due to its ability to store electrical charge. It is the various phases that BaTiO3 can be present in that allows it to be so useful in the field of electroceramics. When BaTiO3 is below its Curie temperature, 403K, it has a non-central symmetric structure, which can be polarized:
𝑹𝟑𝒎𝟐𝟏𝟖 𝑲↔ 𝑨𝟐𝒎𝒎𝟐𝟕𝟑 𝑲↔ 𝑷𝟒𝒎𝒎𝟒𝟎𝟑𝑲↔ 𝑷𝒎𝟑̅𝒎
where 𝑅3𝑚 is a rhombohedral structure, 𝐴2𝑚𝑚 is an orthorhombic structure, 𝑃4𝑚𝑚 is a tetragonal structure and 𝑃𝑚3̅𝑚 is a cubic structure.
Barium titanate is also classified as a ceramic dielectric. Dielectric materials do not conduct electricity well; therefore, they have the ability to gain and store energy through the capacitive effect which has a linear dependence on the permittivity of the material5. The relative permittivity of isotropic materials is governed by the Clausius-Mossotti (C-M) relation5. The C- M relation was originally derived for isotropic materials and has an analogous anisotropic C-M
5
relation that can be used for non-isotropic crystal structures5. The isotropic C-M relation can be expressed as:
𝜀𝑟 =3𝑉𝑚+ 8𝜋𝛼𝑡
3𝑉𝑚− 4𝜋𝛼𝑡 Eq. 1
where εris the relative permittivity of the material, αt is the total polarizability of atoms in Å3 inside the molar volume Vm in Å3. Relative permittivity is an intrinsic material property, and is the measure of the capacity of a material to store electrical charge relative to free-space5.
The permittivity of BaTiO3 is another reason it is used for capacitors. Permittivity refers to the proportional constant between the dielectric displacement, the magnitude of charge per unit area of a capacitor plate, and the electric field on a material3. The relative permittivity of a material, 𝜀𝑟, is the ratio of the electric permittivity of a material to the permittivity of free space, 𝜀0, with: 𝜀0 = 8.854𝑥10−12 F/m2. The permittivity, 𝜀 = 𝜀0𝜀𝑟, of capacitive materials is related to the energy storage density, μ (J/m3) as expressed by:
𝜇 =1
2𝜀0𝜀𝑟𝛽2 Eq. 2
where β (V/m) is the breakdown strength if the materials with the other variables previously defined.
In past years, experimentation with adding dipole pairs to BaTiO3 to increase both energy storage and the Curie temperature of the material have proven successful. To take a further look into this concept, this thesis report’s experimental data and analysis of Y3+-Ta5+ dipole pairs substituted in BaTiO3 with the goal of increasing resistivity, relative permittivity, and the Curie temperature of BaTiO3. The formula for this substitution is:
6
𝐵𝑎(𝑌3+, 𝑇𝑎5+)𝑥𝑇𝑖1−2𝑥𝑂3 Eq. 3
The importance of using Y3+ and Ta5+ as the dipole pairs is due to their ionic charge. The Ti4+ ion pair that is being substituted for must possess the same equivalent overall charge to maintain charge neutrality. The average charge of the dipole pair is equal to the charge on the titanium ion. Main observations will include how the substituted material’s properties differ from the properties of pure BaTiO3 with increasing temperature.
7
EXPERIMENTAL
Ba[(Y3+,Ta5+)xTi1-2x]O3 samples with x=0.0500, 0.0250, 0.0100, 0.0050 and 0.0025 were fabricated by adding stoichiometric amounts of the double perovskite Ba2YTaO6 using the formula:
(1 − 2𝑥)𝐵𝑎𝑇𝑖𝑂3+ (𝑥)𝐵𝑎2𝑌𝑇𝑎𝑂6 ⇄ 𝐵𝑎(𝑌. 𝑇𝑎)𝑥𝑇𝑖1−2𝑥𝑂3 Eq. 4 Hence, a two-step process was used as opposed to a single step process that involves milling all reagent base materials together. In the first step, each parent material, BaTiO3 and Ba2YTaO6 is individually batched. In the second step, Y3+-Ta5+ dipole pairs, donor-acceptor pairs, are stoichiometrically adding to BaTiO3 to provide Ba[(Y3+,Ta5+)xTi1-2x]O3 samples with x=0.0500, 0.0250, 0.0100, 0.0050 and 0.0025. This two-step process leaves less room for error when batching the sample material because so long as the two parent material are stoichiometric, any ratio of BaTiO3 to Ba2YTaO6 yields a charge neutral material.
The parent material was made in two 1L bottles polymer bottles. The first bottle held 139.801g of BaCO3 and 56.518g of TiO2 along with 1199.801g of yttria stabilized zirconia (YSZ) milling media and 160mL of isopropyl alcohol (IPA). The second bottle held 139.662g of BaCO3 and 56.514g of TiO2 with 1203.657g of milling media and 160mL of IPA. These masses yield approximately 165g of BaTiO3 after calcining according to the formulation:
𝐵𝑎𝐶𝑂3+ 𝑇𝑖𝑂2 → 𝐵𝑎𝑇𝑖𝑂3+ 𝐶𝑂2 Eq. 5 The purity of all materials used was 99.8% and were from Alfa Aesar. The YSZ media used was spherical with 5mm and 10mm diameters. The volume ratio of large spheres to small spheres was 1:1. The 1L bottles with a diameter of 9cm were then milled at 90 rotations per minute for 24h. Once the milling was complete, the slurry from the bottles was poured into glass
8
beakers, rinsing the media and the interior of the bottle with IPA to ensure the entirety of the contents was removed. The glass beakers were then placed in a drying oven set at 80°C for 24h to allow the IPA to evaporate from the slurry to leave a dried powder behind. The dried powder was removed from the glass beakers and placed into a plastic bag where large agglomerations of powder were broken up by hand. To easily calcine the batches, the powder was pressed into cylindrical pellets of 60-70g using a hydraulic uniaxial press with 22,241N of force and a 3.175cm diameter metal die. These pellets were then arranged on metallic sheets made of pure platinum which were then placed on an alumina ceramic tile and calcined in air at 1200°C for five hours. After sintering, the pellets were ground and sieved through a 150μm mesh. To verify the completion of the calcining and the phase of the material, an X-ray diffraction (XRD) analysis was performed on the sieved powder.
Once the phase of the BaTiO3 was verified, batching of the double perovskite was performed by milling 21.5666g powdered BaCO3, 6.1696g powdered Y2O3 and 12.0735g of Ta2O5
to create 35g of powdered sample using the formulation:
4𝐵𝑎𝐶𝑂3+ 𝑌2𝑂3+ 𝑇𝑎2𝑂5 = 2𝐵𝑎2𝑌𝑇𝑎𝑂6+ 4𝐶𝑂2 Eq. 6 The new powder then underwent many calcining tests, with approximately half a gram of powder used for each test. The XRD tests were run with parameters of 30kV and 10mA with a 0.5s step and 2311 total steps from 10-80 2Θ. The process of tuning the calcination temperature and duration was important because the objective was to obtain a soft phase pure powder that could easily be further processed. If the powder was too hard, it would be difficult to sieve and may not have bonded well with the other parent material well during the sintering process. Once the appropriate calcining temperature and duration were found to be 1500℃ and 20h the
remaining Ba2YTaO6 was calcined. The newly calcined double perovskite and BaTiO3 were
9
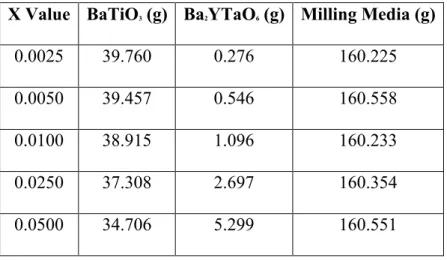
measured out to the masses listed in Table I. Using a 1:4 ratio of powder to media, each 250mL bottle was filled with approximately 40g of material, as listed in Table 1, and 160g of the same ratio of YSZ spherical milling media as before along with 40mL of IPA. The 6cm bottles were milled at 70rpm for 24hrs. The purpose of milling the two parent material powders together is to ensure they are thoroughly incorporated with each other.
Table I: Dopant Concentrations of the Processed Samples X Value BaTiO3 (g) Ba2YTaO6 (g) Milling Media (g)
0.0025 39.760 0.276 160.225
0.0050 39.457 0.546 160.558
0.0100 38.915 1.096 160.233
0.0250 37.308 2.697 160.354
0.0500 34.706 5.299 160.551
Once the milling process was completed, the milled solutions were removed from the bottles, left to dry in the oven, and sieved through the 150μm mesh.
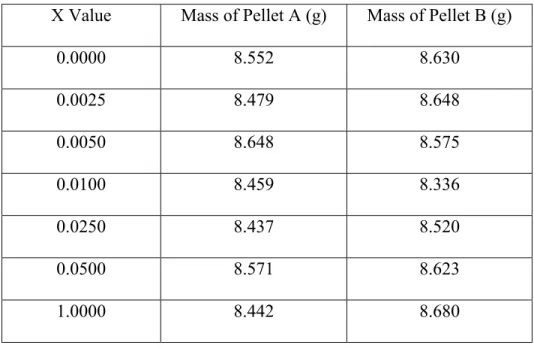
Two pellets were pressed on the uniaxial hydraulic press with 22,241N of force for each doped sample, the pure BaTiO3 and the Ba2YTaO6. The pellets were of 2.54cm diameter. Table II displays the massess of each pressed pellet.
10
Table II: Masses of Pressed Pellet Samples
X Value Mass of Pellet A (g) Mass of Pellet B (g)
0.0000 8.552 8.630
0.0025 8.479 8.648
0.0050 8.648 8.575
0.0100 8.459 8.336
0.0250 8.437 8.520
0.0500 8.571 8.623
1.0000 8.442 8.680
The samples then needed to be pressed in a cold isostatic press (Autoclave Engineers, Erie, PA). To avoid the samples coming into contact with the water inside the press, each sample was sealed within a plastic bag which was then sealed within a second plastic bag using a food vacuum sealer (FoodSaver, Walmart, US). Sealing each pellet twice gave an extra layer of protection in case one seal or the plastic broke. Both pellets of each sample were sealed in the same plastic, and each plastic pack was pressed in the cold isostatic press at 27,000psi.
Unfortunately, sealing two pellets in a dingle bag forced the samples against each other, causing them to crack the samples into smaller pieces. This was not too much of a problem, as there were pieces large enough to continue the experiment.
With each sample having a different fractional quantity of the double perovskite, different sintering temperatures needed to be used to achieve properly sintered pellets. The 0.0025, 0.0050 and 0.0100 samples were sintered at 1400°C for 25h. The 0.0250 and 0.0500
11
samples were sintered at 1500°C for 25h. The double perovskite was sintered at 1500°C for 25h while the pure barium titanate was sintered at 1350°C for 25h. These sintering profiles were found through many trials using unpressed powder. All samples were originally sintered at 1400°C for 25h and observed through XRD. While the 0.0025, 0.0050 and 0.0100 samples showed single phase materials, the 0.0250 and 0.0500 showed multiple phases were present, but the extra phase disappeared, and a single phase was achieved with a higher sintering temperature.
Each of these sintered pieces were polished on a 300 grit paper. Once polished,
conductive paste was applied to each side of the sample pieces. The paste was DuPont 7095, a silver microcircuit material. After the paste was applied, it was dried in an oven at 150°C for 20 minutes then fired at 350°C for 30 minutes.
The completed samples, the five with substitutions and the two parent materials, underwent four main types of characterization. Room temperature XRD was performed on the samples throughout the formation process to verify the completion of the bonding in the double perovskite and to verify the phases present in each substituted sample. XRD was performed before sintering, on the calcined powders. The XRD analysis was conducted on a Bruker D2 Phaser (Bruker, Madison WI, USA). Once the scans were collected, they were analyzed with PDF4+ (Bruker AXS, Madison, WI, USA) and Topas (Bruker, Billerica, MA, USA). The D2 Phaser used a copper Kα beam source which scanned the samples from 20° to 80° 2θ.
Scanning electron microscopy (SEM) analysis was used to analyze the surface of the completed samples along with their grain shape and size. This analysis was performed before the samples were electroded with a silver paste. The samples only needed to be electroded for the electrical analysis. The grain shape, size and boundaries were observed with the Quanta 200
12
FEG-ESEM (FEI, Hillsboro, OR, USA). A Lambda 950 UV-Vis-NIR (PerkinElmer Instruments, Norwalk, CT, USA) spectrometer was used to determine the band-gap energies of the substituted samples and parent materials from their grain size and density. This data was found by analyzing the materials through the transmission, absorption, and reflection of light1. Resistivity and relative permittivity are two of the main sets of data for this experiment and are related to the samples’ dielectric properties. A HP4284A LCR meter (Hewlett-Packard, Hyogo, Japan), where L stands for inductance, C for capacitance, and R for resistance, took capacitance and resistance measurements from 100Hz to 0.1MHz and 100K to 450K along with a Keithley 6487
picoammeter (Fortive, Cleveland, Oh, USA).. The measured capacitances were then converted to relative permittivity using Equation 7.
13
RESULTS AND DISCUSSION
The order of characterization of the samples is important. Characterization using XRD and SEM analysis should be performed before silver paste is applied. If XRD is performed after the paste is applied, extra peaks would be present in the diffraction patterns identifying the metallic paste. If SEM analysis was performed after paste application, the microscope would be unable to observe the microstructure of the samples through the paste. The same is true for the spectroscopy analysis . It would be impossible to observe how light is transmitted and reflected off the sample through a barrier of paste. However, the conductive paste is needed for the electrical measurements to find permittivity and resistivity. This thesis does not present the results of the analysis in chronological order, but rather in the order that presents the major points of the results in a way that creates a comprehensive analysis of this experiment. By using all of these analysis techniques, a change in energy density can be observed.
An LCR meter was used to find the capacitance of the samples. Equation XX shows how to find the relative permittivity of the samples using the capacitance:
𝜀𝑟 = 𝐶 ∗ 𝑑 𝜀0∗ 𝐴
Eq. 7
where C is the capacitance in F, A is the cross sectional area of the sample in mm2, and d is the distance between the parallel plates in the capacitor in mm.
The dipole concentration dependent evolution of permittivity of Ba[(Y3+,Ta5+)xTi1-2x]O3
is interesting. It shows that as the fractional substitution of yttrium and tantalum in place of titanium increases, the temperature where the peak permittivity occurs becomes lower with the maximum permittivity, Tm, decreasing at a rate of 5000K per dipole or about 250K per atom fraction substitution for Ti4+ dipole pairs, or atoms, respectively. This is approximately one-half
14
of the value found in previous research with Ba[(Ga3+,Ta5+)xTi1-2x]O3, BGTx[r]1. In general, the peak relative permittivity value is increasing as a function of dipole concentration of
Ba[(Y3+,Ta5+)xTi1-2x]O3 compared to previous Ba[(B’3+,Ta5+)xTi1-2x]O3 such as BGTx[r]. Also, the diffuseness of the relative permittivity of Ba[(Y3+,Ta5+)xTi1-2x]O3 lags in comparison to that of BGTx up to a concentration value of approximately x=0.01000. At concentrations of
x≥0.01000 it meets or exceeds the diffuseness of BGTx. From a permittivity perspective, Ba[(Y3+,Ta5+)xTi1-2x]O3 has superior properties than other Ba[(B’3+,Ta5+)xTi1-2x]O3 investigated to date. Therefore, Ba[(Y3+,Ta5+)xTi1-2x]O3 shows promise as a dielectric for use in capacitive materials through an adjustment temperature for peak permittivity, an enhanced permittivity value, and with operation over a wider range of temperatures than BaTiO3 along with other researched dipole engineered materials like BGTx. Figure 2 shows the trend of the peak permittivity occurring at lower temperature and how it compares to pure BaTiO3.
15
Figure 2: Plot of relative permittivity against temperature for Ba[(Y3+,Ta5+)xTi1-2x]O3 with 0.0000≤x≤0.0500 at 100Hz
The behavior of ferroelectric-like materials can be characterized using the Curie-Weiss equation:
1 𝜀− 1
𝜀𝑚 = (𝑇 − 𝑇𝑚)𝛾
𝐶′ Eq. 8
where ε is the relative permittivity, εm is the maximum permittivity, T is the temperature in K, Tm
is the temperature at εm in K, γ is the diffuseness parameter and C’ is the Curie-Weiss constant.
When γ=1, the material is characterized as strictly ferroelectric, but when γ=2, the material is characterized as fully diffuse and is associated with relaxor or relaxor-like materials.
1.00E+01 1.00E+02 1.00E+03 1.00E+04
190 240 290 340 390 440
Relative Permittivity
Temperature (K) x=0.0250
x=0.0050 x=0.0100
x=0.0025
x=1.0000
x=0.0000 x=0.0500
16
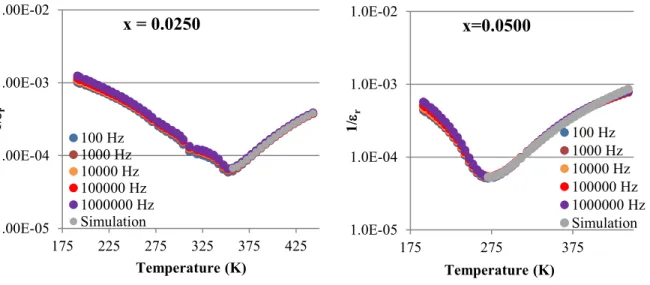
The Curie-Weiss equation helps to categorize the behavior of the primary relative permittivity peaks of Ba[(Y3+,Ta5+)xTi1-2x]O3, this is shown in Figures 3-8 for x=0.0000, 0.0025, 0.0050, 0.0100, 0.0250 and 0.0500 respectively, with fitting parameters obtained for 1 Mhz data which is summarized in Table III.
1.0E-05 1.0E-04 1.0E-03 1.0E-02
50 150 250 350 450
1/r
Temperature (K)
x=0.0000
100 Hz 1000 Hz 10000 Hz 100000 Hz 1000000 Hz Simulation
1.0E-05 1.0E-04 1.0E-03 1.0E-02
175 225 275 325 375 425 1/r
Temperature (K)
x = 0.0050
100 Hz 1000 Hz 10000 Hz 100000 Hz 1000000 Hz Simulation
1.0E-05 1.0E-04 1.0E-03 1.0E-02
175 225 275 325 375 425 1/r
Temperature (K)
x = 0.0100
100 Hz 1000 Hz 10000 Hz 100000 Hz 1000000 Hz Simulation 1.0E-05
1.0E-04 1.0E-03 1.0E-02
175 225 275 325 375 425 1/r
Temperature (K)
x=0.0025
100 Hz 1000 Hz 10000 Hz 100000 Hz 1000000 Hz Simulation
17
Figures 3-8: Behavior of primary permittivity peaks for x=0.0000, 0.0025, 0.0050, 0.0100, 0.0250 and 0.0500
Table III: Fitting parameters of primary permittivity peaks for x=0.0000, 0.0025, 0.0050, 0.0100, 0.0250 and 0.0500 at 1MHz
X Value Tm (K) (εr)max (K) C’ (X 105 K) γ
0.0000 402 964 0.51 1.00
0.0025 402 14161 2.40 1.05
0.0050 400 13338 3.00 1.12
0.0100 397 10402 2.60 1.10
0.0250 356 15029 40.00 1.60
0.0500 271 18884 350.00 1.99
1.00E-05 1.00E-04 1.00E-03 1.00E-02
175 225 275 325 375 425 1/r
Temperature (K)
x = 0.0250
100 Hz 1000 Hz 10000 Hz 100000 Hz 1000000 Hz
Simulation 1.0E-05
1.0E-04 1.0E-03 1.0E-02
175 275 375
1/r
Temperature (K)
x=0.0500
100 Hz 1000 Hz 10000 Hz 100000 Hz 1000000 Hz Simulation
18
Table III shows as the dipole concentration of Ba[(Y3+,Ta5+)xTi1-2x]O3 increases, the Curie-Weiss constant and the diffuseness parameter also increase. The Curie-Weiss constant for x=0.0250 and x=0.0500 is more than an order of magnitude larger than those of lower
concentrations of Ba[(Y3+,Ta5+)xTi1-2x]O3. Also, the diffuseness parameter, γ, for the two largest concentrations have values associated with relaxor or relaxor-like properties, however, none of the samples exhibit a Tm variation of strict relaxors. Therefore, Ba[(Y3+,Ta5+)xTi1-2x]O3 has properties that differ from BGTx, which exhibits strict relaxor-like properties for x=0.0250, and may transition to a strict relaxor at x≥0.00501. The reduction of frequency dependent
permittivity, the diffuseness of permittivity, along with the increased permittivity of
Ba[(Y3+,Ta5+)xTi1-2x]O3 make it a promising material for application where dielectric properties are desired and where reduced size, weight, and volume along with reduced frequency and temperature sensitivity of permittivity are important. Since Y3+ is the only atomic difference between Ba[(Y3+,Ta5+)xTi1-2x]O3 and Ba[(B’3+,Ta5+)xTi1-2x]O3, it can be assumed that Y3+ is responsible for the unusual properties due to its radius size, polarizability value and its coupling to the lattice5. The NSMM, which includes the C-M relation, does not cover all the permittivity nuances displayed in the Ba[(Y3+,Ta5+)xTi1-2x]O3 data, the NSMM does indicate that the
increased radii and polarizability of Y3+ (1.040Å, 3.84Å3) compared with Ga3+ (0.76Å, 1.50Å3) in combination with Ta5+ (0.78Å, 4.75Å3) replacing the pairs of Ti4+ (0.745Å, 2.94Å3) in BaTiO3
is responsible for some of the material property trends in Ba[(Y3+,Ta5+)xTi1-2x]O35. Since the use of Y3+ in the dipole pairs results in increased polarization per volume, the Tm’s and Tc of the original phase transitions of BaTiO3 should be pushed to higher temperatures compared to BGTx5. This is shown in the Tm’s of Ba[(Y3+,Ta5+)xTi1-2x]O3 compared to Ba[(Ga3+,Ta5+)xTi1- 2x]O31. Future work involving temperature dependent XRD and Raman spectroscopy, which are
19
beyond the scope of this B.S. thesis, could be helpful in the investigation of whether or not Tc is pushed to higher temperatures than Ba[(Ga3+,Ta5+)xTi1-2x]O3. Ba[(Ga3+,Ta5+)xTi1-2x]O3 does not possess aristocratic crystal transition at a higher temperature than BaTiO3 and, in general, possess Tc greater than BaTiO3, except at dipole concentrations below x=0.0050[r]. Since Y3+ is unable to move in the octahedral cage, and Ga3+, Ti4+, and Ta5+ are free to “rattle”, the separation distance between Ga3+ and Ta5+ will be slightly larger than that of Y3+ and Ta5+, which would result in a slightly larger dipole field strength. Hence, if dipole field strength is responsible for the increase in the diffuseness parameter, then the higher dipole field strength of
Ba[Ga3+,Ta5+)xTi1-2x]O3 should result in a more rapid transition to a diffuse material compared to Ba[(Y3+,Ta5+)xTi1-2x]O3. In previous experiments, Ba[Ga3+,Ta5+)xTi1-2x]O3 possess diffuseness parameters higher than 1.6 for x≥0.0050 while diffuseness levels of γ˃1.6 do not occur in Ba[(Y3+,Ta5+)xTi1-2x]O3 until at least x˃0.0100. As previously stated, Ba[(Y3+,Ta5+)xTi1-2x]O3
does not show strict relaxor behavior at any of the composition level up to x=0.0250, while Ba[(Ga3+,Ta5+)xTi1-2x]O3 exhibits strict relaxor behavior starting at low dipole concentrations1. This could suggest that it is the “rattling” of the Ga3+ and/or Ta5+ in Ba[Ga3+,Ta5+)xTi1-2x]O3, which Y3+ and/or Ta5+ are unable to do, is what causes the strict relaxor behavior. However, the confinement of the Y3+ in Ba[(Y3+,Ta5+)xTi1-2x]O3 could result in the higher relative permittivity due to structural and pressure factors. Both of these points would require more investigation in order to explain the mechanism(s) for the differences in properties.
20
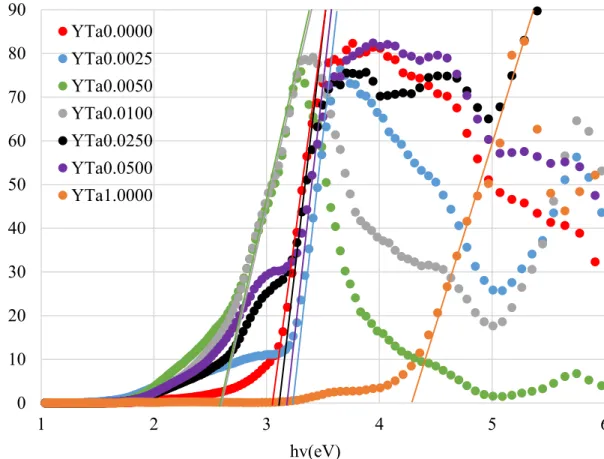
The UV-VIS-IR data plot can be used to determine the bandgap energies of the materials, which is defined as the energies between the valence and conduction bands of a material3. Using the Tauc method and following the slopes of the plots down to where they intercept the x-axis of the plot, the bandgap of the samples can be determined. Since the bandgap of BaTiO3 is direct, it has been assumed that the bandgap of Ba[(Y3+,Ta5+)xTi1-2x]O3 is also direct. Figure 9 shows the bandgap plots for the samples and Table IV give the optical band gap values for each dipole concentration.
Spectroscopy involves the analysis of how a sample reflects and absorbs light. Light can be transmitted, absorbed, or reflected by a sample. If the frequency of the light is greater than the band gap energy of the sample, the sample absorbs electrons into its conduction band which increases the conduction capability of the sample. This leads to a lower reflection of light off the sample. If the frequency of the light is less than the band gap of the material, the light is mainly transmitted or absorbed, sometimes both6. The samples in this experiment were observed from 1200-200nm and the Tuac function was plotted as a function of frequency, after converting wavelength to frequency.
21
Figure 9: Plot of optical bandgap used to derive bandgap energies
Table IV: Bandgap energy values of Ba[(Y3+,Ta5+)xTi1-2x]O3 with 0.0000≤x≤0.0500 Dipole Concentration 0.0000 0.0025 0.0050 0.0100 0.0250 0.0500 1.0000
Eg (eV) 3.03 3.19 2.76 2.76 3.07 3.11 4.28
The activation energy of a material can be found through resistivity analysis and also through using Equation 8:
𝐸𝑔 = 2 ∗ 𝐸𝑎 Eq. 9
0 10 20 30 40 50 60 70 80 90
1 2 3 4 5 6
YTa0.0000 YTa0.0025 YTa0.0050 YTa0.0100 YTa0.0250 YTa0.0500 YTa1.0000
[F(R)hv]2
hv(eV)
22
where Eg is the bandgap energy and Ea is the activation energy. Both have units of eV. The activation energy is determined from the slope of the line in an Arrhenius plot, resistivity versus 1000/T where T is the temperature in K.
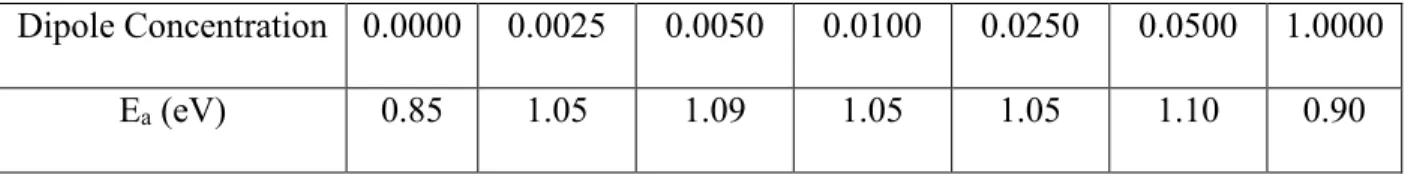
Table V gives the activation energy values for all created samples.
Table V: Activation energies of Ba[(Y3+,Ta5+)xTi1-2x]O3 with 0.0000≤x≤0.0500
Dipole Concentration 0.0000 0.0025 0.0050 0.0100 0.0250 0.0500 1.0000
Ea (eV) 0.85 1.05 1.09 1.05 1.05 1.10 0.90
It is important to note that the Ea and Eg do not follow the relation given in Equation 8.
The activation energies are lower than expected. If the grain boundary is comprised of a different material that the grains, and the grain boundary is more conductive than the grain, resistivity measurements will measure along the past of least resistance, therefore the activation energy of conductivity of the material which makes up the grain boundary. These resistivity measurements are conducted over a wide temperature range while the UV-Vis-IR are measured at room
temperature. For the temperature dependent resistivity measurements, it is possible to obtain more than one activation energy if the bulk material, or the grain boundary material changes phases. These changes will result in a change in the slope on the Arrhenius plot, Figure 10. For example, BaTiO3 has structural phase transition at approximately 403K, with BaTiO3 being cubic above 403K and tetragonal below 403K, therefore, the UV-Vis-IR analysis is measuring the bandgap of the tetragonal phase and the resistivity activation energy is measuring the activation energy and bandgap of the cubic phase of BaTiO3. Previous resistivity measurements of BaTiO3 withing the research group have found resistivity activation energies of about 1.5eV
23
or bandgap energy of about 3.0eV, the resistivity data of this thesis indicates that the grain boundary of the materials are more highly conductive, or less resistive, that the grains
themselves. These properties of the grain boundaries may be due to Y3+ being a larger ion that would typically have a lower diffusion coefficient than other ions. It may also result in a higher concentration of Y3+ in the grain boundary.
One key material parameter to characterize is the material’s resistivity, the inverse of electrical conductivity, of Ba[(Y3+,Ta5+)xTi1-2x]O3 with 0.0000≤x≤0.0503. The resistivity is related to how long charge can be maintained when separated like that of a capacitor. The higher the resistivity for a given relative permittivity, the linger the time change can be stored in a capacitor. One of the major goals is to use the substituted dipoles to increase resistivity of pure BaTiO3. Figure 10 is an Arrhenius plot of the collected resistivity data and Equation 9 can be used to calculate resistivity.
24
Figure 10: Arrhenius plot of resistivity against temperature for Ba[(Y3+,Ta5+)xTi1-2x]O3 with 0.0000≤x≤0.0500
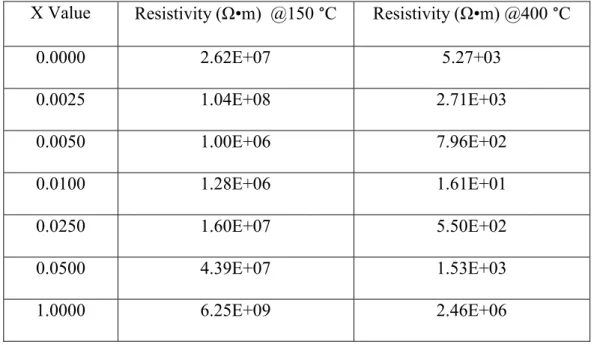
Table VI lists the resistivities of Ba[(Y3+,Ta5+)xTi1-2x]O3 with 0.0000≤x≤0.0500 at 150°C and 400°C.
1.00E+01 1.00E+02 1.00E+03 1.00E+04 1.00E+05 1.00E+06 1.00E+07 1.00E+08 1.00E+09 1.00E+10 1.00E+11
1.00 1.50 2.00 2.50 3.00 3.50
Resistivity (Ω•m)
1000/T (K)
YTa0.0000 Sim(Ea=0.85 eV) YTa0.0025 Sim(Ea=1.05 eV) YTa0.0050 Sim(Ea=1.09 eV) YTa0.0100 Sim(Ea=1.05 eV) YTa0.0250 Sim(Ea=1.05 eV) YTa0.0500 Sim(Ea=1.10 eV) YTa1.0000*
Sim(Ea=0.90 eV)
25
Table VI: Resistivity values at two different temperatures; 150°C and 400°C X Value Resistivity (Ω•m) @150 °C Resistivity (Ω•m) @400 °C
0.0000 2.62E+07 5.27+03
0.0025 1.04E+08 2.71E+03
0.0050 1.00E+06 7.96E+02
0.0100 1.28E+06 1.61E+01
0.0250 1.60E+07 5.50E+02
0.0500 4.39E+07 1.53E+03
1.0000 6.25E+09 2.46E+06
The data from Figure 10 shows the experiment was successful. The general trend shows the resistivity is reduced with increasing concentration. This trend is true above approximately 500K, where the resistivities of all substituted samples are below the resistivity of pure BaTiO3. Below 500K, the resistivity of the x=0.0025 concentration is actually below the resistivity of BaTiO3, while the resistivities of the other substituted samples are either in line, or below the resistivity of pure BaTiO3.
Before the silver coating was applied to the samples, they were observed for
determination of phase purity and crystal structure using XRD at room temperature. The samples also underwent SEM analysis. Figure 11 shows the XRD patterns for the final, calcined samples.
26
Figure 11: XRD data for all substituted samples and parent materials
This data for pure BaTiO3, pure Ba2YTaO6 and the five substituted samples are plotted on a log scale in a staggered manner to display the phase purity of the materials and how the lattice parameters and structure of BaTiO3 changes with the addition of increasing fractional amounts of Ba2TiO6. It is assumed that the increasing concentration of the Y3+-Ta5+ dipole pairs, energy within the lattice, will increase the lattice parameters of the materials for a specific crystal structure, or cause the crystal structure to transform to a lower crystal symmetry where energy is stored in the bonds of the new structure, through conversion of energy principles. Polycrystal grain size is expected to decrease with increasing concentration of dipoles, due to added energy per volume. This results in a higher surface energy in an action-reaction conservation of energy construct. Smaller crystallite size results in XRD data are shown by line broadening, relatively large full width at half maximum values. The lattice increase is also associated with, in part, the size of the Y3+ ion which does not freely “rattle” in the oxygen octahedral cage5. The increase of lattice parameters shifts of peaks to lower angles are most identifiable from the lines at
approximately 39°2θ and 77°2θ. Another noticeable change is the collection of small peaks at
1.00E-01 1.00E+01 1.00E+03 1.00E+05 1.00E+07 1.00E+09
10 20 30 40 50 60 70 80
Counts
2θ
0.0000 0.0025 0.0050 0.0100 0.0250 0.0500 1.0000
27
approximately 29°2θ. The general trend is that more peaks occur in that section of the scan. This is likely due to the peak present at 30°2θ for the pure Ba2YTaO6. There are also two peaks
present in the x=0.0500 scan in the mid 30°2θ range that match the two peaks present in the same place in the scan of the pure double perovskite. It can also be noted that the double peak present at 75°2θ in the bure BaTiO3 combine into a single peak as the dipole concentration increases.
An SEM was used to observe the surface structure of each of the seven samples created.
The purpose of this analysis was to observe the microstructure of the materials. Figure 12 is an image of the microstructure of the pure BaTiO3 while Figure 13 is an image of the pure double perovskite. From SEM data, BaTiO3, which was processed at the lowest temperature, 1350°C for 25hrs, has the largest grain size of any of the prepared samples, Figure 12. The lowest
concentration samples, x=0.0025, 0.0050, and 0.0100 which were sintered at 1400°C for 25 hours, are consistent with expectations, decreasing grain size with increasing concentration of dipoles, Figures 14-16. The highest concentration of dipoles, x=0.0250 and 0.0500, which were sintered at 1500°C for 25 hours, also have grain sizes consistent with expectations, decreasing grain size with increasing concentration of dipoles, Figures 17-18, especially considering the increase of processing temperature (100°C) for which grain growth is expected5.
28
Figure 12: The microstructure of BaTiO3 at 2500x magnification
29
Figure 13: The microstructure of Ba2YTaO6 at 2500x magnification
One important note to make is the size difference between the two parent materials; the double perovskite is smaller than the BaTiO3, with Ba2YTaO6 having an average grain size of 3.0μm and the BaTiO3 having an average grain size of 37.5μm. Figure 19 displays the average grain size of Ba[(Y3+,Ta5+)xTi1-2x]O3 with 0.0000≤x≤1.0000.
30
Figures 14-18 show the microstructure of Ba[(Y3+,Ta5+)xTi1-2x]O3 with 0.0025≤x≤0.0500 in increasing dipole fraction order.
Figure 14: The microstructure of Ba[(Y3+,Ta5+)xTi1-2x]O3 with x=0.0025 at 2500x magnification
31
Figure 15: The microstructure of Ba[(Y3+,Ta5+)xTi1-2x]O3 with x=0.0050 at 2500x magnification
32
Figure 16: The microstructure of Ba[(Y3+,Ta5+)xTi1-2x]O3 with x=0.0100 at 2500x magnification
33
Figure 17: The microstructure of Ba[(Y3+,Ta5+)xTi1-2x]O3 with x=0.0250 at 1000x magnification
34
Figure 18: The microstructure of Ba[(Y3+,Ta5+)xTi1-2x]O3 with x=0.0500 at 1000x magnification
35
Figure 19: Average grain size of Ba[(Y3+,Ta5+)xTi1-2x]O3 with 0.0000≤x≤1.0000 The data, Figure 19, shows a decreasing average grain size with increasing dipole concentration. This can be attributed to an increase in total surface energy, likely due to
increasing energy density from increasing concentration of dipoles. More surface energy needs more space to be stored in, therefore, an increase in surface area results. The SEM analysis was conducted at room temperature; therefore the materials had a tetragonal structure. With
increasing dipole concentration, the energy concentration increases, causing the lattice to expand.
The lattice expands until it is no longer able to store energy in the atomic bonds of the structural configuration, at that point the material rearranges to a lower crystal structure5. This
phenomenology discussion is consistent with the change in crystal structure for the x=0.0250 and x=0.0500 samples of the XRD data. The change in crystal structure can alter the surface energy and shape of the grain growth as observed in the SEM data, Figures 17 and 18.
0 5 10 15 20 25 30 35 40
0.0000 0.0025 0.0050 0.0100 0.0250 0.0500 1.0000
Average Grain Size (μm)
Dipole Concentration
36
CONCLUSION AND FUTURE WORK
Electric-field dipole engineering at the nanoscale (E-DENS) give scientists and engineers the ability to investigate and modify the electric-field interactions of atoms at the atomic level. It also allows for the determination of how those interactions affect material properties. In this thesis, dipole pairs of Y3+-Ta5+ were substituted for pairs of Ti4+-Ti4+ pairs in BaTiO3 using the formula Ba[(Y3+,Ta5+)xTi1-2x]O3 with 0.0000≤x≤0.0500. Both Y3+ and Ta5+ are more polarizable than Ti4+, this leads to the Y3+-Ta5+ dipole pairs adding more energy into the material lattice as they are substituted for the Ti4+ pairs. These created materials did have similar behavior to previously studied E-DENS materials1. Although, these previously created materials, which utilized Ga3+-Ta5+ dipole pairs, allowed BaTiO3 to transform from ferroelectric to diffuse phase, to relaxor-like, the Y3+-Ta5+ dipole pairs showed no signs of strict relaxor bahavior, i.e. no frequency dependance of Tm. The increase of Tm for Ba[(Ga3+,Ta5+)xTi1-2x]O3 compared to the anticipated increase for Ba[(Y3+,Ta5+)xTi1-2x]O3 for the same dipole concentrations are consistent with the Clausius-Mossotti relation and suggest the meticulous use of cations can be used to manipulation of Tm. Based off diffuseness data of Ba[(Ga3+,Ta5+)xTi1-2x]O3, it can be anticipated that the diffuseness of Ba[(Y3+,Ta5+)xTi1-2x]O3 will decrease for the same dipole concentrations, due to the confinement of the Y3+ cation in the octahedral cage. The size of Y3+ does not allow it to “rattle” in the cage like Ga3+,Ta5+ and Ti4+.
The increase of relative permittivity and reduction of frequency dependence of relative permittivity are not presently well understood, but should be associated with the limitations of Y3+ rattling, its lattice coupling and higher polarizability in Ba[(Y3+,Ta5+)xTi1-2x]O3 compared to the smaller Ga3+ cation in Ba[(Ga3+,Ta5+)xTi1-2x]O3 as these cations are the only difference between the materials. The reduced lattice parameter of Ba[(Y3+,Ta5+)xTi1-2x]O3 compared to
![Figure 2: Plot of relative permittivity against temperature for Ba[(Y 3+ ,Ta 5+ ) x Ti 1-2x ]O 3 with 0.0000≤x≤0.0500 at 100Hz](https://thumb-ap.123doks.com/thumbv2/123dok/10510641.0/26.918.131.779.126.584/figure-plot-relative-permittivity-temperature-0000-0500-100hz.webp)
![Table IV: Bandgap energy values of Ba[(Y 3+ ,Ta 5+ ) x Ti 1-2x ]O 3 with 0.0000≤x≤0.0500 Dipole Concentration 0.0000 0.0025 0.0050 0.0100 0.0250 0.0500 1.0000](https://thumb-ap.123doks.com/thumbv2/123dok/10510641.0/32.918.108.813.750.839/table-bandgap-energy-values-0000-0500-dipole-concentration.webp)
![Figure 10: Arrhenius plot of resistivity against temperature for Ba[(Y 3+ ,Ta 5+ ) x Ti 1-2x ]O 3 with 0.0000≤x≤0.0500](https://thumb-ap.123doks.com/thumbv2/123dok/10510641.0/35.918.147.796.109.515/figure-arrhenius-plot-resistivity-temperature-ba-0000-0500.webp)