My thanks go to the members of my dissertation committee, who made a great contribution to the improvement of my dissertation. I would especially like to thank Professor Craig Lewis, my advisor, Professor Bill Christie, Professor Ronald Masulis and Professor Hans Stoll for their continued support and guidance throughout my doctoral studies.
Introduction
Second, we examine the relationship between firms' choice of debt and equity capital and one-year forward stock returns after controlling for the effect of investing in growth options. Without controlling for the effect of investment-in-growth options, the regression results suggest that there is no relationship between equity ratio and future stock returns.
Data
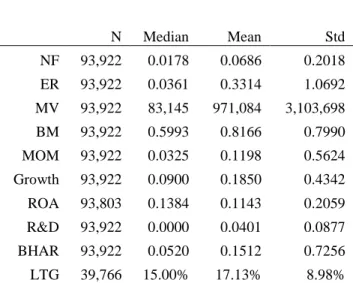
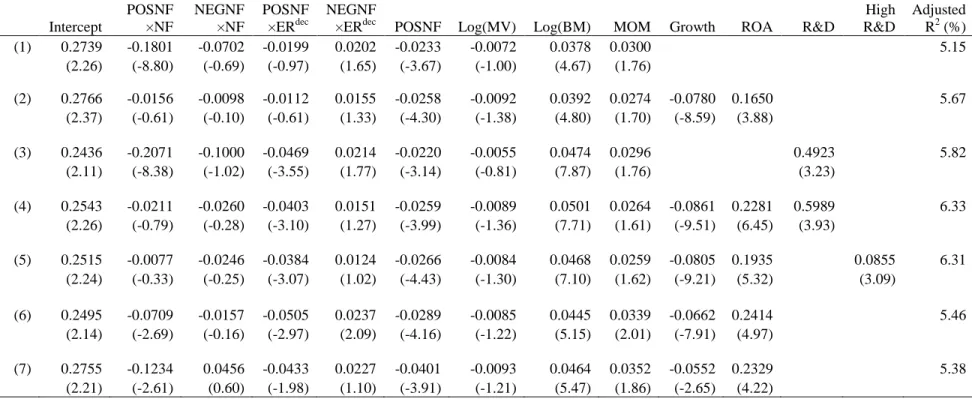
Mom is defined as the stock return from July of year t – 1 through May of year t. MOM is stock return momentum, defined as the buy-and-hold return over an eleven-month period from July of year t – 1 to May of year t.
Equity ratio and earnings announcement returns
Results from portfolio sorts
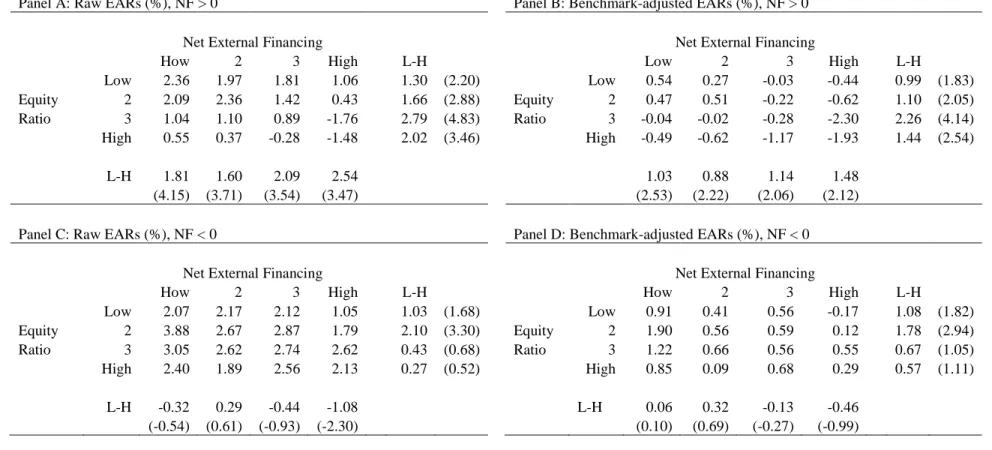
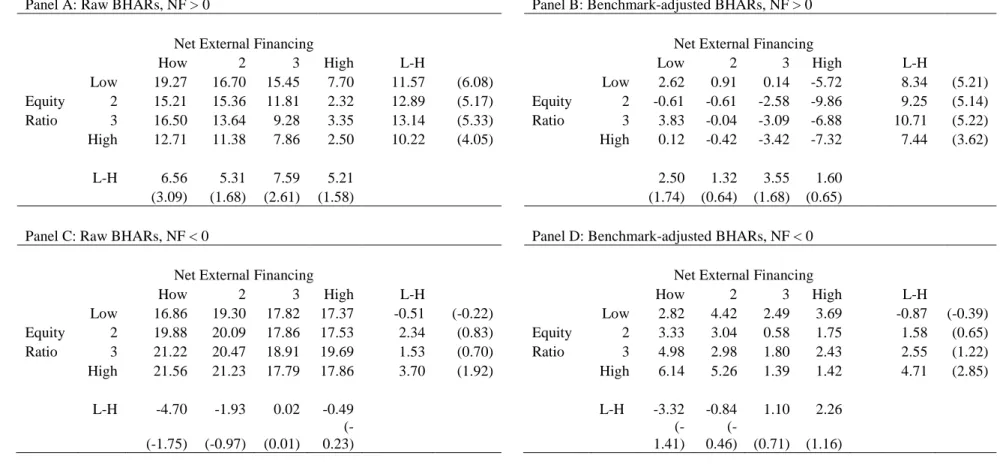
Standard-adjusted EARs are defined as raw EARs minus the average VERs of firms of similar size, book-to-market ratio and momentum reporting earnings during the same calendar quarter. Standard-adjusted EARs are defined as raw EARs minus the average VERs of firms of similar size, book-to-market ratio and momentum reporting earnings in the same calendar quarter.
Results from cross-sectional regressions
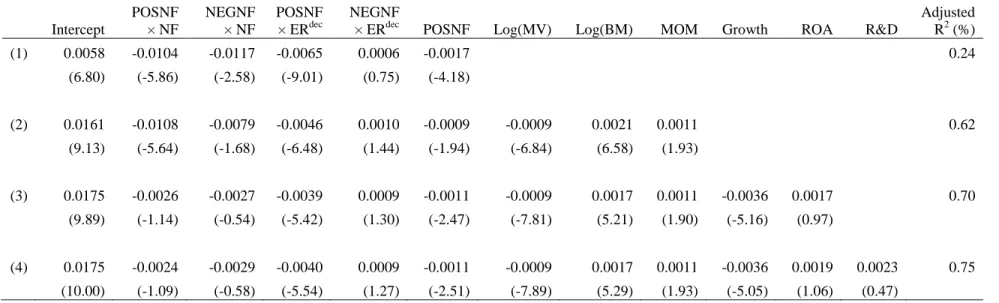
Log(MV) is the logarithm of the market value of equity at the end of June of year t. We find the economic magnitude of the debt-equity composition effect is similar to the magnitude of the book-to-market effect and larger than that of the MOM and ROA effects.
Debt-equity choice, growth options and future stock returns
Results from portfolio sorts
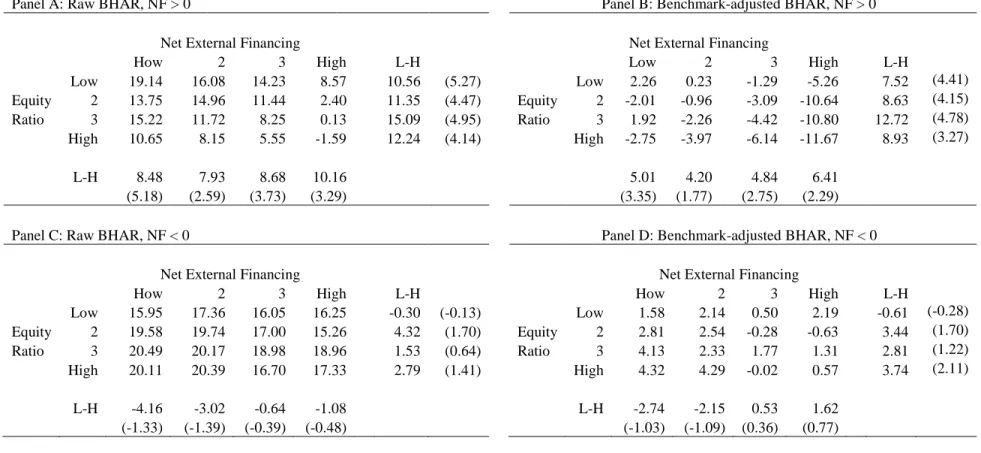
For completeness, we report both the raw and benchmark-adjusted BHARs for the NF × ER portfolios. In Panel B of Table 1.5, we present the benchmark-adjusted BHARs for firms that raise capital (NF > 0).
Results from cross-sectional regressions
Log(B/M) is the logarithm of the book-to-market ratio, defined as the book value of equity at the end of the financial year occurring in calendar year t – 1, scaled by the market value of equity at the end of the financial year December of the year t - 1. Relative to the effect of investments in growth options, the market timing effect is therefore stronger during earnings announcement days.
Equity ratio and analysts’ forecasts of firms’ long term growth rates
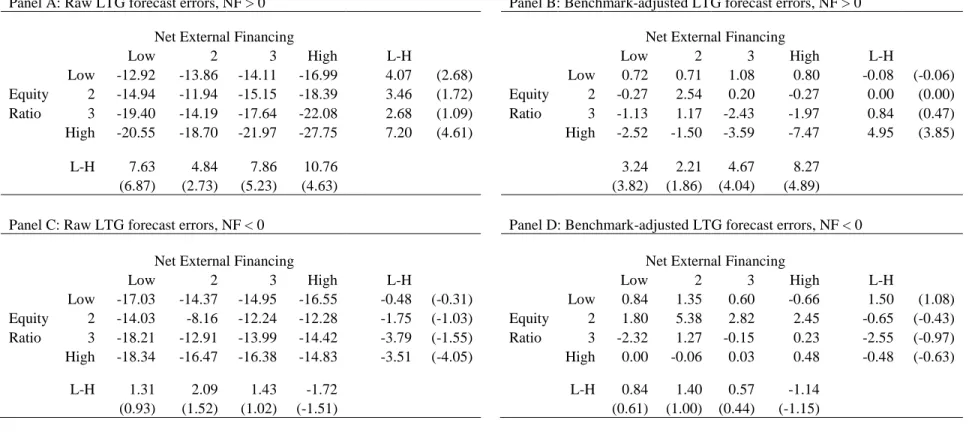
Following previous studies, we use the average analyst forecast (LTG) in the I/B/S/E database as a proxy for market expectations of firms' long-term growth rates. The average LTGFEs for all NF × ER portfolios are negative, suggesting that analysts are generally overly optimistic about firms' growth prospects. Analysts' forecast errors in long-term growth rate for net external financing and equity share.
Panel B presents benchmark-adjusted growth rate forecast errors for firms raising capital (NF > 0). Panel D presents the benchmark-adjusted growth rate forecast errors for capital-distributing firms (NF < 0).
Aggregate data
In 1972, only about 7% of the firms in our sample were classified as high R&D firms. In 2008, about 30% of companies in our sample had R&D expenditures greater than 5% of subordinated assets. Because companies with a lot of R&D are more likely to invest in new growth opportunities, the trend in Figure 1.1 suggests that the disruptive effect should have become stronger over the years.
Without controlling for this confounding effect, the predictive power of equity issuance in new issues will weaken over the sample period. Since the proportion of high R&D firms is highest in years after 1997, it is not surprising that the negative correlation between the share issuance in new issues and future stock market returns disappears when the later years are included in the sample.
Conclusion
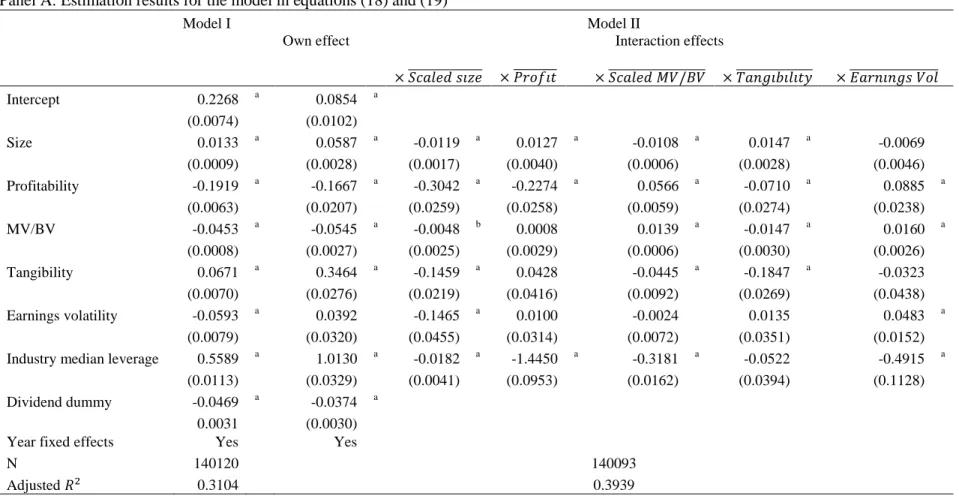
Second, the marginal effects of capital structure determinants may be conditioned by other factors. Panel A of Table 2.3 presents the ensemble mean coefficient estimates for the determinants of capital structure (Pesaran and Smith, 1995). However, as we show in equation (4), the effects of capital structure determinants can be absorbed by durable fixed effects.
In other words, firms with relatively high growth potential are less sensitive to changes in most of the capital structure determinants in the column. Panel B presents the results for the “fixed effect” estimate of the model in equations (19) and (20).
A NEW APPROACH FOR EVALUATING CAPITAL
Pseudo fixed effects
Therefore, the presence of firm fixed effects does not necessarily mean that the time series variation of the capital structure determinants is without significance. The neglect of slope heterogeneity may be one of the reasons why the adjustment rates estimated using fixed effects models are insensitive to the inclusion of capital structure. When ̂ is biased toward zero, the homogeneous coefficient models underestimate the effects of the capital structure determinants.
They overestimate the effect of lagged leverage and underestimate the effects of capital structure determinants. This may partly explain why the speed of adjustment changes little before and after including the capital structure determinants in the fixed effect models (Lemmon, Roberts, and Zender, 2008).
Estimation methods for heterogeneous panels
Pesaran and Smith (1995) derive the signs of the bias for the homogeneous coefficient model estimates of λ̂ and. Therefore, we need to estimate the variance components in a first-stage estimate and then substitute the resulting estimates into equations (12) and (13) to obtain ̂ and ̂ in a second stage. If the firm-specific coefficients are correlated with the regressors, the GLS estimator of the mean coefficient vector may be biased ( Mundlak, 1978 , Hsiao, 2003 ).
Since the firm-specific means of the variables in equation (14) are subtracted, the correlation between the firm-specific and the regressors is not a problem. Second, following Mundlak (1978) and Hsiao (2003) , we estimate equation (11) together with auxiliary equations for the coefficient vector as a function of the ith firm's observed explanatory variables.
Data and descriptive statistics
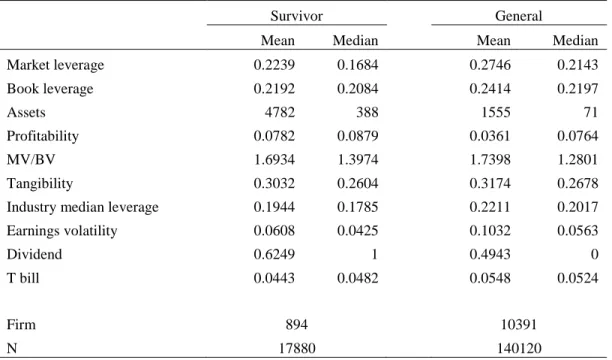
Market leverage is the ratio of total debt over the amount of debt and the market value of equity. Market leverage is the ratio of total debt to the sum of total debt and the market value of equity. MV/BV is the ratio of the market value of assets to the book value of assets.
Median industry leverage is the median market leverage for each three digit SIC industry with more than three companies. We need a minimum of three years of operating income to calculate the earnings volatility variable.
Evidence from the survivors sample
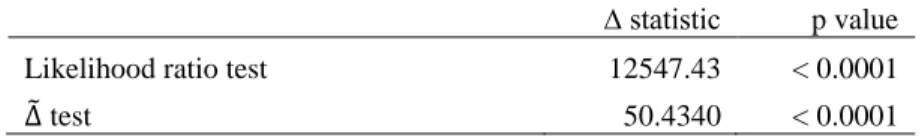
- Test of slope homogeneity
- How important are the capital structure determinants
The adjusted of the firm-specific regressions then measures the incremental explanatory power of capital structure determinants over and above an intercept-only model. The mean coefficients of the firm-specific OLS regressions are then taken as the coefficients of the mean group model. Panel C: Adjusted statistics for the firm-only dummies model, the LSDV model, and the firm-specific regressions for the total sample.
For random coefficients/multilevel models, the table reports average effects across firms, ie. ̂ in equation (12). For models estimated using reduced data, the MSE of the fixed-effect model is used as the comparison MSE.
Evidence from the general sample
- Slope heterogeneity and firm characteristics
- Slope heterogeneity by industry
The conditional applicability of the capital structure theories can influence the cross-sectional differences in the firms' sensitivity to the changes in capital structure determinants. Many of the interaction terms are statistically significant, supporting the view that the cross-sectional differences in the firms' slope coefficients are related to the variables in the column. The results in Panel A provide further evidence that part of the unobserved heterogeneity in the leverage models is related to the cross-sectional differences in slope coefficients and that the differences in slope coefficients are related to economically significant factors.
Yet, adding industry-specific intercepts adds remarkably little to the model fit when heterogeneity across industries is taken into account. The results in Table 2.8 show that meaningful improvements in model fit can be achieved if the slopes of the capital structure determinants are allowed to vary depending on industry and firm characteristics.
Literature review
Fama and French (1992) find that size and book-to-market ratio are related to firms' stock performance. For example, Fama and French (1996) and Vassalou and Xing (2004) argue that size and book-to-market effects are related to financial distress. The above discussion shows that the stock returns of companies with similar sizes and book-to-market ratios contain important information about common shocks.
H1: CEO compensation is negatively related to the performance of companies with similar sizes and/or book-to-market ratios. To test this hypothesis, I construct size and book-to-market peer groups for each company in my sample.
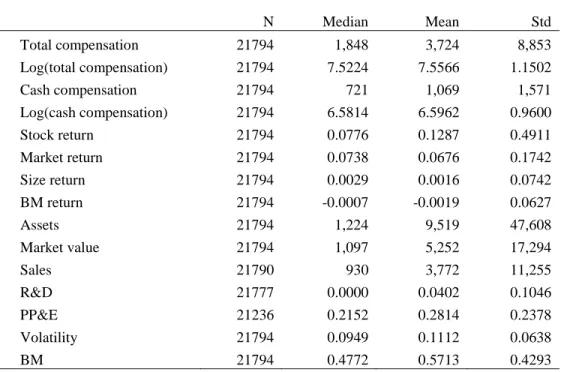
Data
The same procedure is used to construct the book-to-market peer groups for the sample companies. The performance of book-to-market size and peer groups can be measured using average return, value-weighted return, or equity-weighted return. However, I use equal weighted book-to-market peer group and size returns in my robustness check.
I adjust the returns for peer group size and book-to-market by subtracting the market return, which is calculated as the median return for all Execucomp companies. The size and BM return are defined as the median return of a sample firm's size and book-to-market peer groups minus the market return.
Results
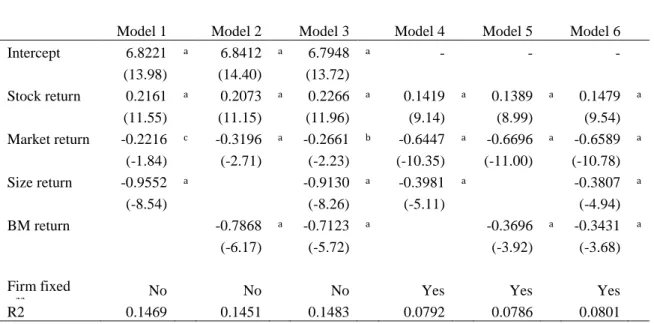
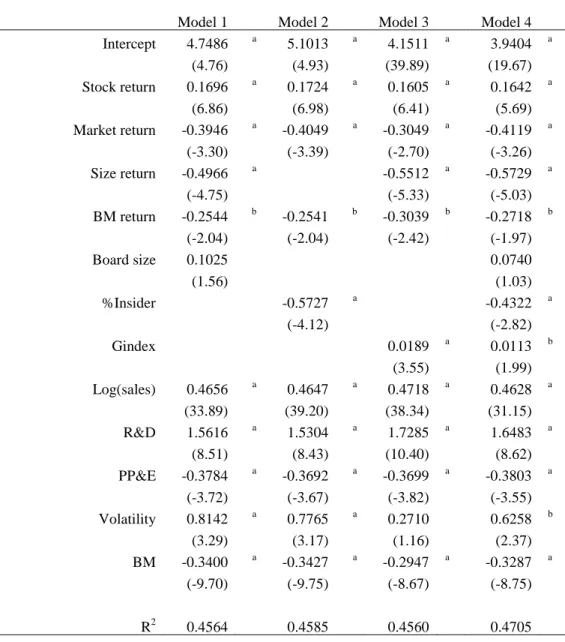
Panel A of Table 3.3 presents the results of the regression of the natural log of CEO total compensation on the stock return variables. More importantly, the coefficients on size and BM returns are all significantly negative, suggesting that CEOs are rewarded (or punished) less when their size and book-to-market peer groups perform better (worse). The coefficients for market return, size return and BM return are -0.3154, respectively. The performance of size and book-to-market peer groups appears to have more influence on CEO total compensation than the total market.
In all three models, the coefficients for market return, size return, and BM return are significantly negatively related to total compensation. The magnitudes of the coefficients for size and BM returns are smaller than in Models (1), (2) and (3), but are still non-trivial compared to the coefficients for equity returns and market returns.
Robustness check
In models (1), (2), and (3), I examine the relationship between total CEO compensation and equally weighted returns of firm size and groups of accounting peers. According to Aggarwal and Samwick (1999), the positive relationship between total CEO compensation and industry returns is due to the need to mitigate competition in the product market. Total compensation is the sum of salary, bonus, restricted stock grants, long-term incentive plan payouts, value of stock option grants and all other compensation.
Total compensation is the sum of salary, bonus, restricted stock awards, long-term incentive plans, the value of stock option awards and all other compensation. In all four models, both size returns and BM returns are negatively and significantly related to total compensation.
Conclusion
Therefore, when we take into account companies' corporate governance practices, the results are still consistent with the relative performance evaluation model. A recent study by Guthrie, Sokolowsky, and Wan (2010) shows that these observations can have non-trivial effects on the estimation results. Samwick, 1999, Executive Compensation, Strategic Competition, and Relative Performance Evaluation: Theory and Evidence, Journal of Financial Economics, VoL.
Antle, Rick and Abbie Smith, 1986, An Empirical Study of the Relative Performance Evaluation of Corporate Managers, Journal of Accounting Research 24, 1-39. Faulkender, Michael and Jun Yang, 2010, The Role and Composition of Compensation Peer Groups, Journal of Financial Economics.