I would also like to thank Jacob Goeree, Antonio Rangel and Jernej Copic for proofreading some of the early versions of this thesis. I would also like to thank my co-authors Terry Lohrenz and Read Montague for their contributions on the third chapter.
Introduction
This model is largely based on a simple principle - the strength of the association between two attributes is proportional to the observed association between these attributes in the consumer's experience, where this experience includes advertising. In essence, advertising creates complementarities between sets of physical characteristics, enabling the combination to be "attractive" or "fashionable". I call these kinds of characteristics “social characteristics” in this paper.
Motivation and Background
- Hedonic pricing with “perceived attributes”
- Economic Models of Advertising
- Informative models
- Persuasive models
- Complementary models
- Bounded rationality
- Marketing
- Brand and Trademark Dilution
- Spillover
- Trivial Attributes
- Network models from marketing
- Psychology and Neuroscience
- Cognitive Psychology and Priming
- Hopfield Networks
In this paper, we focus on one of these three factors, extension consistency.6. But the network dynamics is based on Hopfield networks described in the next subsection.
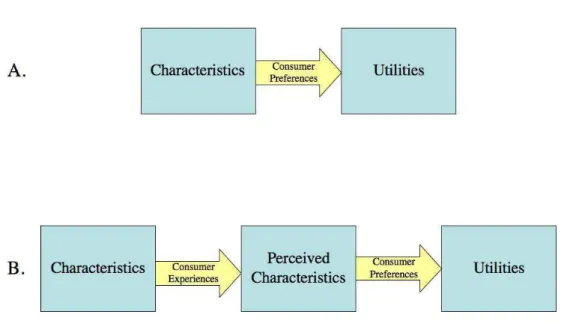
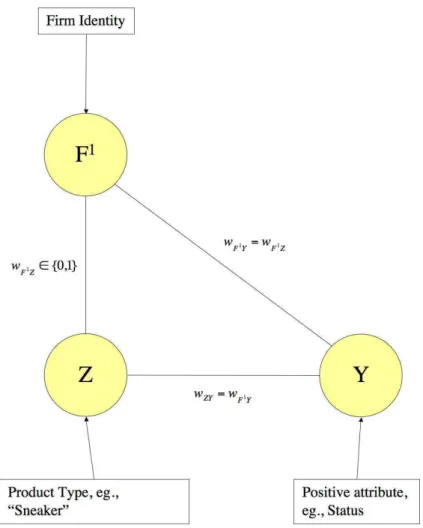
Network model for determining “perceived characteristics”
Encoding goods and experiences
"Hot" is always important for pizzas, so if V is the decision maker's representation of pizza, Vi will always be non-zero. For example, if the decision maker's favorite topping is pepperoni, the presence or absence of pepperoni will always be important to him.
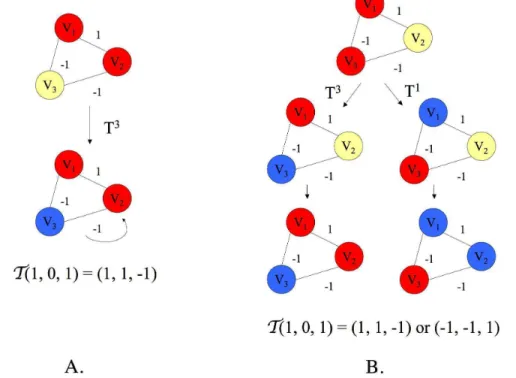
The state of the network is simply the vector containing the state of each node. We demonstrate convergence by defining an energy function for all possible states of the network.
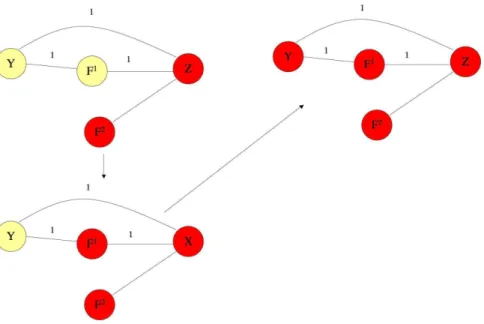
Example network
Any network state that falls outside these basins can go to one of at least two different stable states. In other words, if we start with conflicting information, the network will stochastically go to a steady state that is consistent with some part of the initial model.
Consumer utility, advertisements, and the decision problem
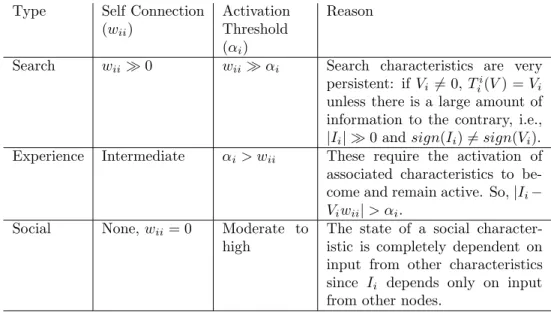
Characteristic types
- Search characteristics
- Experience characteristics
- Social characteristics
Because search attributes are highly self-connected, they will tend to be invariant regardless of the status of other nodes in the network, making the function an identity function. The neural network model outlined in section 1.3 can be used to describe how advertisements and other experiences can actually influence a consumer's perception of a product and thus the consumer's evaluation of the product.
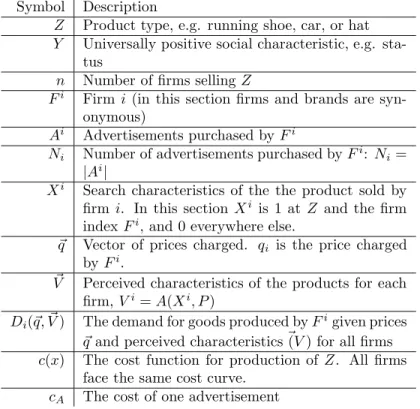
Products and utility
Once the perceived characteristics of each product are established, we can obtain a reduced form of the utility function: u:Rn →R|V~ where nis is the number of products in the market and V~ are elements of S describing their perceived products. characteristics. We will continue to use this type of utility function to illustrate the effects of advertising in the remainder of this section.
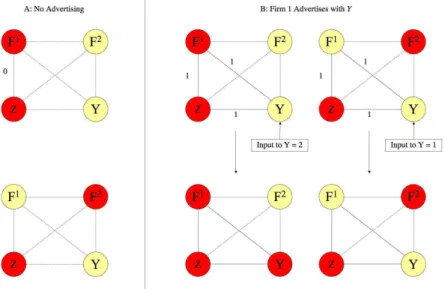
Trivial Attributes and Substitution
First, consider the case where neither firm advertises, that is, neither firm is associated with the social attribute Y. Note that since both firms' products are identical except for the brand identifiers, they are perfect substitutes, so the consumer will have straight indifference curves. This will increase the absolute and marginal utility of extra units ofx1 and give us convex indifference curves.
Common effects at the consumer level
Dilution
Assume that for all other samples in the original experience set, p∈P,p6∈P0, the state of the brand node is 0. Here, each brand advertisement strengthens the associations between brand identifiers and quality, so that the dilution of other associations becomes less important .

Spillover
Here, each advertisement for the brand reinforces connections between the brand identifiers and quality, so the dilution of the other connections is less relevant. note that the marginal effect of a single ad for the extension on the association between the brand and a positive social attribute is again consistent. Using exactly the same math as above, we see that advertising that enforces the association between the brand and a positive attribute will weakly increase the marginal utility of both the original and expanded products at all consumption levels.
Trivial attributes, trademarks, and negative associations
Under the federal Trademark Dilution Act (1995), dilution is defined as "diminishing the ability of a well-known mark to identify and distinguish goods or services." Don't you think in your mind that the world is flooded with Coca-Cola signs?
Implications for Firms
Application to a market with a single good
- Monopoly
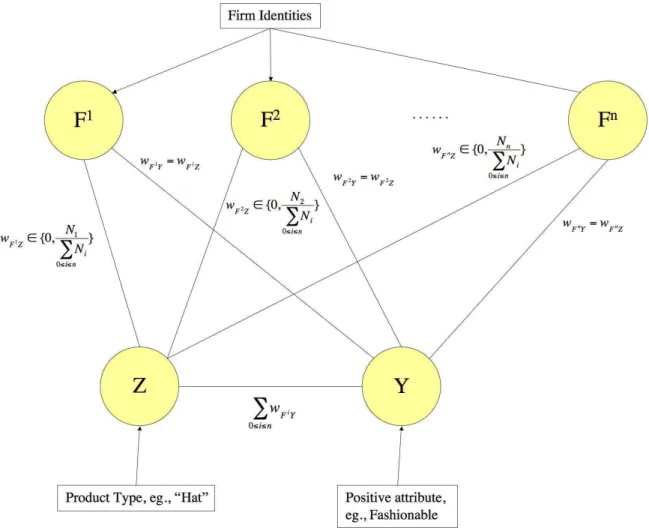
- Oligopoly
We call the number of firms that can actually participate in the high-Y market the high-Y market capacity and show that this capacity is decreasing. The number of firms advertising must be less than the capacity of the high-Y market. If too many firms enter the high-Y market, those firms have an incentive to stop advertising and participate in the low-Y market.
Product Differentiation
- Product differentiation without a shared social or experience attribute 63
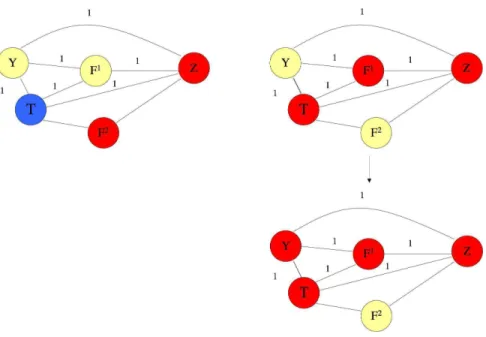
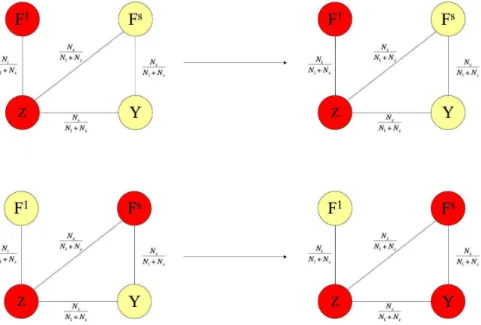
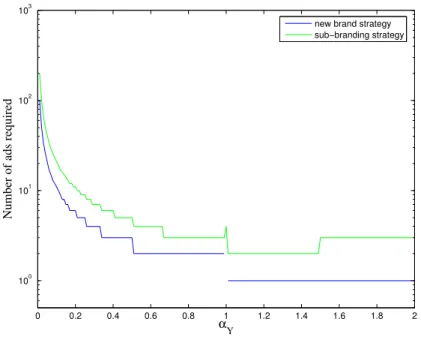
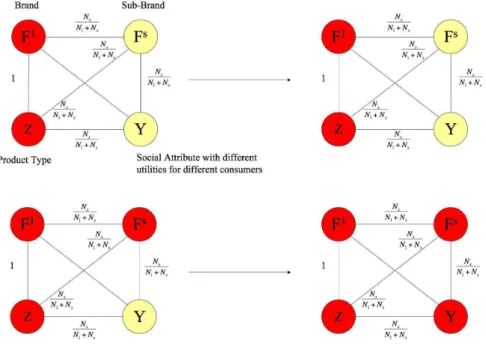
Greg Stine, a marketing expert who criticizes sub-branding as a strategy, said: "However, the smarter, long-term plan is to apply the same branding techniques used to create your successful brand and create a new, distinct new entity . The network for the new brand strategy is shown in Figure 1.15 with the connection weights labeled. To better understand this strategy, we will look at the dynamics of a 5-node network with characteristics (F1, Fs, Z, R, Y). The firm wants to diversify overY while maintaining an association with R.
Limits
Similarly, celebrity endorsements are meant to associate a brand with the celebrity's positive social characteristics. In general, the model described in this paper is best suited to handle social as opposed to experiential properties. This will be especially the case when subjects are specifically motivated to report their beliefs about product benefits as opposed to simply choosing.
Parameter Estimation
Problems formulated in this way are more likely to involve higher cognitive functions (“System II” in Kahneman's language (34)). The most direct way to measure activation thresholds would be to measure how much priming is required for the subject to freely recall the attribute. The difference in reaction times is used to measure the degree of association or dissociation between concepts.
Testable Implications
This means that ads for luxury cars that indicate status should not affect the overall demand for sedans (ie, luxury will not spill over to competitors). Thus, advertisements claiming that Honda sedans are better for the environment should affect the demand for sedans globally. For example, if Coca-Cola does not differentiate its extension Diet Coke Plus from the original Diet Coke, the demand for both products should be equal to the previous demand for Diet Coke alone.
Extensions
- Experiences and The Multi-period Model
- Identity and Social Networks
- Complements
- Determining the Consideration Set
- Order effects of choice
- Controlling the updating path
We model the context effects as a “stimulus” for the consumer, which is simply a state of the networkV ∈ S. In this model, the initial informationX network is exogenous and the evaluation of a choice is independent of the order of evaluation. Instead of setting the state of the network to X, we can think of a vector of external input IE.
Welfare Implications
To model this, it is again useful to think of the information as an external input to a particular node. One way to think of this is that each new piece of information is "checked" against what is already known, as represented by the network's state V. This extension of the neural network model implies that placing racial information at the end of a CV in contrast to the beginning can dampen this bias.
Conclusion
The interconnected nature of the network model means that the externalities are almost impossible to avoid. This essentially states that the relevant threshold for the energy function depends on the state of the node. If Vi=−1, the relevant threshold is −αi since passing this threshold will change the state of the node.
Conditions on advertising and entry in oligopoly — from section 1.6.1
Conditions on price
Since the cost is convex, this second part of the second condition gives us a lower bound onq. This means that the upper solution toπho(q)−πlo(q)−cA= 0 forms the lower bound for q. So we need only consider the first case where the firm raises the level of advertising enough to monopolize the high-Y market.
Conditions on k
- Introduction
- Why study choices, beliefs and 2 nd order beliefs?
- Neuroeconomics, and what it is good for
- Neural correlates of strategic thinking
- Methods
- Behavioral data
- Differential neural activity in choice ( C ) and belief ( B ) tasks
- Equilibrium as a state of mind: Choice and belief in- and out-of-equilibrium . 112
- Individual differences: Brain areas that are correlated with strategic IQ
- Discussion and conclusion
- Other neuroscientific evidence on strategic thinking
- What we have learned
One way the brain achieves balance is that the neural activity in tasks C, B, and 2B is similar, because in balance all three tasks "contain" the others, ie. the first focus is the difference between choice and belief expression (ie, a comparison between behavior and fMRI activation under CandB conditions). C (the dominant strategy is "erased", in game theory parlance - i.e. the player in the column thinks that C will never be played by the player in the payoff-maximizing row), then strategy BB becomes the dominant strategy for the player in the column.
They found that the amount the second player actually gave was modestly correlated (.44) with the amount the second player thought the first player expected (i.e., the second player's 2nd-order belief). More interestingly – and this is a foreshadowing of brain activity that we will see later – the frequency with which choices correspond to 2nd-order beliefs (C = 2B) is actually higher, for all classes of games, than the frequency with which B =br(2B ) (75% versus 63% overall).

Data Tables
Instructions to Subjects
Introduction
The buyer knows his value, but the seller only knows that the value is uniformly distributed. In the standard analysis (which assumes self-interest and no computational cost), the seller realizes that the buyer's proposal is always designed to get her (the seller) to quote a lower price. But since the buyer's value is always above the seller's cost (zero), a failure to trade is socially inefficient.
Background
- Neuroscience
From the perspective of the person receiving the information, responding to potential fraud can be difficult as the decision maker must ignore some or all of the information provided. At the beginning of each trial, subjects are told to read a word or name the color of ink. The second is a system that includes various parts of the basal ganglia (subcortical areas of the brain, which are some of the oldest areas of the brain from an evolutionary perspective) and the OFC.
The Bargaining Task
- Predictions
If p≤ v, a trade has occurred in this round; the buyer receives the difference between the value and the price (surplus in the economic sense)v−and the seller receives a net profitp. For a seller, it's always been a first-order belief: what do you think the buyer is worth. Although subjects received no feedback about the outcome of each trial, both buyer and seller were made aware of the buyer's proposal history during the course of the trial.

Behavioral Results
The sizes of the circles for each subject role are proportional to the R2 statistic for the regression. We found that 68% of trades occurred across all 20 buyer-seller pairs; in eight of the 20 pairs at least 75% of the feasible trades were made. The effectiveness of pairs was weakly correlated with the information disclosure and information sensitivity of the buyer/seller pair.
- Correlates to Suspicion
- Correlates to Deception
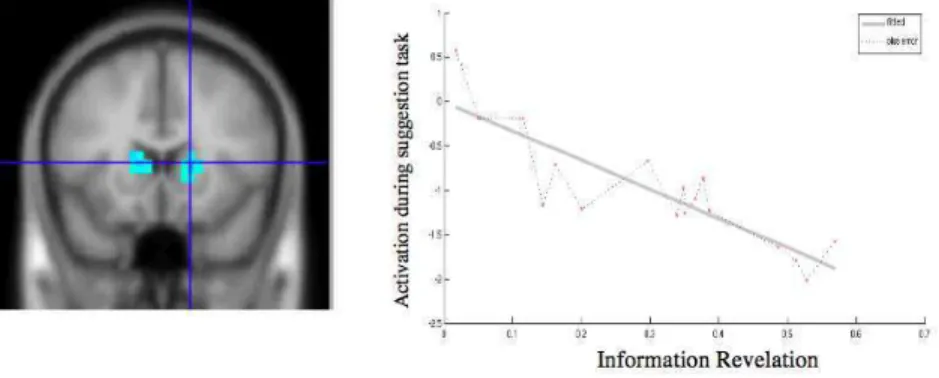
Activity in the anterior cingulate (ACC) is decreasing in slope, and activity in the right temporal pole is increasing in slope (Figures 4 and 5 show sections and scatterplots). We also found interesting activations that correlate with the within-subject, trial-by-trial parameter, of the price market, i.e. the difference between a seller's chosen price and and the cheap voice signal they receive from the buyer. In both cases, areas of the brain necessary for effortful behavior, inhibition of a prepotent response in the RDLPFC for sellers and engaged in goal-directed behavior for buyers, are negatively correlated with gullibility and honesty (i.e. they are correlated with suspicion and fraud) ) .

Predicting behavior from neural activity and future experiments
Another candidate prediction comes from the positive correlation between right DLPFC activity and higher price markups (sellers' prices above buyers' suggested prices). As described above, Knoch et al successfully used TMS to disrupt brain activity in the right DLPFC and make players in ultimatum games accept low offers more often. Similarly, a prediction from the DLPFC markup link we see is that if TMS was used to disrupt activity in the right DLPFC in our task, markups would be reduced.
Conclusion
Proposition C.0.1 The only Bayes-Nash equilibrium in the one-shot game is one in which the buyer's proposal is uninformative. First note that since n is the lowest price charged given any indicative price, proposals in S0 strictly dominate other strategies for buyers with valuen+ 1, since any other price yields a payoff of 0. In other words, any proposed price that actually sent by the buyer in equilibrium has no effect on the seller's pricing strategy.