to climate change
J. Emmett Duffya,1, Jonathan S. Lefcheckb, Rick D. Stuart-Smithc, Sergio A. Navarreted, and Graham J. Edgarc
aTennenbaum Marine Observatories Network, Smithsonian Institution, Washington, DC 20013-7012;bDepartment of Biological Sciences, Virginia Institute of Marine Science, The College of William & Mary, Gloucester Point, VA 23062;cInstitute for Marine and Antarctic Studies, University of Tasmania, Hobart, TAS 7001 Australia; anddEstación Costera de Investigaciones Marinas and Center for Marine Conservation, LINC-Global, Pontificia Universidad Católica de Chile, Casilla 114-D, Santiago, Chile
Edited by James A. Estes, University of California, Santa Cruz, CA, and approved April 13, 2016 (received for review December 11, 2015) Fishes are the most diverse group of vertebrates, play key functional
roles in aquatic ecosystems, and provide protein for a billion people, especially in the developing world. Those functions are compromised by mounting pressures on marine biodiversity and ecosystems. Because of its economic and food value, fish biomass production provides an unusually direct link from biodiversity to critical ecosystem services. We used the Reef Life Survey’s global database of 4,556 standardized fish surveys to test the importance of biodiversity to fish production relative to 25 environmental drivers. Temperature, biodiversity, and human influence together explained 47% of the global variation in reef fish biomass among sites. Fish species richness and functional diversity were among the strongest predictors of fish biomass, particularly for the large- bodied species and carnivores preferred by fishers, and these biodi- versity effects were robust to potentially confounding influences of sample abundance, scale, and environmental correlations. Warmer temperatures increased biomass directly, presumably by raising me- tabolism, and indirectly by increasing diversity, whereas temperature variability reduced biomass. Importantly, diversity and climate inter- act, with biomass of diverse communities less affected by rising and variable temperatures than species-poor communities. Biodiver- sity thus buffers global fish biomass from climate change, and con- servation of marine biodiversity can stabilize fish production in a changing ocean.
global change|fisheries|functional diversity|macroecology|
structural equation model
U
nderstanding the controls on marine fish biomass production is central to both sustaining ecosystems and human devel- opment goals. Ultimately, the quantity and distribution of biomass in ecosystems is determined by availability of resources and the physical conditions that make life possible. Temperature is a fundamental control on rates of cellular metabolism and biological processes at all levels (1) and, together with the solar energy and mineral nutrients that support plant growth, sets the template for global patterns of biomass production and other biological activ- ities. Superimposed on this bottom-up control are interactions among organisms that mediate biomass production. Top-down control by consumers commonly limits biomass of lower trophic levels below what resources could support (2), with often far-reaching direct and indirect effects on ecosystems (3). Human harvesting is increasingly the dominant top-down control in many ecosystems (4) and, in the ocean, industrializedHomo sapienshas emerged as both a dominant and a keystone predator, strongly reducing fish biomass and transforming marine ecosystems worldwide (5, 6).Fundamental to the interactions of organisms with one another and with the environment is evolutionary adaptation, which molds populations toward more efficient resource use and, consequently, greater biomass production. In natural, environmentally hetero- geneous ecosystems, theory predicts that this adaptation results in
positive effect of biodiversity on productivity (8), and suggests that such biodiversity effects are comparable in magnitude to those of other global-change drivers (9). Because resource use efficiency is mediated by functional traits of organisms, functional diversity may be a more direct measure of a community’s capacity for production than species richness (10). As such, theory predicts (11) and ex- periments confirm (12) that functional differences among species result in diverse communities having more stable community-level production in the face of perturbations. Most of these inferences, however, come from highly controlled, often trophically simplified, and artificial experiments (10), and the influence of biodiversity on productivity in wild ecosystems remains controversial, reflecting a long-running debate over both the importance of biodiversity relative to other global-change drivers, and the difficulty of disentangling their influences using observational data (13, 14).
Resolving the controversy over the contributions of bio- diversity to productivity and stability has important implications for conservation and fishery management because the major drivers of biomass production—temperature, resources, fishing, and bio- diversity—are changing rapidly alongside growing human pop- ulation and resource consumption. Biodiversity is declining on average at marine sites impacted by human activity (15), and is decreasing globally at rates orders-of-magnitude above historical background levels (6, 16), with some suggesting that biodiversity loss is already approaching a planetary tipping point beyond which ecosystems may be irreparably compromised (17). This information raises a practical question: how does declining biodiversity affect the resilience of ecosystems to other stressors, specifically climate change and human harvesting?
Quantifying the influence of declining biodiversity on ecosys- tem services remains a major challenge (18) because interactions
Significance
Marine fisheries provide a major global source of protein, feeding billions of people, but they face destabilization in many regions from overexploitation and climate change. Using the most comprehensive dataset of fish diversity and abundance, encompassing over 4,500 surveys from nearshore habitats around the world, we show that biodiversity is among the strongest predictors of reef fish community biomass, comparable in importance to global temperature gradients and human im- pacts. Importantly, diverse fish communities were more resistant to rising and variable temperature, suggesting that high bio- diversity also buffers against changing climate. Maintaining tax- onomically and functionally diverse fish communities can thus stabilize fisheries’yields in a changing ocean.
Author contributions: J.E.D., R.D.S.-S., and G.J.E. designed research; R.D.S.-S. and G.J.E.
performed research; J.E.D. and J.S.L. analyzed data; and J.E.D., J.S.L., R.D.S.-S., S.A.N., and G.J.E. wrote the paper.
The authors declare no conflict of interest.
ficult to link and quantify (20). Fish biomass production is an important exception to the latter rule in that it is simultaneously a biophysical process and an economically quantifiable ecosystem service. The influence of changing biodiversity on harvestable fish biomass thus represents an unusually direct link from biodiversity to a major ecosystem service. We quantified this relationship using a global dataset of>4,500 surveys of fish assemblages inhabiting shallow, hard bottoms throughout the world ocean collected using standardized protocols (21). We apply path analysis using hierar- chical mixed models to ask: How do changing climate, biodiversity, and other drivers influence global reef fish biomass? And how do these factors differ between industrialized temperate regions and the less-developed tropics where people depend more on fish protein?
Results and Discussion
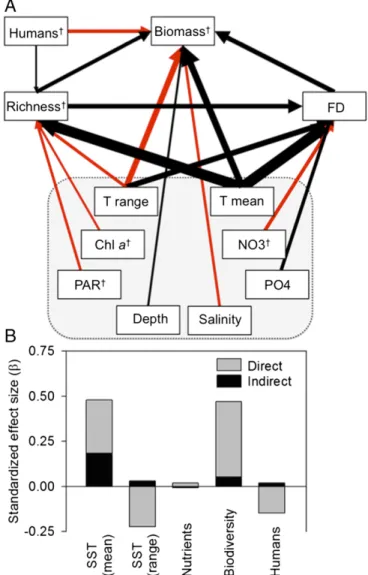
Our results confirm that on a global scale, temperature is the dominant control on reef fish biomass, acting both directly and indirectly by increasing fish species richness and functional di- versity (Fig. 1). Temperature is well documented as a fundamental driver of metabolism and production (1) and a strong determinant of species-richness patterns (22). Our analysis unites these results, revealing that roughly one-third of the temperature effect on global reef fish biomass is indirect, acting by boosting fish species and functional diversity, which in turn increases biomass (Fig. 1).
The direct effect of temperature on biomass across the global range (Figs. 1 and 2C) primarily reflects strong temperature- dependence of biomass in cool temperate regions (Fig. 3EandF).
Our most striking finding is the strong and consistent effect of biodiversity on global reef fish biomass. Species richness and functional diversity both enhanced fish biomass, and were the strongest predictors after temperature, followed closely by human impacts (Figs. 1 and 2C, andSI Appendix, Table S1). These bio- diversity components were also the two top predictors of fish biomass in an independent random forest analysis that accounted for 25 other variables, including temperature (SI Appendix, Fig.
S2). Biodiversity effects on biomass are difficult to isolate from other influences in observational data, especially the inherent correlation between abundance and richness. Therefore, we probed this result with a series of tests to identify potentially confounding effects of sample size, sampling scale, structural complexity (coral cover), and other potentially spurious correlations. The increase in fish biomass with diversity was robust to all these potential artifacts (SI Appendix). Moreover, comparison of several alternative model fits confirmed at the global level the prior finding from tropical systems (23), that fish biomass scales in a nonsaturating way with richness and is best represented by a decelerating power function (SI Appendix), also matching the pattern seen in recent results from long-term diversity manipulations in grasslands (24). When plotted on log–log axes, it is evident that biomass scales with estimated richness with a shallower slope in the tropics than in temperate sites (Fig. 2AandB).
Our finding that biodiversity is a major determinant of fish biomass is strengthened by the Reef Life Survey’s unique global scope, standardized methods, integration across trophic levels, and the inclusion in our analyses of a rich suite of environmental covariates. To our knowledge, this represents the most com- prehensive observational test yet of diversity effects on biomass in any natural ecosystem, and corroborates previous results from controlled diversity manipulations (8, 9). Importantly, our data show that changing biodiversity is a major control on the globally important ecosystem service of reef fish biomass production, comparable to climate and human impacts. An earlier synthesis of experimental and observational data similarly reached the conclusion that marine fish diversity enhanced fishery catch and
other reasons (26, 27). Our analysis accounts for these and other potentially confounding factors, and confirms that biodiversity is indeed a major determinant of global reef fish biomass.
Along with climate and biodiversity, we find that human activ- ities are similarly important as planet-scale environmental gradi- ents in influencing biomass of fish communities on nearshore hard bottoms. Fish biomass declined substantially with proximity to human population in our global analysis (Fig. 1 and 2C), especially in the tropics, where human population was the single strongest predictor of reef fish biomass (Fig. 3F). Because human pop- ulation is closely correlated with fishing pressure, coastal devel- opment, and eutrophication (23), isolating the specific causes of this human impact is challenging. A strong role for fishing as the primary driver is suggested by our finding that human impact was strongest on larger size classes (SI Appendix, Fig. S3), and on top and benthic carnivores (Fig. 3AandB), which are most prized by fishers (28), as shown previously for reef fishes (29). One possible
Fig. 1. (A) Path diagram of factors influencing global reef fish biomass.
Black and red paths represent positive and negative influences, respectively.
Path thickness is proportional to the standardized regression coefficient (SI Appendix, Table S1). Paths ofβ<0.05 are not shown. Gray box surrounds abiotic variables (and chla), for which paths have been omitted for clarity and are shown inSI Appendix, Fig. S1.†Log10-transformed. FD, functional diversity; T, sea-surface temperature. (B) Summed direct and indirect effects of temperature, mineral nutrients, biodiversity, and human population density.
ECOLOGY
that is, the result of a shifting baseline. This finding is supported by the high and relatively invariant (log) human population index among temperate (mean±SD=4.71±0.90) compared with tropical sites (2.61±2.23, respectively), and by the unstandardized (i.e., raw) effects of human population, which are comparable between tem- perate (β=−0.072±0.031) and tropical sites (β=−0.058±0.015).
Thus, the smaller relative impact of humans at temperate sites (Fig. 3EandF) probably reflects the rarity of sparsely populated sites, and accordingly smaller gradient in human population outside the tropics. Our results may therefore reflect both strong historical impacts of human activities on temperate fishes, as well as emerging impacts in less-populated tropical sites.
Human influence also appeared to shift ecosystem control from bottom-up to top-down: considering only tropical sites (because all temperate sites had nearby human population), sites far from human influence showed a dominant signal of bottom-up forcing by dissolved phosphate, a key limiting nutrient in oligotrophic waters. In contrast, sites close to human population showed no phosphate effect and instead a modest but highly significant in- crease in fish biomass with depth (SI Appendix, Fig. S4), a pattern often associated with intensive fishing in shallow waters (30). This apparently human-mediated shift from bottom-up to top-down forc- ing supports previous analyses (31) and may explain the otherwise surprising weakness of nutrient effects on fish production in the global analysis (Fig. 1), which seems at odds with some regional analyses supporting bottom-up control of fish biomass in pelagic and sediment-bottom habitats (32, 33). The strong impact of humans on global reef fish biomass and trophic control illus- trates clearly that human activity has become a pervasive force of marine nature.
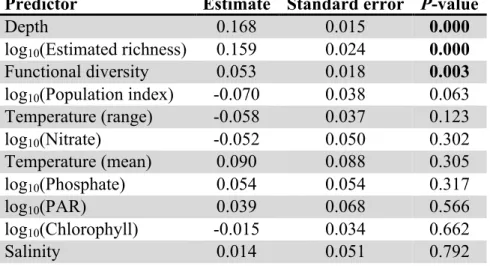
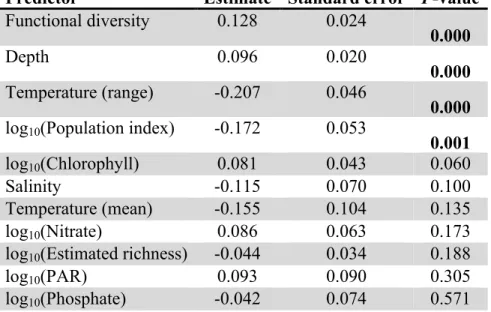
All fishes do not contribute equally to the ecosystem service of
preferentially target large individuals, which also include top car- nivores (28). Our data corroborate this behavior, showing that human impacts are strongest on large fishes (>35 cm) (SI Ap- pendix, Fig. S3) and on top and benthic carnivores (Fig. 3). Im- portantly, biodiversity remains among the strongest predictor of biomass for the largest fishes (SI Appendix, Fig. S3) and for top carnivores (Fig. 3), rivaling or surpassing the effect of temperature at the global scale. In the tropics, biodiversity and human impacts were in fact the only significant predictors of large fish biomass (SI Appendix, Fig. S3D). These effect sizes (partial regression coeffi- cients) account statistically for other predictors in the model, and therefore quantify the effect of biodiversity at a given level of human impact (e.g., harvest). Thus, our global analysis provides strong evidence that maintaining biological diversity enhances the ecosystem service of high-value harvestable fish production.
A frontier in global-change research is understanding how different stressors interact. The link between biodiversity and biomass raises the question of how biodiversity affects responses of fish biomass to ongoing climate change and human impacts.
Because biodiversity is strongly controlled by temperature, chang- ing climate is expected to reorganize marine communities, as is already happening (34–36). Our results show that this reorganization has important consequences for fish biomass production because higher diversity buffers fish biomass against expected direct effects of climate. First, although climate variability (temperature range) re- duced fish biomass on average, this effect was halved in the richest communities (Fig. 2GandHandSI Appendix, Table S2), possibly because species-rich communities harbor fishes with a range in thermal niches. The stronger decline in low-richness fish communi- ties is not explained by lower coral cover at those sites (SI Appendix), and remained significant after excluding sites with sea-surface tem-
temperature at low- and high-richness sites (relative to median richness), respectively. (GandH) Log biomass as a function of annual temperature range at low- and high-richness sites, respectively. S, estimated richness. Blue and green symbols represent tropical and temperate sites, respectively.
(Akaike Information Criterion confirmed that the quadratic fit was better than linear), increasing over the low range and declining again at the highest temperatures, whereas in high-richness com- munities fish biomass showed a weaker, linear increase with tem- perature (Fig. 2EandF). In short, diversity tends to stabilize fish biomass production against rising and more variable temperatures.
This finding suggests that the buffering capacity of biodiversity against climate variability may be a general phenomenon because it has also been documented in grassland plants (37).
Tropical ecosystems were especially sensitive to human impacts (Fig. 3F) and are considered highly vulnerable to warming-induced reduction in species richness because of strongest warming in tropical (and polar) regions and because many tropical species are near their upper thermal tolerance limits (19, 38). Our analysis suggests, however, that vulnerability of fish biomass to warming should be buffered in tropical communities as a result of their high diversity, which provides resilience to both increasing mean tem- peratures and increasing climate variability (Fig. 2 E–H and SI Appendix, Table S2). To explore more broadly the sensitivity of marine ecosystems to biodiversity loss, we obtained separate esti- mates of the dependence of biomass on richness for each of the 68 ecoregions for which estimates could be reliably obtained (39). Fish biomass was most sensitive to changing fish diversity at cooler, nutrient-rich sites also characterized by low richness and abun- dance (Fig. 4). The relative importance of these influences is dif- ficult to disentangle because they tend to occur together. However, the explanation suggested by theory and prior empirical results is that the naturally low species richness at cooler sites results in low functional redundancy. Thus, at cooler, less diverse sites species fill more unique roles on average (40) and loss of a single species reduces biomass production more than it does at richer sites, where the remaining ecologically similar species can compensate for that loss (41). This finding implies that high-latitude marine ecosystems are especially ecologically vulnerable to climate change, due not only to higher projected invasion rates (19), but also to stronger impacts of species loss on production (Fig. 4) and stronger trophic cascades (31), compared with lower latitudes.
Although high diversity thus appears to buffer reef fish com- munities against climate change, diversity provides no such benefit to other impacts of human population. A previous analysis reported a negative interaction between (trophic) diversity and human population density for tropical reef fish biomass (23). In our more geographically comprehensive analysis, we found no interaction between human density and either species richness or multivariate functional diversity (SI Appendix, Table S2). However, fishing pressure and high temperatures act synergistically to increase vul- nerability of coral reef fishes (42), potentially explaining our finding of greater sensitivity of reef fish biomass to human impacts in the tropics (Fig. 3). Moreover, many tropical fishes and reef corals
likely have serious negative consequences for associated reef fishes (44). These considerations illustrate that biodiversity can interact differently with different stressors and underscore the importance of reducing overfishing and conserving habitat, including coral reefs, to maintain marine biodiversity and ecosystem services.
In summary, our analysis of global, fishery-independent data provides a uniquely powerful test of the long-debated questions of whether biodiversity promotes greater production and stability in nature, how important those biodiversity effects are relative to other drivers, and how they interact. We find that biodiversity is equally and often more important than water quality, nutrient supply, and human influence in controlling the global distribu- tion of reef fish biomass, and that more diverse fish communities are more resilient to impacts of changing climate. Moreover, both species richness and functional trait diversity contributed roughly equally to fish biomass globally, generalizing local in- ferences that reef fish trophic interactions (45, 46) and functional diversity (47–49) are key mediators of the community structure and resilience of coral reef ecosystems. Because reef fish biomass provides an important protein source for many people, particu- larly in the developing world, our results suggest that manage- ment to sustain reef fish diversity, of both species and functional types, will also promote higher productivity of fish biomass and higher resilience of that ecosystem service in the face of rising and more variable temperatures.
Materials and Methods
Reef Life Survey. Standardized quantitative censuses of reef fishes were undertaken by trained recreational SCUBA divers on shallow hard substrate habitats worldwide through the Reef Life Survey program. Data came from 4,556 transects at 1,844 sites, from 55°S to 78°N latitude, and 74 ecoregions and 11 realms (39). Details of fish census methods, data quality, and diver training are in refs. 21, 40, and 50, and an online methods manual (reeflifesurvey.com). Fish counts per 500-m2transect (2×250-m2blocks) and size estimates were converted to biomass estimates using species-specific length–weight relationships from Fishbase (www.fishbase.org). Where length–weight relationships were described in Fishbase in terms of standard or fork length, equations in Fishbase allowed conversion to total length. Bias in divers’perception of fish size underwater was corrected using empirical calibrations (51). Length–weight coefficients from similar-shaped close rel- atives were used for species whose length–weight relationships were not available in Fishbase.
Selection of Variables Used in Models.As the primary response variable in all of our analyses, we focused on fish biomass rather than productivity because productivity is estimated from biomass and temperature, and is thus a more derived variable. The inclusion of temperature in the equation to estimate productivity also precludes a rigorous test of the effect of temperature on productivity. Biomass is a logical metric of many ecosystem functions per- formed by fishes because it is tightly linked to many components of me-
ECOLOGY
challenge to estimating biodiversity effects on biomass from observational data is the inherent positive correlation between estimated species richness and the number of individuals sampled, obscuring the direction of causality between abundance (or biomass) and richness. We derived estimates of species richness that account for this dependency using fixed-coverage subsampling (52). This approach first computes a rarefaction curve for a given survey by randomly sampling individuals from the survey and calculating for each such subsample the probability that adding a new individual will add a new species; this then allows, by rarefaction (of high-richness samples) or ex- trapolation (of low-richness samples) a measure of sample completeness: that is, the proportion of the total number of individuals in the community that belong to species represented in the survey (52). Once this process is com- pleted, survey richness is compared at a common (fixed) value of coverage that can be estimated reliably from all samples in the dataset. We used a value of 99% coverage (completeness), meaning that for any survey a new individual fish added to a survey would have a 99% probability of belonging to a species already represented on the survey. This criterion was met by 97% of the sur- veys in our dataset; the remaining surveys were discarded from the analysis either because they sampled too few individuals or too many individuals of the same species (e.g., a large school of one species) to construct a reliable rare- faction curve. By accounting for the dependence of richness on sample size, the fixed-coverage estimate of richness minimizes the possibility that observed correlations between richness and biomass result simply from larger samples (higher fish densities) capturing more species. This coverage-based estimate of richness yields conservative estimates of the importance of diversity to biomass; fitting the same models with raw number of species recorded per transect produced substantially higher partial coefficients for effect of rich- ness on biomass (SI Appendix, Table S1).
Second, we estimated functional diversity based on data on eight traits and using Rao’s quadratic entropy (Q). Rao’sQis not constrained to increase with increasing richness (53), and thus can be treated as an independent predictor of diversity in our analyses. Functional diversity was further transformed by 1/(1–Q) to express it in comparable units to species richness: that is, the ef- fective number of functionally unique species in the sample (54). The eight traits used to calculate functional diversity (SI Appendix, Table S3) came from the database used by Stuart-Smith et al. (40); details of trait assignment and values are provided in that report. Traits were chosen to encompass attributes known to influence functional roles in a fish assemblage, including life history, trophic position, behavior, and habitat associations (SI Appendix, Fig. S5B).
We assembled data on 25 environmental and human-impact variables taken from the Bio-ORACLE dataset (55), a comprehensive, uniform, high-resolution
water-quality parameters, including dissolved nutrients, were spatially inter- polated based on data from in situ surface measurements in the World Ocean Database 2009 (56). An index of human population was calculated by fitting a smoothly tapered surface to each settlement point on a glp00g world population density grid using the quadratic kernel function described by Silverman (57). Populations were screened for a density greater than 1,000 people per 0.04° cell and the search radius was set at 3.959°.
To reduce the list of predictor variables to a more manageable set, we first conducted a random forest analysis to identify those with the most explanatory power (SI Appendix, Fig. S2). Random forest analysis is a machine-learning technique that is insensitive to underlying distributions, collinearity, or inter- actions among variables, and thus is ideal for ranking closely related or in- teracting variables (58). Because random forests can be sensitive to overfitting, we pruned the forest to 100 trees based on visual assessment of change in mean-square error with increasing number of trees. We then selected 12 of the top variables to use as the starting point for linear modeling, choosing in decreasing order of explanatory power (percent change in mean-square error of the model based on random permutations of that variable), with the ex- ception that we excluded variables describing local conditions, like algal cover and pollution because these had relatively few measured observations and were largely interpolated. We then subjected the chosen predictor variables to variance inflation factor analysis to assess collinearity. After removing the predictor with the highest value (minimum SST, variance inflation factor= 52.3), the remaining 11 variables had variance inflation factor values<4 and were retained in the global model. The centering and scaling of predictors used to generate the final linear models and corresponding path coefficients should also alleviate the influence of collinear variables. The final list of pre- dictors retained for model building included: log-estimated species richness, functional diversity, log human population index, mean annual SST, salinity, survey depth, log phosphate concentration, range in annual SST, log chloro- phyll concentration, log photosynthetically active radiation, and log nitrate concentration.
Modeling Approach.We used two general approaches to analyze controls on global reef fish biomass. First, we evaluated controls on fish biomass using hierarchical linear models, including the 11 predictor variables that emerged from our variable selection process described above. Fish biomass was modeled at the site level, with the response variable being mean total biomass of fish per survey at a site; the random effect of site was nested within ecoregion and realm, and the intercept of estimated richness was allowed to vary among ecoregions. This model structure was used in separate analyses of fish biomass
from all exogenous variables plus remaining endogenous variables, with the proviso that the model was nonrecursive (i.e., with no reciprocal paths be- tween the same variables). Thus, nitrate and phosphate were modeled as a function of all other abiotic variables plus human population; richness and functional diversity were modeled as a function of all abiotic variables plus human population, and biomass was modeled as a function of all 11 vari- ables (Fig. 1 andSI Appendix, Fig. S1). The overall path model was evaluated using Shipley’s test of directed separation (59), which yields a Fisher’s C statistic that can be compared with a χ2-distribution. If the resulting Pvalue is>0.05, then the model can be said to adequately reproduce the hypothesized causal network.
To examine how the richness–biomass relationship varied geographically, we fit the richness–biomass relationship separately for each of the world’s 68 marine ecoregions (39) for which we have sufficient survey data, using a hierarchical model and allowing the slope of the richness effect to vary by
and ecoregion environmental characteristics.
ACKNOWLEDGMENTS. We thank the many Reef Life Survey divers, re- searchers, and managers who participated in data collection and provide ongoing expertise and commitment to the program; University of Tasmania staff responsible for Reef Life Survey data management, Antonia Cooper and Just Berkhout; Stuart Kininmonth for providing the population index and mapping; and Doug Rasher and an anonymous reviewer for comments that improved the manuscript. Additional support was provided by the former Commonwealth Environment Research Facilities Program, the Ian Potter Foundation, the Australian Research Council, the Institute for Marine and Antarctic Studies, the Marine Biodiversity Hub, a collaborative partnership supported through the Australian Government’s National Environmen- tal Science Programme, and the Smithsonian Institution. This is contribution 9 from the Smithsonian’s Tennenbaum Marine Observatories Network.
1. Brown J, Gillooly J, Allen A, Savage V, West G (2004) Toward a metabolic theory of ecology.Ecology85(7):1771–1789.
2. Borer ET, Halpern BS, Seabloom EW (2006) Asymmetry in community regulation: Ef- fects of predators and productivity.Ecology87(11):2813–2820.
3. Estes JA, et al. (2011) Trophic downgrading of planet Earth.Science333(6040):
301–306.
4. Darimont CT, Fox CH, Bryan HM, Reimchen TE (2015) Human impacts. The unique ecology of human predators.Science349(6250):858–860.
5. Jennings S, Kaiser MJ (1998) The effects of fishing on marine ecosystems.Adv Mar Biol 34:201–212.
6. McCauley DJ, et al. (2015) Marine defaunation: animal loss in the global ocean.
Science347(6219):1255641–1255641.
7. Tilman D, Lehman CL, Thomson KT (1997) Plant diversity and ecosystem productivity:
Theoretical considerations.Proc Natl Acad Sci USA94(5):1857–1861.
8. Cardinale BJ, et al. (2011) The functional role of producer diversity in ecosystems.Am J Bot98(3):572–592.
9. Hooper DU, et al. (2012) A global synthesis reveals biodiversity loss as a major driver of ecosystem change.Nature486(7401):105–108.
10. Cardinale BJ, et al. (2012) Biodiversity loss and its impact on humanity.Nature 486(7401):59–67.
11. McCann KS (2000) The diversity-stability debate.Nature405(6783):228–233.
12. Gross K, et al. (2014) Species richness and the temporal stability of biomass pro- duction: a new analysis of recent biodiversity experiments.Am Nat183(1):1–12.
13. Hooper DU, et al. (2005) Effects of biodiversity on ecosystem functioning: A consensus of current knowledge.Ecol Monogr75(1):3–35.
14. Srivastava DS, Vellend M (2005) Biodiversity-ecosystem function research: Is it relevant to conservation?Annu Rev Ecol Evol Syst36:267–294.
15. Elahi R, et al. (2015) Recent trends in local-scale marine biodiversity reflect community structure and human impacts.Curr Biol25(14):1938–1943.
16. Dirzo R, et al. (2014) Defaunation in the Anthropocene.Science345(6195):401–406.
17. Rockström J, et al. (2009) A safe operating space for humanity.Nature461(7263):
472–475.
18. Pereira HM, et al. (2010) Scenarios for global biodiversity in the 21st century.Science 330(6010):1496–1501.
19. Jones MC, Cheung WWL (2015) Multi-model ensemble projections of climate change effects on global marine biodiversity.ICES J Mar Sci72(3):741–752.
20. Duncan C, Thompson JR, Pettorelli N (2015) The quest for a mechanistic un- derstanding of biodiversity–ecosystem services relationships.Proc Biol Sci282(1817):
20151348.
21. Edgar G, Stuart-Smith R (2009) Ecological effects of marine protected areas on rocky reef communities—A continental-scale analysis.Mar Ecol Prog Ser388(1817):51–62.
22. Tittensor DP, et al. (2010) Global patterns and predictors of marine biodiversity across taxa.Nature466(7310):1098–1101.
23. Mora C, et al. (2011) Global human footprint on the linkage between biodiversity and ecosystem functioning in reef fishes.PLoS Biol9(4):e1000606.
24. Reich PB, et al. (2012) Impacts of biodiversity loss escalate through time as re- dundancy fades.Science336(6081):589–592.
25. Worm B, et al. (2006) Impacts of biodiversity loss on ocean ecosystem services.Science 314(5800):787–790.
26. Murawski S, Methot R, Tromble G (2007) Biodiversity loss in the ocean: How bad is it?
Science316(5829):1281–1284, author reply 1281–1284.
27. Longhurst A (2007) Doubt and certainty in fishery science: Are we really headed for a global collapse of stocks?Fish Res86(1):1–5.
28. Jennings S, Polunin N (1997) Impacts of predator depletion by fishing on the biomass and diversity of non-target reef fish communities.Coral Reefs16(2):81–82.
29. Soler GA, et al. (2015) Reef fishes at all trophic levels respond positively to effective marine protected areas.PLoS One10(10):e0140270.
30. Hay M (1984) Patterns of fish and urchin grazing on Caribbean coral reefs: Are pre- vious results typical?Ecology65(2):446–454.
32. Ware DM, Thomson RE (2005) Bottom-up ecosystem trophic dynamics determine fish production in the Northeast Pacific.Science308(5726):1280–1284.
33. Nixon SW (1988) Physical energy inputs and the comparative ecology of lake and marine ecosystems.Limnol Oceanogr33(4):1005–1025.
34. Bates AE, et al. (2014) Resilience and signatures of tropicalization in protected reef fish communities.Nat Clim Chang4(1):62–67.
35. Vergés A, et al. (2014) The tropicalization of temperate marine ecosystems: Climate- mediated changes in herbivory and community phase shifts.Proc Biol Sci281(1789):
20140846.
36. Poloczanska ES, et al. (2013) Global imprint of climate change on marine life.Nat Clim Chang3(10):919–925.
37. Isbell F, et al. (2015) Biodiversity increases the resistance of ecosystem productivity to climate extremes.Nature526(7574):574–577.
38. Stuart-Smith RD, Edgar GJ, Barrett NS, Kininmonth SJ, Bates AE (2015) Thermal biases and vulnerability to warming in the world’s marine fauna.Nature528(7580):88–92.
39. Spalding M, et al. (2007) Marine ecoregions of the world: A bioregionalization of coastal and shelf areas.Bioscience57(7):573–583.
40. Stuart-Smith RD, et al. (2013) Integrating abundance and functional traits reveals new global hotspots of fish diversity.Nature501(7468):539–542.
41. Thibaut LM, Connolly SR, Sweatman HPA (2012) Diversity and stability of herbivorous fishes on coral reefs.Ecology93(4):891–901.
42. Graham NAJ, et al. (2011) Extinction vulnerability of coral reef fishes.Ecol Lett 14(4):341–348.
43. Nilsson GE, Crawley N, Lunde IG (2009) Elevated temperature reduces the respiratory scope of coral reef fishes.Glob Change Biol15(6):1405–1412.
44. Graham NAJ, et al. (2006) Dynamic fragility of oceanic coral reef ecosystems.Proc Natl Acad Sci USA103(22):8425–8429.
45. Mumby PJ, et al. (2006) Fishing, trophic cascades, and the process of grazing on coral reefs.Science311(5757):98–101.
46. Hughes TP, et al. (2007) Phase shifts, herbivory, and the resilience of coral reefs to climate change.Curr Biol17(4):360–365.
47. Rasher DB, Hoey AS, Hay ME (2013) Consumer diversity interacts with prey defenses to drive ecosystem function.Ecology94(6):1347–1358.
48. Nash KL, Graham N, Jennings S (2015) Herbivore cross-scale redundancy supports response diversity and promotes coral reef resilience.J Appl Ecol, 10.1111/1365- 2664.12430.
49. Adam TC, Burkepile DE, Ruttenberg BI, Paddack MJ (2015) Herbivory and the resil- ience of Caribbean coral reefs: Knowledge gaps and implications for management.
Mar Ecol Prog Ser520(2015):1–20.
50. Edgar GJ, Stuart-Smith RD (2014) Systematic global assessment of reef fish commu- nities by the Reef Life Survey program.Sci Data1:140007.
51. Edgar GJ, Barrett NS, Morton AJ (2004) Biases associated with the use of underwater visual census techniques to quantify the density and size-structure of fish populations.
J Exp Mar Biol Ecol308(2):269–290.
52. Chao A, Jost L (2012) Coverage-based rarefaction and extrapolation: standardizing samples by completeness rather than size.Ecology93(12):2533–2547.
53. Dukát ZB (2005) Rao’s quadratic entropy as a measure of functional diversity based on multiple traits.J Veg Sci16(5):533–540.
54. Jost L (2007) Partitioning diversity into independent alpha and beta components.
Ecology88(10):2427–2439.
55. Tyberghein L, et al. (2011) Bio-ORACLE: A global environmental dataset for marine species distribution modelling.Glob Ecol Biogeogr21(2):272–281.
56. Boyer PT, et al. (2009) Introduction.World Ocean Database 2009, NOASS Atlas NESDIS 66, ed Levitus S (US Government Printing Office, Washington, DC), Vol 1.
57. Silverman WB (1986)Density Estimation for Statistics and Data Analysis(Chapman and Hall, Boca Raton, FL).
58. Breiman L (2001) Random forests.Mach Learn45(1):5–32.
59. Shipley B (2009) Confirmatory path analysis in a generalized multilevel context.
Ecology90(2):363–368.
ECOLOGY
Supporting information: Appendix 1
Tests for robustness of the richness-biomass relationship. Because our results are based on 2
observational data, establishing causality of the diversity-biomass relationship faces the 3
challenge that richness estimates depend inherently on sample size (number of individuals). We 4
took several measures to evaluate the importance of this effect and minimize it. Most 5
importantly, our estimates of species richness based on sample coverage (1) rigorously account 6
for this dependence, allowing comparisons among samples with different numbers of 7
individuals. To test whether any residual correlation between abundance and richness estimate 8
remained after this correction we conducted three additional analyses. First, we asked whether 9
the richness-biomass relationship was unduly influenced by small samples (surveys with few 10
fish). We created a new data subset by removing all surveys with fewer than 100 individual fish 11
observed, and reran the global analysis on this subset. Fitting the global hierarchical model to 12
this subset (3873 surveys of 4556 in the complete data set) produced slightly smaller estimates of 13
the effects of species richness (standardized β = 0.172 ± 0.034) and functional diversity (0.178 ± 14
0.023) on fish biomass, but these diversity components remained among the strongest predictors.
15
Removal of surveys with fewer than 500 individuals (leaving 2466 surveys) produced a slightly 16
larger estimate of the effect of species richness (0.200 ± 0.042) and a smaller estimate of 17
functional diversity (0.165 ± 0.030). For all of these estimates, P < 0.001.
18
A second analysis similarly supported the robustness of the richness effect on biomass.
19
Comparison of the slope of the richness-biomass relationship estimated separately for each 20
ecoregion showed a stronger relationship in ecoregions with fewer individuals but the effect of 21
estimated richness on biomass nevertheless remained positive even where mean abundance per 22
survey approached 10,000 individuals (Fig. 4a).
23
Third, we partially decoupled the influence of survey-level abundance on richness 24
estimates by using regional species pool size as the estimate of richness in predicting biomass.
25
As an estimate of species pool size we used the observed richness within the surrounding 26
ecoregion. Because the validity of this approach depends on a robust estimate of regional 27
richness, we restricted the analysis to a subset of ecoregions with at least 20 surveys each and 28
included only surveys with >50 individual fish. These criteria ensured that the estimated species 29
pool for each ecoregion in the analysis was based on a minimum of 1000 individuals (i.e., 30
minima of 20 surveys x 50 individuals per survey). Applying these criteria produced a data 31
subset of 1374 surveys (of 4556 total) from 26 ecoregions (of 75 total). Fitting the global model 32
to this data subset produced a standardized estimate of the partial effect of log ecoregion richness 33
on log survey biomass of β = 0.404 ± 0.130 (P = 0.012). Thus, the estimated effect of ecoregion- 34
level richness on biomass was even stronger than that based on survey-level richness, although 35
the P-value was larger due in part to the 70% reduction in sample size compared with the full 36
data set.
37
Finally, there is some evidence that the relationship between species richness and 38
biomass production differs among scales, with stronger relationships at the regional than local 39
scales (2, 3). To explore this possibility we fit parallel models (same set of predictor variables) 40
using survey data aggregated at site and ecoregion scales. Results were generally quite similar 41
among scales, qualitatively and quantitatively (Fig. 2a-d): fish biomass was affected similarly at 42
both scales by diversity, human population, temperature, and depth.
43
A different challenge in testing the diversity-biomass relationships with observational 44
data stems from the possibility that the relationship reflects a shared correlation with some 45
unmeasured variable. We tested for such spurious correlations in two ways. First, we tested 46
whether the diversity effect on biomass was robust to shared correlations by conducting a 47
random forest analysis with species richness, functional diversity, and 25 other predictors, and 48
found that (coverage-corrected) species richness and functional diversity were the top two 49
predictors (SI Appendix, Fig. S2). Second, our use of hierarchical mixed models accounted for 50
shared correlations by measuring environmental and human-impact variables as well as 51
unexplained spatial variation in biomass by including random terms for marine realm, province, 52
and ecoregion. For example, if a bivariate correlation between richness and biomass was actually 53
driven by effects of temperature on both, then including all three variables in a model should 54
return a strong partial effect of temperature on biomass with no partial effect of richness. As a 55
final check on the robustness of our model we tested whether our final selection of variables 56
influenced the estimated richness effect on biomass by refitting the global model with 0-8 57
environmental predictors (functional diversity was left out to simplify the model interpretation), 58
and each time calculated the partial effect of estimated richness. The number of other predictors 59
had almost no effect on the estimated effect of richness (SI Appendix, Fig. S5a). In summary, 60
one or both components of biodiversity were consistently strong predictors of fish community 61
biomass across latitudes, regions, and trophic levels in all our analyses.
62
Finally, diversity can be modeled as a predictor only for sites where fish are present. All 63
surveys used in our analyses recorded fish, but not all trophic groups and size classes were 64
present on all surveys. Therefore, analyses of specific trophic levels and of large fishes used only 65
subsets of the data. To check whether use of such subsets changed our estimates of the effects of 66
predictors, we fit a second set of models for each trophic level, and for large fishes, that excluded 67
diversity as predictors. This ensured that all surveys were included (even those with no 68
individuals of the group in question); the regression coefficients produced by these models (SI 69
Appendix, Figs. S3b, S6) can be interpreted as quantifying the importance of human population 70
and environmental drivers in influencing both presence/absence and abundance of the focal 71
group. The results show that exclusion of diversity in this way generally had little influence on 72
estimates of human and environmental drivers (compare SI Appendix, Figs. S3a,b, S6). The 73
exceptions were top carnivores and planktivores, which showed stronger forcing by temperature 74
when diversity was excluded (compare Figs. 3a,d; SI Appendix, S6a,d); this can be interpreted to 75
mean that top carnivores and planktivores were present primarily at warmer sites.
76 77
Interactions of diversity with stressors. We tested whether species richness stabilized reef fish 78
biomass against stressors by fitting separate models that included interactions of species richness 79
with rising temperature, temperature variability, or human impact (population index) (SI 80
Appendix, Table S2). To explore visually the findings (see Results) that high species richness 81
stabilized biomass against rising and variable temperatures, we divided the dataset into sites 82
below (low-richness) and above (high-richness) the median richness value, and fit separate 83
regressions of biomass against mean annual temperature (Fig. 2e,f) and annual temperature range 84
(Fig. 2g,h).
85
A possible alternative hypothesis for the steeper decline in biomass with temperature 86
range in low-richness communities is that sites with higher temperature variability have lower 87
coral cover, and therefore lower fish biomass. To explore this hypothesis we first fit the global 88
model described above with addition of log coral cover, using only tropical sites since coral is 89
absent or low at temperate sites. Log coral cover had no significant partial effect on fish biomass 90
(β = 0. -0.041 ± 0.039, P = 0.291) when the other predictors were included in the model. We then 91
fit the same model with an interaction between log coral cover and temperature range, to test 92
whether higher temperature range and low coral cover might explain the difference in biomass 93
between low- and high-richness tropical sites. There was no significant interaction between log 94
coral cover and temperature range (P = 0.660). Nor was coral cover lower in more thermally 95
variable tropical environments (P = 0.232).
96 97
References cited 98
1. Chao A, Jost L (2012) Coverage-based rarefaction and extrapolation: standardizing samples 99
by completeness rather than size. Ecology 93(12):2533–2547.
100
2. Bond EM, Chase JM (2002) Biodiversity and ecosystem functioning at local and regional 101
spatial scales. Ecol Letters 5:467–470.
102
3. Chase JM, Leibold MA (2002) Spatial scale dictates the productivity-biodiversity 103
relationship. Nature 416(6879):427–430.
104 105 106
Table S1: SEM coefficients, standard errors, and P-values for the hierarchical model fit 107
separately for the global data set, temperate and tropical data sets, individual trophic levels, for 108
large (> 35 cm) fishes, and using observed rather than estimated richness.
109 110
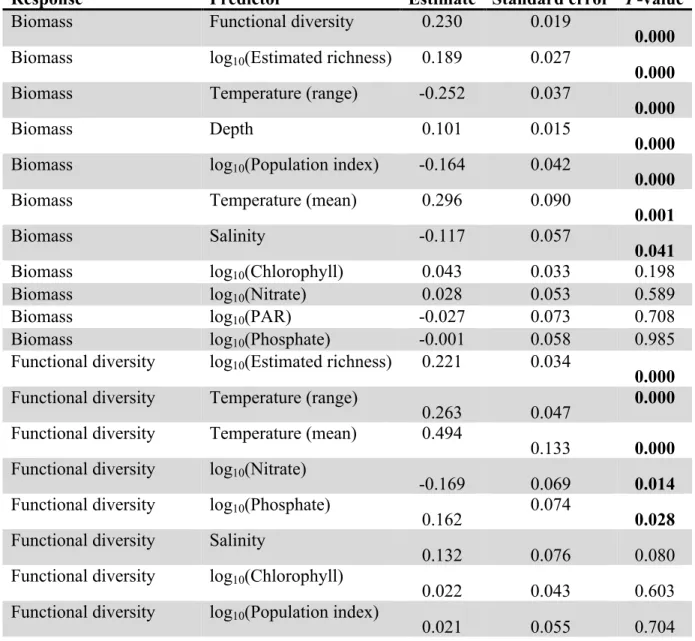
Table S1a: Standardized coefficients (scaled by mean and variance) from the global structural 111
equation model including all fishes. Coefficients correspond to arrow widths in Figure 1a and 112
Extended Data Figure 1.
113
Response Predictor Estimate Standard error P-value
Biomass Functional diversity 0.230 0.019
0.000 Biomass log10(Estimated richness) 0.189 0.027
0.000
Biomass Temperature (range) -0.252 0.037
0.000
Biomass Depth 0.101 0.015
0.000
Biomass log10(Population index) -0.164 0.042
0.000
Biomass Temperature (mean) 0.296 0.090
0.001
Biomass Salinity -0.117 0.057
0.041
Biomass log10(Chlorophyll) 0.043 0.033 0.198
Biomass log10(Nitrate) 0.028 0.053 0.589
Biomass log10(PAR) -0.027 0.073 0.708
Biomass log10(Phosphate) -0.001 0.058 0.985
Functional diversity log10(Estimated richness) 0.221 0.034
0.000 Functional diversity Temperature (range)
0.263 0.047 0.000
Functional diversity Temperature (mean) 0.494
0.133 0.000 Functional diversity log10(Nitrate)
-0.169 0.069 0.014
Functional diversity log10(Phosphate)
0.162 0.074
0.028 Functional diversity Salinity
0.132 0.076 0.080
Functional diversity log10(Chlorophyll)
0.022 0.043 0.603
Functional diversity log10(Population index)
0.021 0.055 0.704
Functional diversity Depth
0.005 0.019 0.779
Functional diversity log10(PAR)
0.021 0.094 0.823
log10(Estimated richness) Temperature (mean)
0.489 0.089 0.000
log10(Estimated richness) Temperature (range)
-0.143 0.033 0.000
log10(Estimated richness) log10(Chlorophyll)
-0.092 0.030 0.002
log10(Estimated richness) log10(Population index)
0.081 0.038 0.036
log10(Estimated richness) log10(PAR)
-0.130 0.064 0.043
log10(Estimated richness) Depth
-0.020 0.014 0.159
log10(Estimated richness) Salinity
0.053 0.051 0.301
log10(Estimated richness) log10(Phosphate)
-0.023 0.052 0.658
log10(Estimated richness) log10(Nitrate)
-0.006 0.047 0.905
log10(Chlorophyll) Temperature (range)
0.348 0.026 0.000
log10(Chlorophyll) log10(Population index)
0.198 0.036 0.000
log10(Chlorophyll) Salinity
-0.292 0.060 0.000
log10(Chlorophyll) Temperature (mean)
-0.367 0.085 0.000
log10(Chlorophyll) Depth
-0.036 0.010
0.001 log10(Chlorophyll) log10(PAR)
0.185 0.059 0.002
log10(Chlorophyll) log10(Phosphate)
0.141 0.046 0.002
log10(Chlorophyll) log10(Nitrate)
0.089 0.041 0.031
log10(Phosphate) Salinity
-0.681 0.049 0.000
log10(Phosphate) Temperature (mean)
-0.853 0.067 0.000
log10(Phosphate) log10(PAR)
-0.290 0.040 0.000
log10(Phosphate) Temperature (range)
-0.036 0.019 0.061
log10(Phosphate) log10(Population index)
-0.035 0.027 0.197
log10(Phosphate) Depth
0.000 0.008 0.992
log10(Nitrate) log10(PAR)
-0.884 0.044 0.000
log10(Nitrate) Temperature (mean)
-0.842 0.075 0.000
log10(Nitrate) Temperature (range)
-0.156 0.021 0.000
log10(Nitrate) Depth
0.030 0.008 0.000
log10(Nitrate) log10(Population index)
-0.086 0.030 0.004
114 115
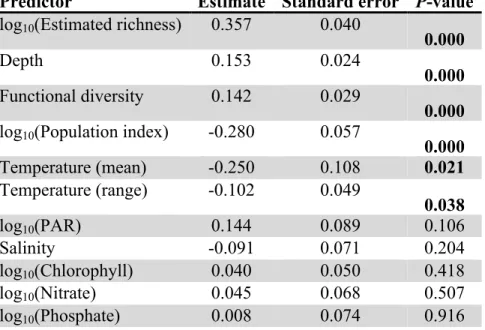
Table S1b: Standardized coefficients (scaled by mean and variance) from the global model 116
predicting fish biomass including only fishes >35 cm in total length.
117
Predictor Estimate Standard error P-value log10(Estimated richness) 0.357 0.040
0.000
Depth 0.153 0.024
0.000 Functional diversity 0.142 0.029
0.000 log10(Population index) -0.280 0.057
0.000
Temperature (mean) -0.250 0.108 0.021
Temperature (range) -0.102 0.049
0.038
log10(PAR) 0.144 0.089 0.106
Salinity -0.091 0.071 0.204
log10(Chlorophyll) 0.040 0.050 0.418
log10(Nitrate) 0.045 0.068 0.507
log10(Phosphate) 0.008 0.074 0.916
118 119
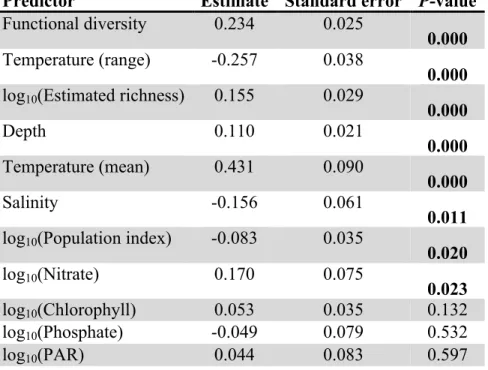
Table S1c: Standardized coefficients (scaled by mean and variance) from the global model 120
predicting fish biomass including only temperate sites.
121
Predictor Estimate Standard error P-value Functional diversity 0.234 0.025
0.000 Temperature (range) -0.257 0.038
0.000 log10(Estimated richness) 0.155 0.029
0.000
Depth 0.110 0.021
0.000 Temperature (mean) 0.431 0.090
0.000
Salinity -0.156 0.061
0.011 log10(Population index) -0.083 0.035
0.020
log10(Nitrate) 0.170 0.075
0.023
log10(Chlorophyll) 0.053 0.035 0.132
log10(Phosphate) -0.049 0.079 0.532
log10(PAR) 0.044 0.083 0.597
122 123
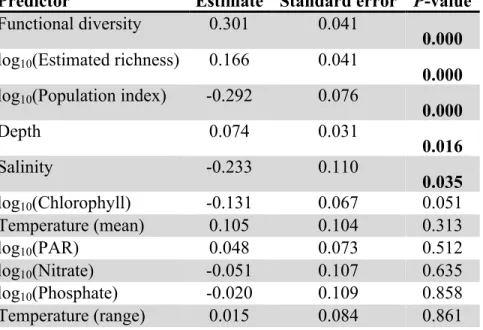
Table S1d: Standardized coefficients (scaled by mean and variance) from the global model 124
predicting fish biomass including only tropical sites.
125
Predictor Estimate Standard error P-value Functional diversity 0.301 0.041
0.000 log10(Estimated richness) 0.166 0.041
0.000 log10(Population index) -0.292 0.076
0.000
Depth 0.074 0.031
0.016
Salinity -0.233 0.110
0.035 log10(Chlorophyll) -0.131 0.067 0.051
Temperature (mean) 0.105 0.104 0.313
log10(PAR) 0.048 0.073 0.512
log10(Nitrate) -0.051 0.107 0.635
log10(Phosphate) -0.020 0.109 0.858
Temperature (range) 0.015 0.084 0.861
126 127
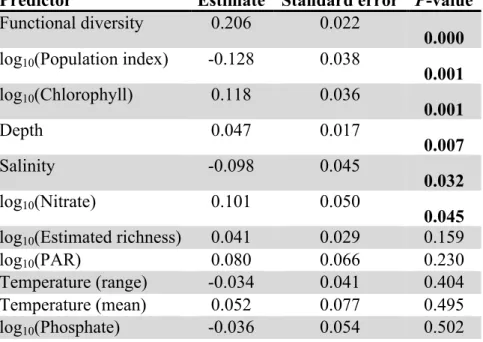
Table S1e: Standardized coefficients (scaled by mean and variance) from the global model 128
predicting fish biomass including only top carnivores.
129
Predictor Estimate Standard error P-value Functional diversity 0.206 0.022
0.000 log10(Population index) -0.128 0.038
0.001 log10(Chlorophyll) 0.118 0.036
0.001
Depth 0.047 0.017
0.007
Salinity -0.098 0.045
0.032
log10(Nitrate) 0.101 0.050
0.045 log10(Estimated richness) 0.041 0.029 0.159
log10(PAR) 0.080 0.066 0.230
Temperature (range) -0.034 0.041 0.404
Temperature (mean) 0.052 0.077 0.495
log10(Phosphate) -0.036 0.054 0.502
130 131
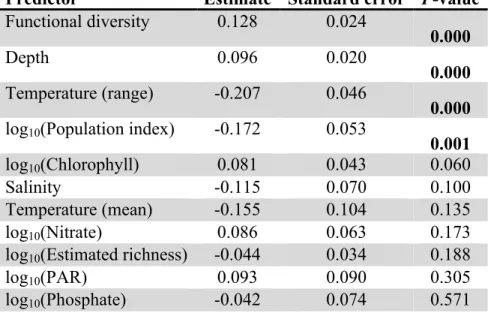
Table S1f: Standardized coefficients (scaled by mean and variance) from the global model 132
predicting fish biomass including only benthic carnivores.
133
Predictor Estimate Standard error P-value Functional diversity 0.128 0.024
0.000
Depth 0.096 0.020
0.000 Temperature (range) -0.207 0.046
0.000 log10(Population index) -0.172 0.053
0.001
log10(Chlorophyll) 0.081 0.043 0.060
Salinity -0.115 0.070 0.100
Temperature (mean) -0.155 0.104 0.135
log10(Nitrate) 0.086 0.063 0.173
log10(Estimated richness) -0.044 0.034 0.188
log10(PAR) 0.093 0.090 0.305
log10(Phosphate) -0.042 0.074 0.571
134 135
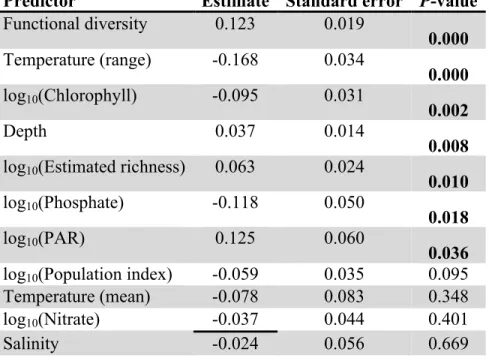
Table S1g: Standardized coefficients (scaled by mean and variance) from the global model 136
predicting fish biomass including only herbivores.
137
Predictor Estimate Standard error P-value Functional diversity 0.123 0.019
0.000 Temperature (range) -0.168 0.034
0.000 log10(Chlorophyll) -0.095 0.031
0.002
Depth 0.037 0.014
0.008 log10(Estimated richness) 0.063 0.024
0.010 log10(Phosphate) -0.118 0.050
0.018
log10(PAR) 0.125 0.060
0.036 log10(Population index) -0.059 0.035 0.095
Temperature (mean) -0.078 0.083 0.348
log10(Nitrate) -0.037 0.044 0.401
Salinity -0.024 0.056 0.669
138 139