Two of the challenges for researchers in measuring political behavior or attitudes are the reluctance of respondents to answer sensitive questions truthfully and the inattention of respondents to give accurate answers. The contribution of my paper is to illustrate when the full strength of the non-liar assumption is most needed to determine the prevalence of sensitive behaviors or attitudes, and to facilitate the analysis of list experiments that are robust to violations of the no-liar assumption.
INTRODUCTION
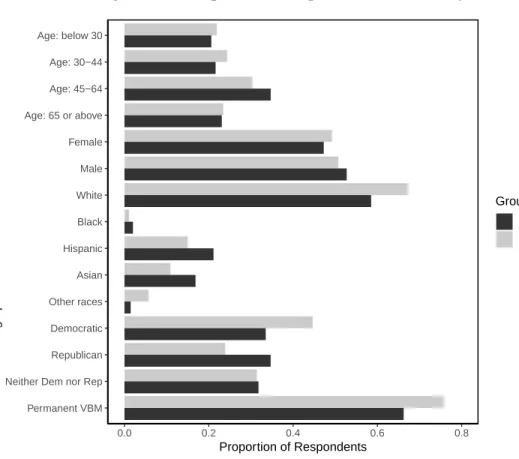
Younger and less educated respondents, in particular, are more likely to fail attention checks. However, many respondents who fail attention checks provide accurate self-reports, implying that removing inattentive respondents as measured by attention checks will increase variance in estimates.
RELAXING THE NO LIARS ASSUMPTION IN LIST EXPERIMENT ANALYSES
Introduction
2 Under the first assumption (no design effect), a respondent's answer is the sum of their latent answers to the control items and the sensitive item. In particular, my simulated list of experiments suggests that positive correlations between the sensitive item and the control items imply narrower boundaries.
Method SetupSetup
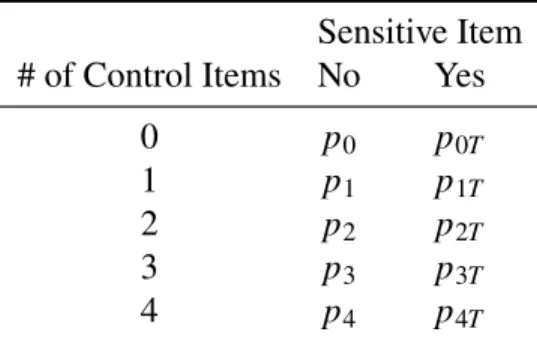
I do not observe a respondent's latent response to the control items or the latent attitude toward the sensitive item (except when the respondent gives a response of 0 or 𝐽). The amount of interest is the population share of respondents who favor the sensitive item,Í𝐽.
Applications Illustrative ExampleIllustrative Example
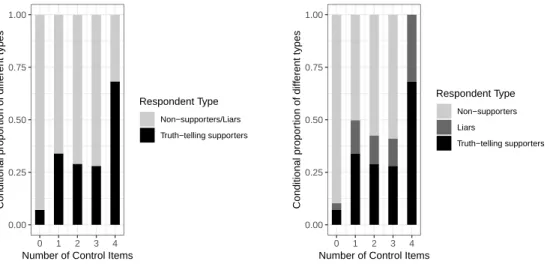
Note: The figure shows, for Organization X (the sensitive topic), the proportions of truth-tellers and non-adherents/liars (left), and the proportions of truth-tellers, liars and non-adherents under the relaxed liar assumption with a maximum number of liars (to right), conditional on the number of controls that are answered affirmatively. As expected, in the case of "no liars", the lower bounds consistently estimate the prevalence of the sensitive topic.
Discussion
By construction, the bounds will be non-trivial if and only if the proportion of truth-telling followers is higher for respondents who answer affirmatively to all 𝐽 controls than 𝑘 < 𝐽 controls for some𝑘. Researchers can check whether respondents who answer affirmatively to all controls are very different in composition from other respondents and make changes to the controls if possible (eg, after a pilot study).
Conclusion
If there is still concern, researchers can apply the method to each demographic group separately (the accuracy of the estimate will be lower). Meanwhile, when the list contains a positive correlation between the sensitive item and the control items in general, researchers can use this opportunity to estimate stable limits to the presence of liars.
PAYING ATTENTION TO INATTENTIVE SURVEY RESPONDENTS
Introduction
In this way, the inclusion of inattentive respondents in surveys can be important because civil non-attitudes are common in the public on any specific issue or topic, and accounting for non-attitudes can be crucial to making accurate inferences about research questions. These types of questions have not been examined in the past in relation to respondent attentiveness, but given the complexity of popular approaches to measuring sensitive behavior, we expect that inattentive respondents will provide much less accurate and consistent information about their sensitive dispositions than those who who carefully consider survey questions.
Survey Satisficing and Attention Checks
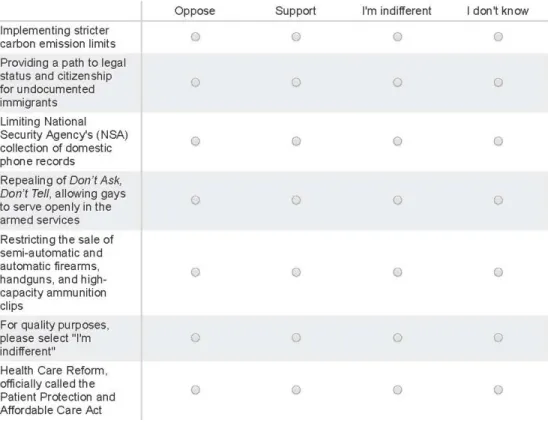
Instructed response items evaluate respondents' compliance with simple and concise instructions and have been used as indicators of attention in several previous studies (L. Craig, 2012 concludes, “we strongly endorse false items – or, preferably, instructed response items (e.g., “Respond with 'strongly agree' for this item”) – for longer survey measures.”.
Data and Methods DataData
The position in the grid in the row containing the instructed response item was randomly determined. The position in the grid of the row containing the instructed response item was fixed at the bottom.
Results
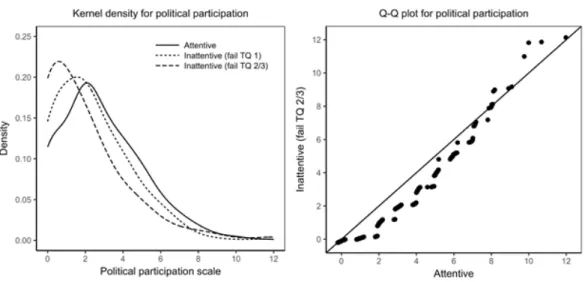
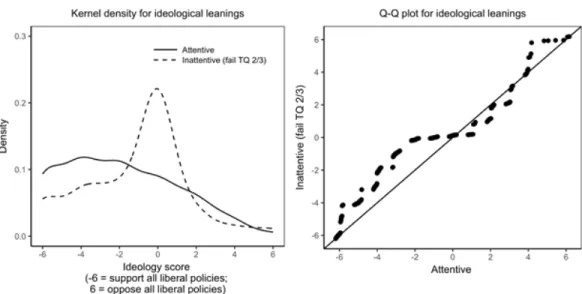
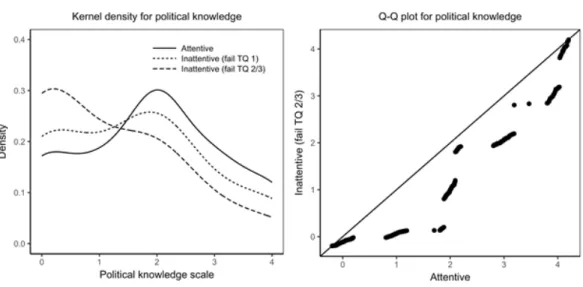
In the case of two questions about majority demands, the inattentive are about as likely to choose “don't know” as the attentive. In the case of knowledge items that ask about the majority party in the state Senate and Assembly, the inattentive are much more likely to say "I don't know." In the figure, the vertical lines show the estimates of the differences in means in our sample, and the curves show the distribution.
Solid and dashed vertical lines show the difference-in-means estimates in the original sample for attentive and inattentives, respectively. Solid and dashed vertical lines show the difference-in-means estimates in the original sample for attentive and inattentives, respectively.
Discussion: Dealing with Inattentiveness
Moreover, polar cases of complete absence or presence of attention are probably rare; Therefore, determining the minimum level of attention necessary to keep respondents in the sample can be far from straightforward. Adjusting study weights to account for unit nonresponse due to inattention would require access to auxiliary variables that predict inclusion in the sample (ie, propensity to provide attentive responses), information that may not always be observable or available to practitioners ( Bailey, 2017). In the absence of systematic error in the measurement of attention, this model-based approach could be used to learn about the relationship between inattention and expected values of the outcome variable.
For example, in the case of the survey analyzed in this article, the polling firm recommended the use of attention filters and did not charge for incomplete responses from respondents who failed the trap questions. If researchers want to ensure a minimum number of attentive responses and the cost per response is not adjusted for attention, retaining inattentive respondents in the sample may further increase the overall cost.
Conclusion
What constitutes a reasonable response time can be determined by the researcher during the pilot testing of the online questionnaire or during the soft launch of the survey, by looking at the relationship between total time spent completing the questionnaire and attention measured on ground of the ability to pass trap questions. In implementing this recommendation, researchers should be sure to ask the polling firm to record all responses, including those given by respondents who complete the survey in less than the designated minimum time. Next, summary information about respondent attentiveness can be incorporated into analyzes of attitudes and behaviors reported by the entire sample of respondents, using statistical techniques appropriate to the data and research question at hand.
On the other hand, preventing inattentives from completing a survey can reduce noise and lower the cost of survey administration, but this can further complicate the analysis of these samples, as they may require reweighting or other types of statistical adjustments to allow for population-level inference. Attention may also be learned by examining survey metadata and response patterns, including the time it takes respondents to answer specific questions or review the entire questionnaire, and by examining the frequency of offset and propensity to report that no-attitude or unreasonable responses.
SURVEY ATTENTION AND SELF-REPORTED POLITICAL BEHAVIOR
- Introduction
- Theory and Past Research
- Survey and Attention Checks
- Results
- Discussion and Conclusion
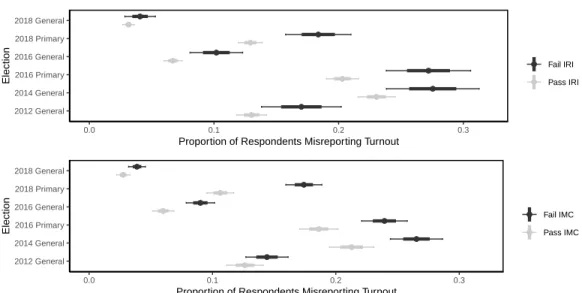
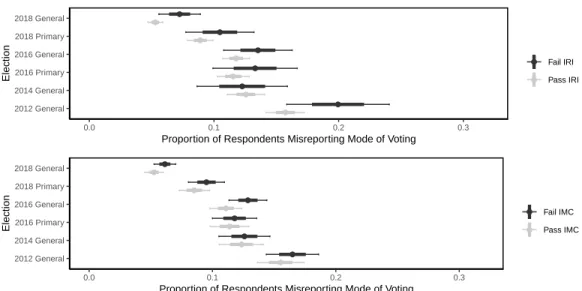
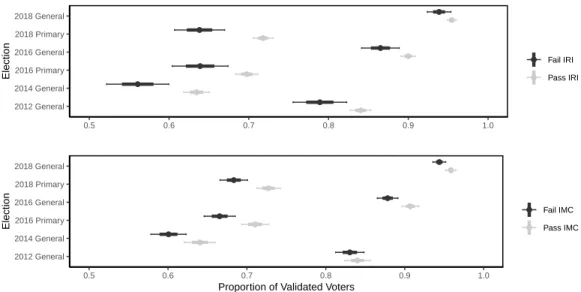
These results indicate that the inclusion of inattentive respondents as measured by these attention checks will lead to bias in the estimation of turnout. This observation implies that dropping inattentive respondents as measured by these attention checks will increase the variance in the turnout estimate. This pattern suggests that dropping inattentive respondents will lead to less precise estimates of voting mode.
This result indicates that removing nonattentive respondents will not introduce bias that comes from a non-representative sample in terms of voting pattern. As a result, removing nonattentive respondents does not reduce the bias in the participation estimates (left panel).
BIBLIOGRAPHY
Using screeners to measure respondents' attention to self-administered surveys: which items and how many?” In: Political Science Research and Methods9.2, pp. Do Attempts to Improve Respondent Attention Increase Social Desirability Bias?” In: Public Opinion Quarterly 79.3, p. Can registration-based sampling improve the accuracy of midterm election predictions?” In: Public Opinion Quarterly 70.2, pp.
APPENDIX TO CHAPTER II
Note: The figure shows the proportion of truth tellers with sensitive behavior/attitude conditional on the number of control items answered affirmatively for list experiments with affirmative sensitive response (upper panel: 𝐽 = 3, lower panel: 𝐽 =4). Note: The figure shows the proportion of truth tellers with sensitive behavior/attitude conditional on the number of control items answered negatively for list experiments with negative sensitive response (upper panel: 𝐽 =3, lower panel: 𝐽 =4). Note: The figure presents the densities of lower bound and upper bound estimates for 2000 simulated data sets for each of the 9 types of list experiments.
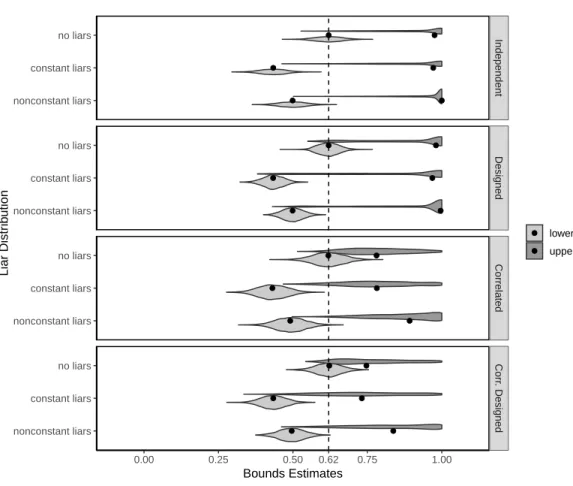
Note: The figure shows the densities of lower bound and upper bound estimates for 2000 simulated data sets for each of the 12 types of list experiments. For list experiments with negative sensitive responses, truth telling is fully revealing about the sensitive topic for respondents whose responses are negative to all controls (floor effects).
APPENDIX TO CHAPTER III
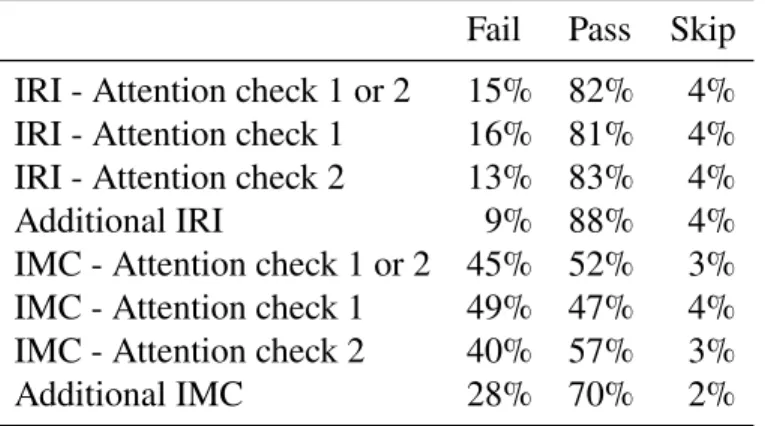
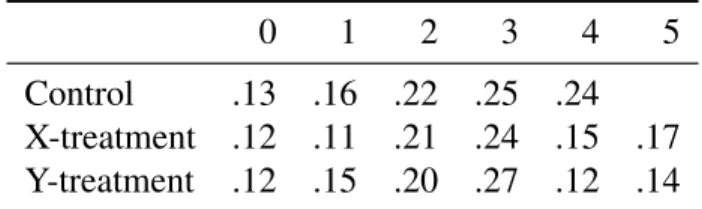
Note: The table shows the number and percentage of respondents who passed and failed trap questions (TQs). The differences between attentive and inattentive in terms of mean responses and estimates of differences in means are also calculated. The bottom section (“List B - List A”) shows the differences across lists in terms of estimates of differences in means for the attentive and inattentive, respectively.
The last column shows the difference in the mean responses under control and under treatment for respondents who passed and failed the screening question. The differences between the respondents who passed and failed the screening question in terms of average answers and estimates of the difference in means are also calculated and reported in the bottom row.
APPENDIX TO CHAPTER IV
Main IRI: Do you support or oppose any of the following proposals for new ways of voting or conducting elections. For each of the following statements, respondents can select Strongly support, Somewhat support, Neither support nor oppose, Somewhat oppose, Strongly oppose]. If the respondent chose one of the last three answer options in turnout question 1, they receive the following two questions.].
If the respondent chose one of the first three answer options for Attendance question 1, he will be asked the next question.]. For each of the following statements, respondents can select Voted Personally, Voted by Mail or Vote Absent by Mail, or I don't know.