A COMPREHENSIVE COLLECTION OF ACCOUNTING METHODS AND PRINCIPLES: A CASE BY CASE ANALYSIS
By
Lucas Buckley Thudium (Buck)
A thesis submitted to the faculty of The University of Mississippi in partial fulfillment of the requirements of the Sally McDonnell Barksdale Honors College.
Oxford May 2018
Approved By
Advisor: Dr. Victoria Dickinson
Reader: Dr. W. Mark Wilder
ii
© 2018
Lucas Buckley Thudium ALL RIGHTS RESERVERD
iii
ACKNOWLEDGEMENTS
I would like to give thanks to my family for supporting me through my endeavors and always encouraging me to accomplish my goals. I’d like to also give thanks to Dr. Dickinson, who has been an incredible source of advice for this thesis composition and for my professional career.
To all of my other professors I have encountered along my undergraduate education, thank you for the memorable experiences and helping me get to where I am now.
iv ABSTRACT
LUCAS BUCKLEY THUDIUM: A Comprehensive Collection of Accounting Methods and Principles: A Case by Case Analysis
The purpose of this thesis is to address the most commonly accepted accounting methods and principles used in practice and apply them to companies’ financial statements. This thesis uses examples from companies’ financial statements, management discussion and analysis, 10k reports, quarterly reports, and various other statements in conjunction with a particular topic of financial accounting. This thesis begins by applying accounting principles to specific companies.
Certain topics include revenue recognition, the time value of money, tradeable securities, pension plans, and various other topics. Each topic is broken down by a section. Inside these sections will be supporting data, journal entries, and calculations. The format of this thesis is broken down on a case by case application to these specific accounting topics.
v
TABLE OF CONTENTS
LIST O TABLES………...vi
PROFITABILITY ANALYSIS………..1
INCOME STATEMENT PRESENTATION………....11
STATEMENT OF CASH FLOWS………...15
FRAUD DETECTION AND INTERNAL CONTROLS………..22
INVENTORY VALUATION………....26
WORLDCOM SCANDAL: FINANCIAL STATEMENT ANALYSIS………...31
LONG-TERM LIABILITIES………....36
STOCKHOLDERS EQUITY AND TREASURY STOCK………..42
EMPLOYEE BENEFIT PLANS, STOCK OPTIONS, AND RSU’s………....46
REVENUE RECOGNITION……….51
DEFERRED INCOME TAXES………56
LEASE AGREEMENTS………...61
vi
LIST OF TABLES
PROFITABILITY ANALYSIS 1
FIGURE 1-1: CURRENT RATIO FORMULA 3
FIGURE 1-2: GLENWOOD HEATING BALANCE SHEET 4
FIGURE 1-3: GLENWOOD HEATING CASH FLOW 5
FIGURE 1-4: GLENWOOD HEATING INCOME STATEMENT 6
FIGURE 1-5: GLENWOOD HEATING RETAINED EARNINGS STATEMENT 6
FIGURE 1-6: EADS HEATING BALANCE SHEET 7
FIGURE 1-7: EADS HEATING CASH FLOW 8
FIGURE 1-8: EADS HEATING INCOME STATEMENT 9
FIGURE 1-9: EADS HEATING RETAINED EARNINGS STATEMENT 9
STATEMENT OF CASH FLOWS 15
FIGURE 3-1: ROCKY MOUNTAIN’S GENERAL LEDGER 17
FIGURE 3-2: ROCKY MOUNTAIN’S ADJUSTING AND CLOSING ENTRIES 18
FIGURE 3-3: ROCKY MOUNTAIN’S YEAR-END INCOME STATEMENT 19
FIGURE 3-4: ROCKY MOUNTAIN’S YEAR-END BALANCE SHEET 20
FRAUD DETENTION AND INTERNAL CONTROLS APPLICATION 22
FIGURE 4-1: FRAUD SCENARIOS AND INTERNAL CONTROLS 24
FIGURE 4-1: FRAUD SCENARIOS AND INTERNAL CONTROLS 25
INVENTORY VALUATION 26
FIGURE 5-1: PROVISIONS FOR ALLOWANCE OF OBSOLETE INVENTORY 28
FIGURE 5-2: RECORD THE WRITE OFF/DISPOSAL OF ASSETS 28
FIGURE 5-3: CHARTS OF ACCOUNTS 29
FIGURE 5-4: INVENTORY TURNOVER RATIOS CALCULATIONS 29
FIGURE 5-5: INVENTORY HOLDING PERIODS CALCULATIONS 30
FIGURE 5-6: PERCENTAGE OF OBSOLETE GOODS CALCULATION 30
WORLDCOM SCANDAL FINANCIAL STATEMENT ANALYSIS 31
FIGURE 6-1: OPERATING EXPENSE JOURNAL ENTRY 33
FIGURE 6-2: RECLASSIFICATION OF IMPROPER ASSETS CLASSIFICATION 33
FIGURE 6-3: QUARTERLY DEPRECIATION EXPENSE CALCULATIONS 34
FIGURE 6-5: CORRECTING NET INCOME CALCULATION 34
vii
LONG-TERM LIABILITIES 36
FIGURE 7-1: CAPITALIZATION OF ASSETS AND EXPENSES DIAGRAM 40
STOCKHOLDER’S EQUITY AND TRESURY STOCK 42
FIGURE 8-1: RECORDING THE PAYMENT OF DIVIDENDS 44
FIGURE 8-2: RETAINED EARNINGS DISTRIBUTIONS FOR 2006 & 2007 45
EMPLOYEE BENEFIT PLANS, STOCK OPTIONS, & RSU’s 46
FIGURE 9-1: DEFINED SUPPORTING TERMINOLOGY 48
FIGURE 9-2: STOCK BASED COMPENSATION JOURNAL ENTRY 49
REVENUE RECOGNITION 51
FIGURE 10-1: RECORDING REVENUE 52
FIGURE 10-2: ALLOCATION OF REVENUE 53
FIGURE 10-3: SALES DISCOUNTS 54
FIGURE 10-4: DEFERRED REVENUE 55
DEFERRED INCOME TAXES 56
FIGURE 11-1: SUPPORTING TERMINOLOGY AND EXAMPLES 57
FIGURE 11-2: 2012 INCOME TAX PROVISION 59
FIGURE 11-3 NET DEFERRED INCOME TAX EXPENSE 59
FIGURE 11-4: RECONCILIATION OF ZAGG’S EFFECTIVE TAX RATE 60
LEASE AGREEMENTS 61
FIGURE 12-1: TYPES OF LEASE AGREEMENTS 62
FIGURE 12-2: RECORDING LEASE PAYMENT 64
FIGURE 12-3: DEFERRED RENT 64
FIGURE 12-4: PRESENT VALUE OF FUTURE PAYMENTS TABLE 65
FIGURE 12-5: RECORDING A CAPITAL LEASE 65
FIGURE 12-6: RECORDING LEASE PAYMENT AND DEPRECIATION 65
FIGURE 12-7: CURRENT RATIOS AND DEBT-TO-EQUITY RATIOS 66
CASE STUDY ONE: PROFITABILITY ANALYSIS Home Heaters Company Comparison
Case Introduction
This case report analyzes two home heating company’s financial performance during their first year of operations for the year 20X1. These two companies that will be compared and analyzed in this report will be Glenwood Heating Inc. and Eads Heating Inc. Both of these companies operated under similar economic conditions and have identical operations during the year. Based on the results in this case report, Glenwood Heating Inc. proved to be the more impressive company for attracting more investors and creditors over Eads Heating Inc.
Executive Summary
As stated previously, Glenwood Inc. proved to be the more profitable and attractive company for several reasons. First, Glenwood’s net income for the year was recorded at $92,742.
Net income is a key component to revealing the success of a company and is something investors and creditors are interested in knowing out front. Eads Heating Inc. reported net income at
$70,515 for the year. The substantial difference between these two companies’ year-end profits can best be best understood by analyzing each companies’ liquidity, solvency, and profitability.
This report will show Glenwood’s overall higher net income is a result of applying more efficient accounting choices, which leads to having better liquidity, solvency, and profitability over the course of the year. Glenwood maintains fewer finical obligations than Eads does during this year. The result appears to contribute the greatest difference between the performances of each company. Glenwood is able to give out the same amount of dividends while maintaining higher retained earnings as compared to Eads. Now that argument has been made that Glenwood Heating is the more profitable and attractive company over Eads Heating, the rest of this report will reinforce this claim through the use of finical statements, transactions, and reports.
Show below is Glenwood’s balance sheet reflecting the results of the transactions that occurred for the year. From this balance sheet an investor or creditor can use this information to make informed decisions on whether to invest or not. A simple formula may be applied here to estimate the company’s liquidity easily by finding the current ratio. A higher the current ratio indicates a stronger safety cushion for a company. Glenwood has greater flexibility over Eads to cover their short-term liabilities with their short-term assets in the event capital was needed to pay off debt.
Figure 1-1: Current Ratio Formula
Current ratio=Current Assets/Current Liabilities Glenwood: $161,632/$33,090 = 4.88
Eads: $153,265/33,090 = 4.57
Assets
Dr. Cr.Current Assets:
Cash 426.00
Accounts Receivable 99,400.00
Allowance for Bad Debts (994.00)
Inventory 62,800.00
Non-Current Assets
Builiding 350,000.00
Land 70,000.00
Equipment 80,000.00
Less: Acc. Dep - Equip (9,000.00)
Less: Acc. Dep - Building (10,000.00)
Total Assets 642,632.00
Liabilities
Current Liabilities
Accounts Payable 26,440.00
Inerest Payable 6,650.00
Long-Term Liabilities
Notes Payable 380,000.00
Equity
Common Stock 160,000.00
Dividends 23,200.00
Sales 398,500.00
CGS 177,000.00
Bad Debt Expense 994.00
Dep Expense 19,000.00
Interest Expense 27,650.00 Other Operating Expenses 34,200.00
Rent Expense 16,000.00
Income Tax 30,914.00
328,958.00
971,590.00
Total Liabilities & Equity
642,632.00 Glenwood Heating Inc.FYE 20X2 Balance Sheet
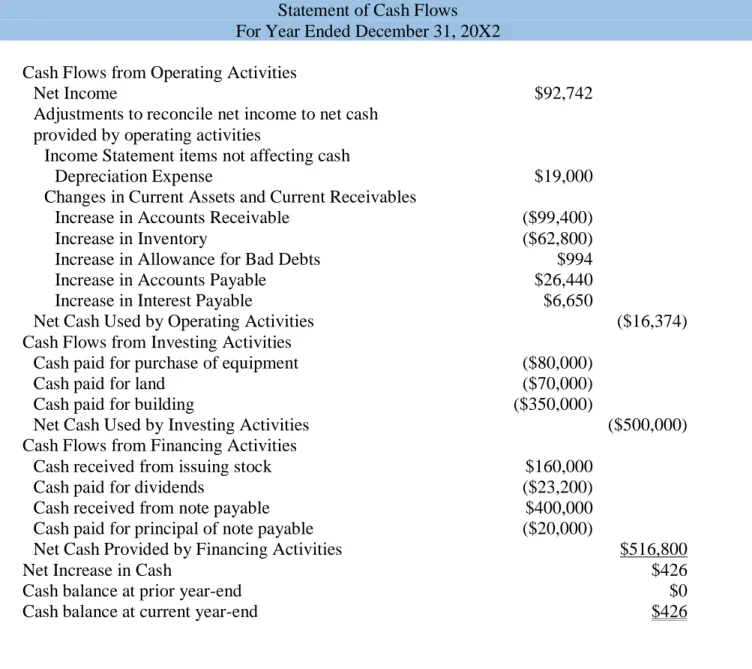
Figure 1-3: Glenwood Heating Cash Flow
Glenwood Heating, Inc.
Statement of Cash Flows For Year Ended December 31, 20X2 Cash Flows from Operating Activities
Net Income $92,742
Adjustments to reconcile net income to net cash provided by operating activities
Income Statement items not affecting cash
Depreciation Expense $19,000
Changes in Current Assets and Current Receivables
Increase in Accounts Receivable ($99,400)
Increase in Inventory ($62,800)
Increase in Allowance for Bad Debts $994
Increase in Accounts Payable $26,440
Increase in Interest Payable $6,650
Net Cash Used by Operating Activities ($16,374)
Cash Flows from Investing Activities
Cash paid for purchase of equipment ($80,000)
Cash paid for land ($70,000)
Cash paid for building ($350,000)
Net Cash Used by Investing Activities ($500,000)
Cash Flows from Financing Activities
Cash received from issuing stock $160,000
Cash paid for dividends ($23,200)
Cash received from note payable $400,000
Cash paid for principal of note payable ($20,000)
Net Cash Provided by Financing Activities $516,800
Net Increase in Cash $426
Cash balance at prior year-end $0
Cash balance at current year-end $426
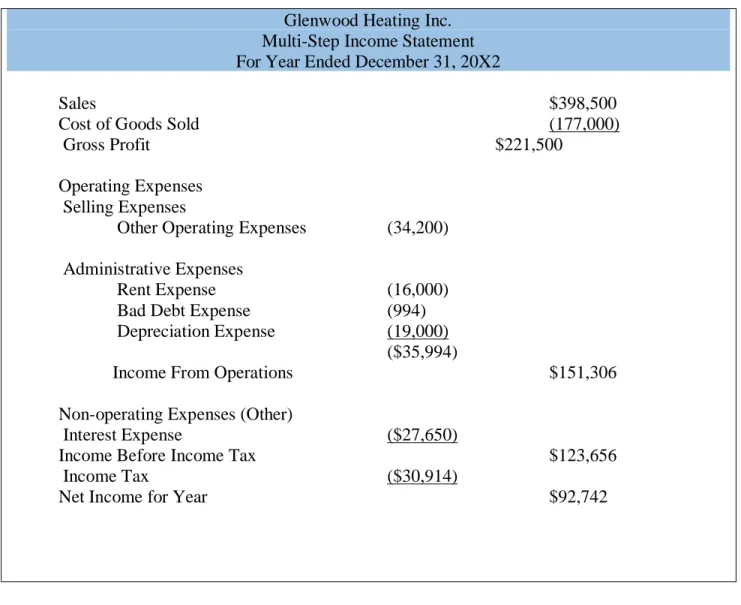
Figure 1-4: Glenwood Heating Income Statement
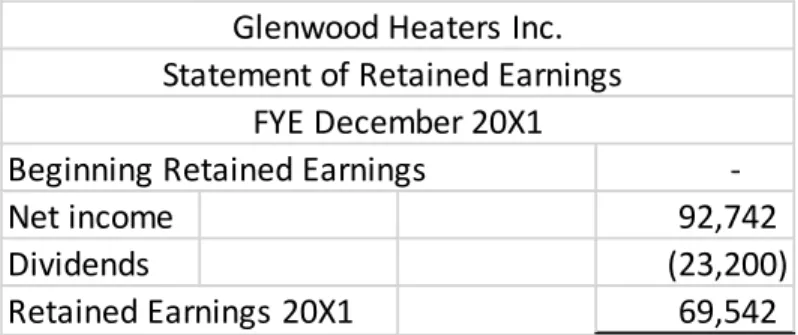
Figure 1-5: Glenwood Heating Retained Earnings Statement
Beginning Retained Earnings -
Net income 92,742
Dividends (23,200)
Retained Earnings 20X1 69,542 Glenwood Heaters Inc.
Statement of Retained Earnings FYE December 20X1 Glenwood Heating Inc.
Multi-Step Income Statement For Year Ended December 31, 20X2
Sales $398,500
Cost of Goods Sold (177,000)
Gross Profit $221,500
Operating Expenses Selling Expenses
Other Operating Expenses (34,200) Administrative Expenses
Rent Expense (16,000)
Bad Debt Expense (994)
Depreciation Expense (19,000)
($35,994)
Income From Operations $151,306
Non-operating Expenses (Other)
Interest Expense ($27,650)
Income Before Income Tax $123,656
Income Tax ($30,914)
Net Income for Year $92,742
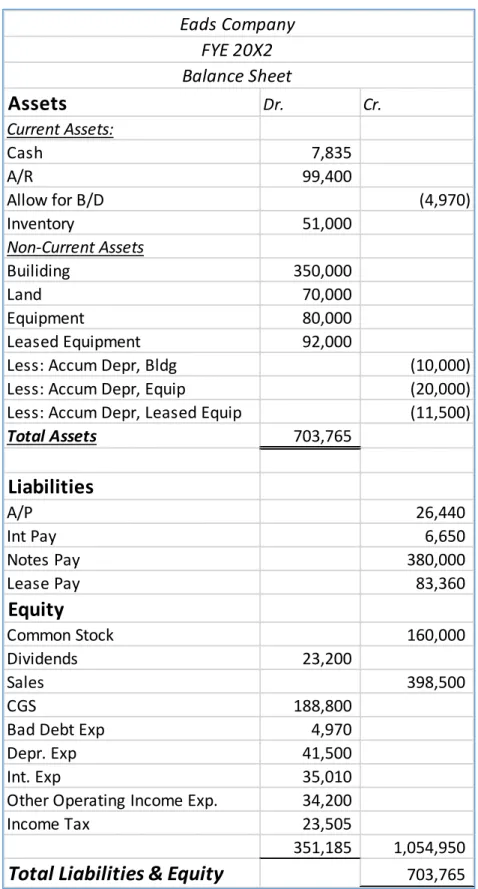
Figure 1-6: Eads Heating Balance Sheet
Assets
Dr. Cr.Current Assets:
Cash 7,835
A/R 99,400
Allow for B/D (4,970)
Inventory 51,000
Non-Current Assets
Builiding 350,000
Land 70,000
Equipment 80,000
Leased Equipment 92,000
Less: Accum Depr, Bldg (10,000) Less: Accum Depr, Equip (20,000) Less: Accum Depr, Leased Equip (11,500)
Total Assets 703,765
Liabilities
A/P 26,440
Int Pay 6,650
Notes Pay 380,000
Lease Pay 83,360
Equity
Common Stock 160,000
Dividends 23,200
Sales 398,500
CGS 188,800
Bad Debt Exp 4,970
Depr. Exp 41,500
Int. Exp 35,010
Other Operating Income Exp. 34,200
Income Tax 23,505
351,185
1,054,950
Total Liabilities & Equity
703,765 Eads CompanyFYE 20X2 Balance Sheet
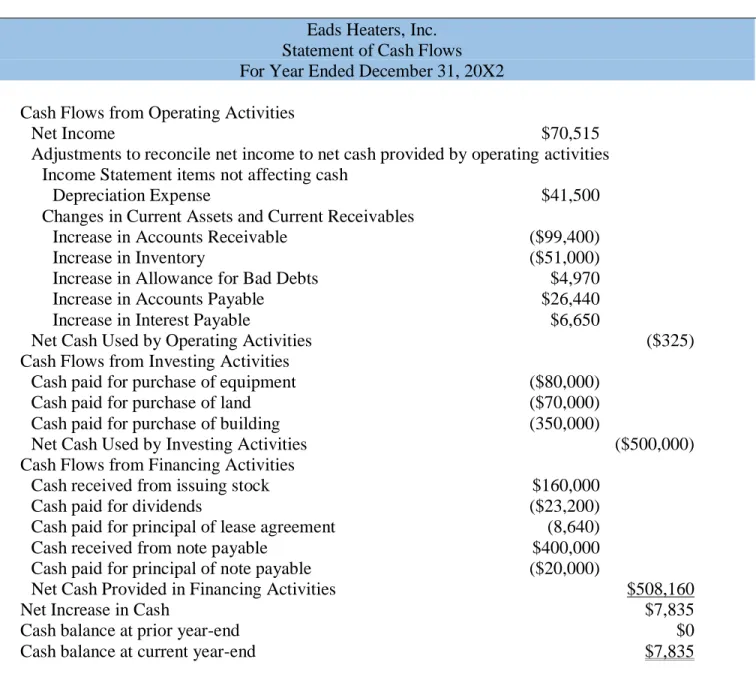
Figure 1-7: Eads Heating Cash Flow
Eads Heaters, Inc.
Statement of Cash Flows For Year Ended December 31, 20X2 Cash Flows from Operating Activities
Net Income $70,515
Adjustments to reconcile net income to net cash provided by operating activities Income Statement items not affecting cash
Depreciation Expense $41,500
Changes in Current Assets and Current Receivables
Increase in Accounts Receivable ($99,400)
Increase in Inventory ($51,000)
Increase in Allowance for Bad Debts $4,970
Increase in Accounts Payable $26,440
Increase in Interest Payable $6,650
Net Cash Used by Operating Activities ($325)
Cash Flows from Investing Activities
Cash paid for purchase of equipment ($80,000)
Cash paid for purchase of land ($70,000)
Cash paid for purchase of building (350,000)
Net Cash Used by Investing Activities ($500,000)
Cash Flows from Financing Activities
Cash received from issuing stock $160,000
Cash paid for dividends ($23,200)
Cash paid for principal of lease agreement (8,640)
Cash received from note payable $400,000
Cash paid for principal of note payable ($20,000)
Net Cash Provided in Financing Activities $508,160
Net Increase in Cash $7,835
Cash balance at prior year-end $0
Cash balance at current year-end $7,835
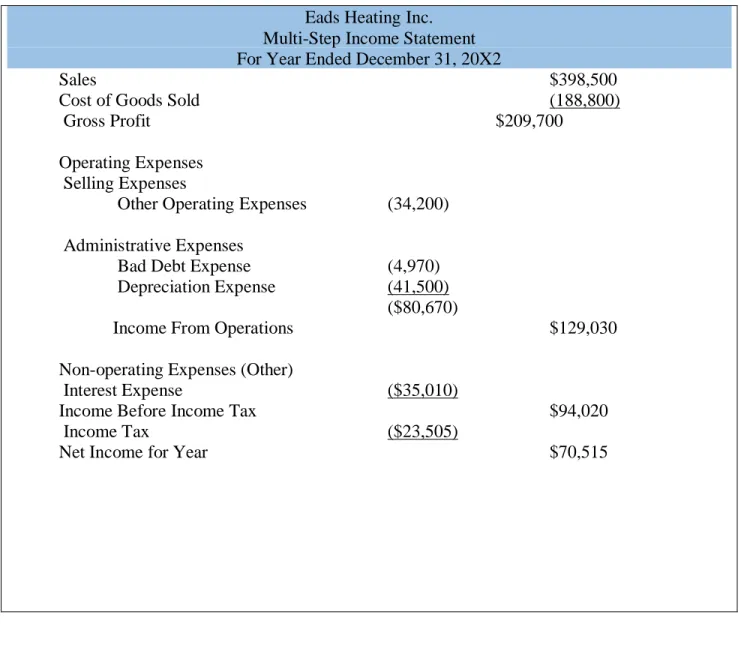
Figure 1-8: Eads Heating Income Statement Eads Heating Inc.
Multi-Step Income Statement For Year Ended December 31, 20X2
Sales $398,500
Cost of Goods Sold (188,800)
Gross Profit $209,700
Operating Expenses Selling Expenses
Other Operating Expenses (34,200) Administrative Expenses
Bad Debt Expense (4,970)
Depreciation Expense (41,500)
($80,670)
Income From Operations $129,030
Non-operating Expenses (Other)
Interest Expense ($35,010)
Income Before Income Tax $94,020
Income Tax ($23,505)
Net Income for Year $70,515
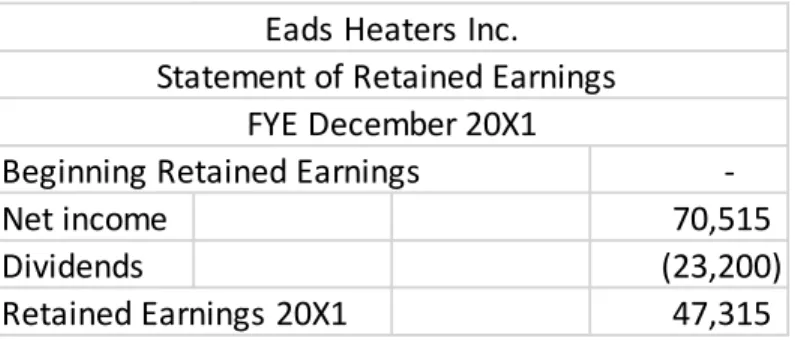
Figure 1-9: Eads Heating Retained Earnings Statement
Beginning Retained Earnings -
Net income 70,515
Dividends (23,200)
Retained Earnings 20X1 47,315 Eads Heaters Inc.
Statement of Retained Earnings FYE December 20X1
Solvency Report
It is important to present the companies balance sheets with their transactions to show exactly where figures come from. This is useful not only for the investors interested in seeing how the company’s management operates but also it is valuable for auditors who are making sure no errors have occurred.
Another important measure of a company’s success can be shown through its Solvency.
Solvency is important to understand on the company side for internal knowledge and it is also something that external investors and creditors can use to their benefit as well. Solvency indicates a company’s debt relative to its assets and equity. In other words it states how much finical obligations the company has compared to how flexible it may be with managing their long-term growth.
Solvency Ratios:
Debt-to-Assets: Total Liabilities/ Total Assets Glenwood Heating Inc.: $413,090/$642,632= 0.64 or 64%
Eads Heating Inc.: $496,450/$703,765= 0.71 or 71%
Eads Heating Inc. is financing more of its company assets through debt than equity. This is less attractive to have as compared to Glenwood Heating Inc.
Debt-to-equity: Total Liabilities / Total Equity Glenwood Heating Inc.: $413,090/ $229,542= 1.80
Eads Heating Inc.: $496,450/$207,315= 2.40 Conclusion:
This ratio reinforces the case that Glenwood is at less risk to pay back their debts in the event that they needed to pay off their debts in a short time period.
CASE TWO: INCOME STATEMENT PRESENTATION Totz Manufacturing Company
Case Introduction:
This case is written in the voice on an auditor corresponding with a client. The point of view is in the form of written letters to Totz. Manufacturing Company. This report details the correct accounting procedures for which the inquiring business entity, Totz. Manufacturing Company must follow while reporting their fiscal year-ending income statement. The SEC registrant company has requested authoritative guidance on how to properly present financial information for their year-end net sales, gross profit, and gain on sale of corporate headquarters, and class action settlement. The manufacturing company produces and sells high quality and stylish children’s clothing. One of the stores through which Totz Manufacturing Co. sells their products is through Doodlez Company, an in-store art studio that provides services and also sells Totz Co. merchandise. The following information will explain how to properly report Totz Co.
financial data through the correct procedure outlined in the FASB Accounting Standards Codification.
Auditors Letter:
To whom this may concern at Totz Manufacturing Company:
Thank you for contacting me to review your company’s financial information and to assist you in the preparation of your income statement. The following information will provide guidelines for how to prepare your financial report with references that I have found in the FASB Accounting Standards Codification. Please use this information to correctly prepare your income statement for the fiscal year ending January 30, 2016.
With regards to your sales presentation for the fiscal year of 2016 we have chosen to comply with FASB Codification regulation S-X Rule 5-03, Income Statement S99-2b. The SEC codification, which states:
“if income is derived from more than one of the subcaptions described under § 210.5–03.1, each class which is not more than 10 percent of the sum of the items may be combined with another class. If these items are combined, related costs and expenses as described under § 210.5–03.1 shall be combined in the same manner.”
Due to this regulation, the reporting entity is obligated to separate their two sources of net sales on their income statement to show that $74.5 million of net sales for Totz Manufacturing Co. was generated through product sales and the other remaining net sales of $11.2 million was derived through the services provided from Doodlez Co. totaling year-ending net sales of $86.5 million for 2016. Please make these corrections.
Letter to Totz Manufacturing Company:
In response to reporting your company’s gross profit for the year-ending 2016, Totz Co.
must comply with the same code stated previously above. SEC Code § 210.5–03.2 which states that cost of tangible goods sold and cost of services must be kept separately on your income statement. It appears that you have included Doodlez Co. cost of services in your gross profit calculations. In compliance with this SEC code, you are obligated to keep your expenses with Doodlez Co. separate when reporting the company’s gross profit. Please make these changes when you prepare your income statement.
In regards on the sale of your company’s previous corporate headquarters, while I was reviewing your financial information on the gain on the sale, we have found that you must comply with the FASB Codification Standards Update ASU 225-20-65-1(d) Section 45-4 which states the following:
“Certain gains and losses shall not be reported as extraordinary items because they are usual in nature or may be expected to recur as a consequence of customary and
continuing business activities. Examples include all of the following…”
Part “d” of this Update outlines the following:
d. “Other gains or losses from sale or abandonment of property, plant, or equipment used in the business”
In accordance with the Codification, you are to report this gain of $1.7 million as a separate item to non-operating income instead of your previous report as a gain on sale of corporate
headquarters.
The final part of this authoritative analysis comes with regards to your class action lawsuit settlement. As we have reviewed your settlement on the class action lawsuit netting the company $2.7 million, we have determined that the outcome of this event may be an unusual and infrequent occurrence in nature and as a result we are going to recognize this financial gain as an extraordinary item. Due to this manner, in compliance with FASB Code ASU 225-20-45 we recognize this class action lawsuit as unusual and infrequent, therefore we must also comply with SEC § 210.4–01 which states that you must recognize this gain as a separate item under
extraordinary items on you income statement.
I would like to thank you again for inquiring our services and I hope that this information will be taken into consideration while reporting your company’s financial information to avoid any future problems that you may incur.
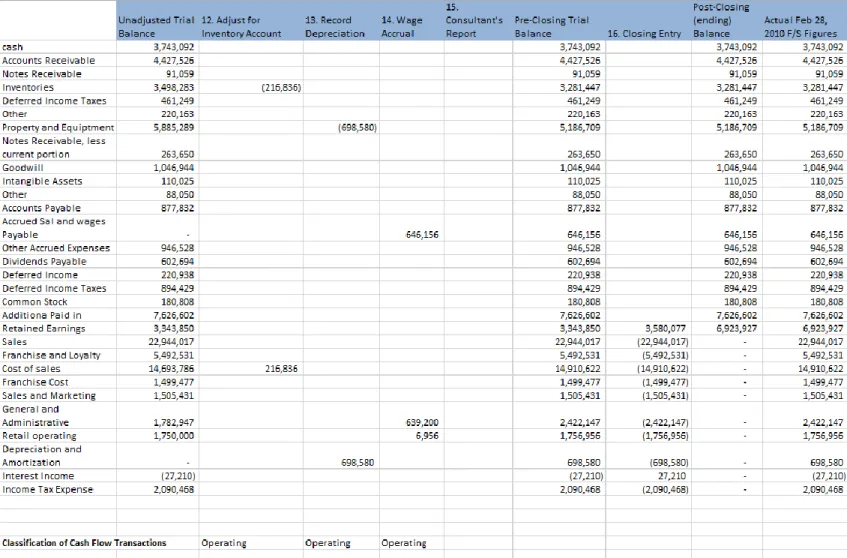
CASE THREE: STATEMENT OF CASH FLOWS Rocky Mountain Chocolate Manufacturing, Inc.
Case Introduction:
This case study relates to a company that is preparing fiscal year-end financial
statements. All of the figures presented in this case were created in excel given company data.
The objective of this case study is to properly classify operating, investing, and financing activities of this company given the information provided by the company’s operations for the year. In order to present this information various financial statements were created to reflect Rocky Mountain’s year-end process for adjusting, closing, trial balancing, balancing, and finalizing financial statements.
Figure 3-2: Rocky Mountain’s Adjusting and Closing Entries
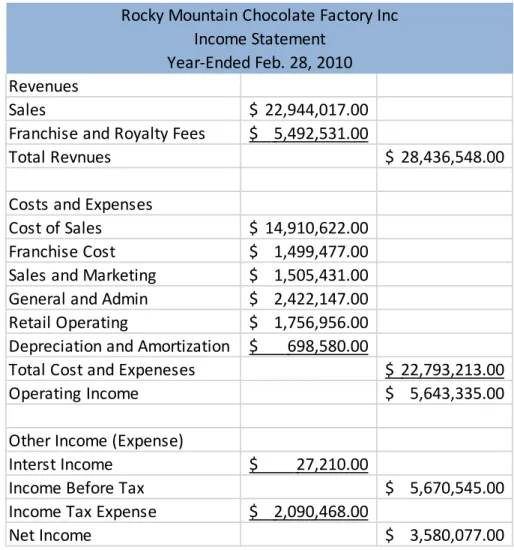
Figure 3-3: Rocky Mountain’s Year-End Income Statement
Revenues
Sales $ 22,944,017.00
Franchise and Royalty Fees $ 5,492,531.00
Total Revnues $ 28,436,548.00
Costs and Expenses
Cost of Sales $ 14,910,622.00
Franchise Cost $ 1,499,477.00 Sales and Marketing $ 1,505,431.00 General and Admin $ 2,422,147.00 Retail Operating $ 1,756,956.00 Depreciation and Amortization $ 698,580.00
Total Cost and Expeneses $ 22,793,213.00
Operating Income $ 5,643,335.00
Other Income (Expense)
Interst Income $ 27,210.00
Income Before Tax $ 5,670,545.00
Income Tax Expense $ 2,090,468.00
Net Income $ 3,580,077.00
Rocky Mountain Chocolate Factory Inc Income Statement
Year-Ended Feb. 28, 2010
Assets
Current Assests
Cash 3,743,092.00
Accounts Receivable 4,427,526.00 Notes Receivable 91,059.00
Inventoires 3,281,447.00
Deffered Income Tax 461,249.00
Other 220,163.00
Totatl Current Assets 12,224,536.00 Property Plant Equiptment $ 5,186,709.00 Other Assets
Notes Receivable, Less
current portion 263,650.00
Goodwill 1,046,944.00
Intangible Assets 110,025.00
Other 88,050.00
Total Other Assets 1,508,669.00
Total Assets $ 18,919,914.00
Liabilities and Stockholder's Equity Current Liabilities
Accounts Payable 877,832.00 Accrued Salaries and Wages 646,156.00 Other Accrued Expenses 946,528.00 Dividends Payable 602,694.00 Deffered Income 220,938.00 Total Current Liabilities 3,294,148.00
Deffered Income Tax $ 894,429.00
Stockholder's Equity
Common Stock 180,808.00 Additional Paid-in Capital 7,626,602.00 Retained Earnings 6,923,927.00 Total Stockholder's Equity 14,731,337.00 Total Liabilities and
Stockholder's Equity $ 18,919,914.00 Rocky Mountain Chocolate Factory Inc
Balance Sheet As of Feb 28, 2010
Conclusion:
The present financials above were created from the information provided by the Rocky Mountain Chocolate Factory, Inc. 2010 case study. The process shows the transitions through the year-ending 2010. All temporary accounts were closed at the year-end. After the entries were closed a trial balance was created and then the income statement and balance sheet were drafted in excel.
CASE FOUR: FRAUD DETENTION AND INTERNAL CONTROLS APPLICATION Scenarios of Potential Fraud
Case Introduction:
This case presents multiple scenarios for which potential fraud can occur within a company. The objective of this case is to point of where fraudulent activity may occur within a company and to explain how to implement strong internal controls to prevent or detent unethical activity within a company. The below table presents all of the scenarios, listed the fraudulent activity, and lists types of controls to be implemented.
Potential Fraud Internal Control
Potential fraud in management Lack of responsibility
Lack of accountability
Separation of Duties: There needs to be some implementation of tasks that change hands on a regular basis to ensure
consistent work with no signs of fraud. In general, clerks should have more
responsibilities to even out the work load.
Lack of monitoring the store Out of date software
Technology Update: Kayla needs to update her accounting software due to updates that would help stop any fraud. Also, Kayla should install cameras to help observe operations at all times. (Their credit card machines are behind the register leaving the registers vulnerable)
Lack of reporting
Lack of distribution of information Lack of accountability
Timeliness (Reporting) Verifiability Fraud
Frequent Reporting: There needs to be weekly or bi-weekly reports that can summarize cash flows or other operations inside of the store to be used to hold the associated clerk, via ID number,
accountable.
Lack of reporting False transactions Verifiability of sales Falsified inventory records
Inventory Checks: This shop needs to personally use the frequent reports and physically check random parts of inventory to ensure there are no false sales. It is vital that proper personnel checks and balances are used in reporting. The store should increase the responsibility of the clerks by having them accountant for specific parts of the store/inventory.
Employee pocketing cash Falsified records
Verifiability Falsifying sales
Register Checks: Each day, Kayla should ensure that the registers start at a certain monetary value. At the end of business each day, that register should be counted back down to the normal balance, and the clerk should be held accountable for every transaction that passes through their hands.
Complacent staff Lack of teamwork
Team Management: It may be a good idea to look into hiring more people, or
questioning some of the workers (Becca would be a good start due to her small investment in the company of working one day a week.) to ensure consistent quality without workers who are complacent and
Conclusion:
The above table shows a list of internal controls that can be used by a company to comply with the Sarbanes-Oxley Act Section 404 – Internal Controls. As a result of this act audited must not only express and opinion on the presentation of a company’s financial statements but they must also give an opinion on the effectiveness of a client’s internal controls.
comfortable. At the very least, there should be team meetings and extra training.
Accountability Fraud Verifiability
Checks and Balances: To go along with separation of duties, there should always be at least two people involved with every process, and Lucy and Kayla need to have someone else to hold them accountable, which overall takes a lot of their freedom away.
CASE FIVE: INVENTORY VALUATION Cost Accounting Principles
Case Introduction:
This case seeks to apply cost accounting principles to a given company’s purchases and sales. This case applies both periodic and perpetual inventory methods and tracks transactions of a merchant company. The approach of this case is the process an auditor must take when
auditing the inventories of a client. The information below provides explanations for how to account for various transactions and gives journal entries and charts of accounts to show the applied principles
Raw Materials Inventory:
The costs associated with raw materials would include all the costs of materials that have been acquired or purchased. A company reports these costs assigned to goods and materials on hand but not yet placed into the production process. Examples of these costs may include: actual material costs, actual labor costs, and actual overhead costs.
Work-in-process Inventory:
These costs included in this category include all costs that go into the production process of units that are partially processed. The cost of the raw materials for these unfinished units, plus the direct labor cost applied to the material and the portion of overhead costs make up work-in- process costs
Finished Goods Inventory:
Includes the cost of all finished goods on hand that are unsold. Note 2 states that inventory balances are recorded on a net basis of an estimated allowance for obsolete or unmarketable inventory. The estimated allowance for obsolete or unmarketable inventory is based upon current inventory levels, sales trends and historical experience as well as
management’s estimates of market conditions and forecasts of future product demand.
Part A.
As mentioned previously in Note 2, inventory is reported on a net basis of its allowance for obsolete or unmarketable inventory. This net balance will be reported on the balance sheet under inventory and the contra inventory allowance account is deducted out of inventory as reported on the company’s financial statements, balance sheet
Part B.
Gross inventory should be reported at the end of the year for 2011 the net amount of inventory $233, 070 would be reported at a gross amount by adding back the beginning 2011 balance in the contra inventory account $233,070 +$10,800= $243,870. For the Gross amount for 2012 inventory balance would be reported at $211,734 + $12,520= $224,040 for 2012.
Part C.
The largest amount of inventory that is attributable to reserve the portion of obsolete inventory goes to finished goods inventory because it is most likely that goods become obsolete in the finished goods part of the production process.
Recreate Entries for Obsolete Inventory Accounts:
Figure 5-1: Record the Provisions for Allowance of Obsolete Inventory
Figure 5-2: Record the Write Off/Disposal of Assets Write off/Disposal $11,628 (Dr.)
Finished Goods Inventory $11,628 (Cr.)
Allowance for obsolete inventory $13,348 (Dr.)
Finished Goods Inventory $13,348 (Cr.)
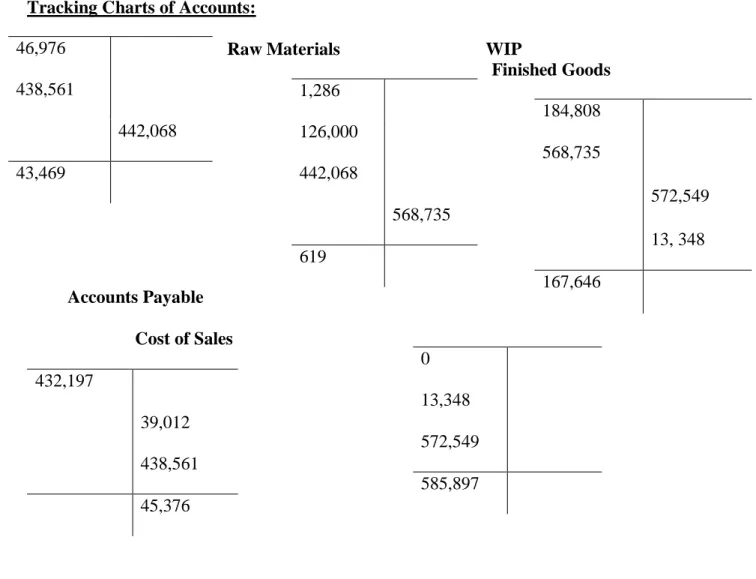
Tracking Charts of Accounts:
Raw Materials WIP
Finished Goods
Accounts Payable Cost of Sales
Figure 5-3: Charts of Accounts (Above)
Inventory Turnover Ratios:
Figure 5-4: Inventory Turnover Ratios Calculations Current year for 2012: (585,897/ 223,402) = 2.63 Prior year for 2011: (575,226/ 250, 830.5) = 2.29
1,286 126,000 442,068
568,735 619
46,976 438,561
442,068 43,469
184,808 568,735
572,549 13, 348 167,646
0 13,348 572,549 585,897 432,197
39,012 438,561 45,376
Inventory Holding Period:
Figure 5-5: Inventory Holding Periods Calculations Current year for 2012: (365 days/ 2.63) = 138.78
Prior year for 2011: (365 days/ 2.29) = 159.39
Calculating Percentage of Finished Goods That are Obsolete:
Figure 5-6: Percentage of Obsolete Goods Calculation Finished Goods of [(167,646 + 13,348) / 13,348] = 7.4%
Conclusion:
As an external auditor or potential inventor, there are a few questions that this calculation would bring someone to question. The first question is what the causes of this loss is? What causes these goods to become obsolete? Why is this happening and is it something that can be improved or corrected? How can management become more aware of this issue and what can they do to fix this problem? These are all questions that an auditor must ask their client when evaluating inventories. This case presented above shows the steps that go into an inventory valuation during an audit.
CASE SIX: WORLDCOM SCANDAL FINANCIAL STATEMENT ANALYSIS Improper Classification of Assets and Expenses
Case Introduction:
This case study analyzes the financial statements of WorldCom Inc. In this case, WorldCom Inc. makes several violations in financial reporting standards. The main focus of this case is the improper classification of line items. Some expenses in this case were capitalized as assets or long-term debt. Depreciation expense is improperly calculated. Several other line items are not fairly represented in this case.
Building Blocks of Financial Statements:
SCON6 defines an “asset” as: probable future economic benefits obtained or controlled by a particular entity as a result of past transactions or events. SCON6 defines an “expense” as:
Outflows or other using up of assets or incurrences of liabilities from delivering or producing goods, rendering services, or carrying out other activities that constitute the entity’s ongoing major or central operations
Cost should be capitalized if they will bring a future benefit or profit to the entity. Expenses should be recognized if they are not intended to bring in additional revenues or benefits but rather to continue the entity’s ongoing operations.
When you have begun to capitalize a cost as an asset you must then record the depreciation of this asset. Depreciation then affects the balance sheet by reducing assets. The effects that this will have on the income statement will cause a reduction to net income and an increase on expenses.
For the year ending December 2001, WorldCom reported line costs on their income statement as an operating expense at $14,734,000,000. The journal entry to record this transaction would show:
Figure 6-1: Operating Expense Journal Entry Line Cost Expense $14,734,000,000
Cash $14,734,000,000
These line costs were described as charges paid to local telephone networks to cover operating costs.
Additionally, these types of line costs that WorldCom improperly capitalized were distributed throughout their balance sheet under the PPE account. In this account WorldCom reported the improper capitalization of their transmission equipment and their communication equipment account. The result of this improper accounting practice showed a significant exaggeration of their assets while failing to expense these costs correctly to their income statement to falsely report positive net income.
Furthermore, these costs appear on their balance sheet as PPE although they should be reported as an expense on their income statement. The journal entry to reflect the improper capitalization of $3.055 billion is:
Figure 6-2: Reclassification Entry for Improper Classification of Assets Property, Plant, and Equipment $3,055,000,000
Line Costs Expense $3,055,000,00
Because WorldCom improperly capitalized these line costs in their Property, Plant, and Equipment account as “transmission equipment” in 2001, the following amounts must be depreciated based off the midpoint of the expected useful life of the equipment quarterly. 4-40 years yields a midpoint of 22 years:
Figure 6-3: Quarterly Depreciation Expense Calculations Quarter 1: $771,000,000/ 22 years x (4/4 quarters) = $35,045,454.55
Quarter 2: $610,000,000/ 22 years x (3/4 quarters) =$20,795,454.55 Quarter 3: $743,000,000/ 22 years x (2/4 quarters) =$16,886,363.64 Quarter 4: $931,000,000/ 22 years x (1/4 quarters) =$10,579,545.45
Net Depreciation: $83,306,818.19
Figure 6-4: Total Depreciation Expense Journal Entry
Depreciation Expense $83,306,818.19
Accumulated Depreciation $83,306,818.19
Corrected Net Income to reflect Depreciation for the year 2001
Figure 6-5: Correcting Net Income Calculation Income before taxes as reported $2,393,000,000
Add: Depreciation for the year $83,306,818 Deduct: Line Costs for 2001 <$3,055,000,000>
Loss before taxes, restated <$32,693,181>
Add: Income Tax benefit $11,442,613
Add: Minority Interest $362,401,136
Net Loss after tax, restated $341,150,568
Case Conclusion:
This case points out the improper representation of several line items and breaks down how they were misrepresented in WorldCom’s financial statements. These improper figures have been recalculated to reflect the true values that WorldCom should have reported on their
financial statements.
CASE SEVEN: LONG-TERM LIABILITIES Targa Company: FASB Presentation Report
Case Introduction:
On December 27, 20X1 Targa Company filed to discontinue their research and
development line of Amor Track. As a result of this decision, the inquiring company must follow the rules and regulations in accordance with the FASB codification to report this restructuring of their business line in their financial statements. Targa Company sent out a formal letter to their employees to inform them of this move for the company. The letter detailed the events of the restructuring plan containing the termination of 10% of the company’s total workforce and information on the repurpose of the facility to expand other divisions within the company which is expected to be completed January 31, 20X2. The following FABS Code supports the
guidelines for which Targa Company must meet to successfully conduct and report a one-time employee termination in reference to FASB 420-10-25-4:
“An arrangement for one-time employee termination benefits exists at the date the plan of termination meets all of the following criteria and has been communicated to employees (referred to as the communication date): A. Management, having the authority to approve the action, commits to a plan their job classifications or functions and their locations, and the expected completion date. C. The plan establishes the terms of the benefit arrangement,
including the benefits that employees will receive upon termination (including but not limited to cash payments), in sufficient detail to enable employees to determine the type and amount of benefits they will receive if they are involuntarily terminated. D. Actions required to complete the plan indicate that it is unlikely that significant changes to the plan will be made or that the plan will be withdrawn.”
The details above present the requirements that Targa Co must provide for their employees in accordance with the FASB Code for filing a one-time employee termination
benefit plan. Furthermore these benefits that Targa Co. will be giving out to their terminated employees are to be recognized as a liabilities on your financial statements. If these liabilities are expected to be expensed in the future please disclose these as long-term. Targa Co. estimates that the one-time termination benefit cost is $2.5 million, total cost of the severance for affected employees is $500,000, and a lump sum amount of $50,000 to the facility manager. The total amount of these obligations are to be recognized as liabilities for Targa Co. Please comply with the FASB Code 712-10-25-1 as it details how to treat these liabilities with regards to financial reporting.
712-10-25-1: “Nonretirement postemployment benefits offered as special termination benefits to employees shall be recognized as a liability and a loss when the employees accept the offer and the amount can be reasonably estimated. An employer that offers, for a short period of time, special termination benefits to employees, shall not recognize a loss at the date the offer is made based on the estimated acceptance rate.”
In addition to the proper treatment of these liabilities, Targa Co. will also be incurring a relocation cost of $500,000 and staff training costs of $1.5 million. Because these cost are being incurred for Targo Co. they are to classify these as reengineering costs. Please follow SEC rule 720-45-55-1:
“The following table sets forth the accounting for typical components of a business process reengineering/information technology transformation project based on whether the item should be: A. Expensed as incurred in accordance with the guidance contained in this Subtopic.
B. Expensed as incurred in accordance with internal-use software guidance contained in
Subtopic 350-40. C. Capitalized in accordance with internal-use software guidance contained in Subtopic 350-40 D. Capitalized as part of the cost of acquiring a fixed asset in accordance with
a company's existing policy.”
The diagram below is a representation of the information listed above:
Furthermore, to expense these reengineering costs appropriately please refer to SEC’s 720-45-25-2: “The following third-party or internally generated costs typically associated with business process reengineering shall be expensed as incurred: a. Preparation of request for proposal—the process of preparing a proposal. b. Current state assessment—the process of documenting the entity's current business process, except as it relates to current software
structure. This activity is sometimes called mapping, developing an as-is baseline, flow charting, and determining current business process structure.
Process reengineering—the effort to reengineer the entity's business process to increase efficiency and effectiveness. This activity is sometimes called analysis, determining best-in- class, profit and performance improvement development, and developing should-be processes.
Restructuring the work force—the effort to determine what employee makeup is necessary to operate the reengineered business processes.”
Conclusion:
Targa Company’s relocation costs are to be expensed internally and also through any third party companies who have current contracts existing with Targa Co. over the past eighteen months. The rest of the reengineering costs are to be expensed by the inquiring company as they are incurred and to represent these expenses properly through the SEC code 720-45-25-2 listed above.
CASE EIGHT: STOCKHOLDER’S EQUITY AND TRESURY STOCK Merck Company Analysis
Case Introduction:
Merck Co. is authorized to issue a total of 5,400,000,000 shares. Of this total, Merck Co.
issued 2,983,508,675 during the fiscal year of 2007. The reconciled amount of the issued shares for 2007 is found by taking the 2,983,508,675 shares X $0.01= $29,835,086.75. For the fiscal year of 2007, Merck Co. has 811,005,791 common shares held as treasury stock. Merck Co. has 2,172,502, 884 of common shares outstanding for the year ending 2007. To calculate the total market capitalization for Merck Co. who has a stock price which closed at $57.61 today this price is multiplied by the amount of outstanding shares to yield a total market capitalization =
$125,157,891,100. Therefore the amount rounded comes out to $125.2 Billion.
Companies pay dividends to their common and ordinary shareholders to give them a return on their investments. Common shareholders are interested in receiving dividends at a normal rate of return. Shareholders are also interested in buying common stock when they perceive the price to be low and hope to see the price of each share grow so that they can sell their shares for a large profit. When a company pays out dividends the price per share will drop by the total amount of dividends they pay out. Dividend payoffs may signal to investors a positive image that the company has the capital to pay out but it also may send a negative signal to potential investors that think the company’s growth rate is declining.
Companies repurchase their own shares for various reasons. For some companies they may want to repurchase their outstanding shares because the company may feel that the market has undervalued their stock. Therefore buying them back will give the company the ability to resell them for a higher price to raise the value of their stock. Along with this a company may want to attract more investors by reducing their number of outstanding shares, which raises the EPS for the company.
The journal entry that summarize Merck. Co.’s common dividend activity is:
Figure 8-1: Recording the Payment of Dividends
Merck Co. uses the cost method to account for their treasury stock transactions. The cost method employs the use of debit T/S at cost which is the repurchase price. All entries are made at the original repurchase cost. The B/S is treated under this method treated by deducting T/S at the bottom of the stockholder’s equity section after totaling paid-in capital and retained earnings.
During 2007 Merck Co. repurchased 26.5 million shares. On average Merck Co. paid
$53.95 per share to buy their treasury stock in 2007.Merck Co. does not disclose their own treasury stock as an asset because treasury stock cannot earn the company any economic future benefit because the company is reacquiring their own shares although it may bring a cash benefit.
Retained Earnings $3,310.7
Dividends payable $3.4 Cash $3,307.3
*in Millions
Figure 8-2: Calculations of Retained Earnings Distributions for 2006 & 2007
(in millions) 2007 2006
Dividends paid 3,307.3 3,322.6
Shares outstanding 2,172.5 2,167.7
Net income 3,275.4 4,433.8
Total assets 48,350.7 44,569.8
Operating cash flows 6,999.2 6,765.2
Year-end Stock price $57.61 $41.94
Dividends per share $1.52 $1.53
Dividend yield 2.64% 3.65%
Dividend Payout 100.97% 74.94%
Dividends to total assets 6.84% 7.45%
Dividends to operating cash flows
47.25% 49.11%
Conclusion:
The objective of this case was to present how Merck Company should account for their various distributions of ownership. Several journal entries and calculations were shown to provide figures for the distributions of dividends to stock holders.
CASE NINE: EMPLOYEE BENEFIT PLANS, STOCK OPTIONS, AND RESTRICTED STOCK UNITS
Dilutive Securities Analysis Xilinx Company
Case Introduction:
Xilinx Company offers its employees an equity incentive plan that involves stock options. In this plan, options are reserved for future issuance of common shares to employees and directors of the company totaling 28.7 million shares as of March 30, 2013 for the company. Additionally, 16 million shares are available in the future under grants from Xilinx’s 2007 Equity Incentive Plan. Xilinx Company’s stock option plan grants the purchase of common stock at 100% of the fair market value from the date of the grant. The 2007 Equity incentive plan has a contract length of 7 years. Prior to the 2007 plan, stock options generally expire ten years from grant date. Stock options granted to existing and newly hired employees vest over a four-year period from the date of grant. A company like Xilinx that uses stock options typically do so in order to give their managers and directors an incentive to drive the stock price of their company up through the results that can bring to the company.
Although stock options provide large benefits to employees as well as performance incentives, companies may also offer their employees compensation in the form of restricted stock units. RSU’s have grown in popularity in recent years as a way to provide stock
compensation to employees. RSU’s cannot be sold until vesting occurs typically 3 to 5 years. If an employee leaves the company prior to this vesting date, they forfeit these shares and they return to the company. This is mutually beneficial to the company as well as well as the employees as it provides an incentive to their employees in the same manner as stock option plans do but in a different form of compensation so that the company can have a variety of compensation plans with low risk to the company. The main difference that the RSU holds against stock options is that RSU’s upon vestment are grant to the employee therefore there is no exercise but rather an assumed exercise.
Supporting Terms:
Figure 9-1: Defined Supporting Terminology Grant Date: The date on which the option or benefit was granted
Exercise Price: The price per share at which the owner of a traded option is entitled to buy or sell the underlying security
Vesting Period: The time period the employee must wait before he/she may exercise their claim on their stock option benefit
Expiration Date: The date at which the stock option expires
Options/RSU Granted: The stock options or RSU granted to employees under specific terms granted to them
Options Exercised: When an employee utilizes their stock options
Options/RSU Forfeited: Occurs when an employee leaves the company before the date at which they were to be able to exercise their grant to the stock option
Xilinx Company has an employee stock purchase plan set up for their employees. Notes #2 and #6 in their financial reports describes the plan for qualified employees, which are capable of purchasing a 24-month plan to purchase the company’s common stock at the end of each six-
month exercise plan. Xilinx has approximately 78% of their employees eligible to be under this stock purchase plan. In 2013 employees purchased a total of 1.3 million shares for $34.5 million.
The benefit of this plan is that employees are allowed to purchase stock at a discounted price.
Employees contribute to the plan through payroll deductions, which build up between the offering date and the purchase date.
The proper accounting approach to treat these stock options and RSU’s begins with
expensing the compensation over the period during which the employee is required to perform service in exchange for the award. Additionally the company is required to record compensation expense for the unvested portion of previously granted awards that remain outstanding at the date of adoption.
For 2013 stock based compensation for Xilinx company totaled $77,862. The above expense is included on the company’s statement of income under cost of goods sold, research and
development expense, and selling, general and administrative expense.
The Stock based compensation is recorded as an increase under the operation activities section in the statement of cash flows. The income tax effect is $22,137. Xilinx Company was unable to deduct the stock option so the company had to pay the income tax amount of the
$22,137.
Figure 9-2: Stock Based Compensation Journal Entry
Cost of goods sold $6,356
R&D Expense $37,437
SG&A Expense $33,569
Additional PIC S/O $77,862
Conclusion:
Part one of this question asks about which trend does this WSJ article about stock options and RSU’s discuss and which have become more attractive today. As this article describes these it details the large drop off of corporations using stock options these day. As opposed to being 78% of compensation in the late 1990s it has been seen in the top 200 largest corporations to make up around 25% today. The large change has been seen in a shift to companies favoring RSUs for multiple reasons. Among the biggest reasons for this shift is because it gives companies a more accurate estimate of the compensation that is dilutive to the company.
Because stock options can be exercised at any date on or passed the exercise date, profits on stock options have potential to be far larger than a company may anticipate, especially if the company is expecting large growth and an increasing stock price while having unexercised compensation. I would guess that employees would rather have stock options because of the reasons listed above but I do see as our financial markets and industries are growing and becoming more complex that it is becoming way more attractive to companies to grant RSUs over stock options.
Part two draws the connection of this increase in popularity of RSUs to Xilinx
Company’s usage of RSUs as another form of compensation they offer to their employees. Based on this article and the finical reports for Xilinx in 2013 there is a noticeable increase in the company’s usage of RSU compensation. This article proves to be consistent with the current trend of companies shifting towards RSU compensation.
CASE TEN: REVENUE RECOGNITION Five Step Recognizing Revenue Model
Case Introduction:
This case uses the five step revenue model to properly recognize revenue in the correct period. This case uses independent scenarios provided by a case study on this subject. Each scenarios uses the five step model to properly record revenue. Each scenario builds onto the next to show proper treatments of revenues.
Scenario one:
Identify the Contract: The contract in this scenario is formed between the customer and the bartender to sell a cup of beer for the price of $5.
Performance Obligation: Giving the beer to the customer Price: $5 for a cup of beer
Allocate transaction price: Allocate price when the customer gives $5 and then receives the cup of beer
Revenue recognition: Recognize when the performance obligation has been satisfied, in this scenario recognize revenue immediately
Figure 10-1: Recording Revenue
Cash $5
Sales Revenue $5
Scenario 2:
Identify the Contract: The contract in this scenario is formed between the customer and the bartender to sell a cup of beer for the price of $7
Performance Obligation: Giving the beer to the customer
Price: $7 for a cup of beer. 5/7 allocated to the beer and 3/8 to the mug
Allocate transaction price: Allocate price when the customer gives $7 and then receives the cup of beer and the mug. The customer is saving a dollar by purchasing the mug with the beer for a value of $7 although regular cup of beer has a cost of $5 and the mug alone sells for $3 but together the allocated price is $7 when purchased together
Revenue recognition: Recognize when the performance obligation has been satisfied, in this scenario recognize revenue immediately
Figure 10-2: Allocation of Revenue
Cash-Beer $5
Sales Revenue- Beer $5
Cash-Mug $2
Sales Revenue- Mug $2
Scenario 3:
Identify the Contract: The contract in this scenario is formed between the customer and the bartender to sell a cup of beer for the price of $5. There is a second contract formed to be fulfilled in the future. This is an unperformed pending contract for $2 to get two pretzels at a later date. Therefore no goods have been exchanged but a contract has been formed to fulfill the obligation in the future.
Performance Obligation: Giving the beer to the customer immediately and promising 2 pretzels for the price of 1 pretzel in the future.
Price: $5 for a cup of beer and $2 for the pretzel coupon. $7 total paid immediately but $2 of this transaction is not exchanged for goods today
Allocate transaction price: Allocate price when the customer gives $7 and then receives the cup of beer immediately and allocate the sale of the pretzel coupon for $2 as a current obligation to be fulfilled later.
Revenue recognition: Recognize when the performance obligation has been satisfied, in this scenario recognize partial revenue immediately for $5 of the total $7 received. $2 for the pretzel coupon should be recognized as a liability until the contract is fulfilled. Recognize the $2 as unearned revenue.
Figure 10-3: Sales Discounts
Cash-Beer $5
Sales Revenue- Beer $5
Cash- Coupon $2
Unearned Revenue- Coupon $2 Scenario 4:
Identify the Contract: The contract in this scenario is formed between the customer and the bartender to accept the valid prepaid coupon in exchange for two pretzels
Performance Obligation: Giving two pretzels to the customer for the coupon Price: $2 for a prepaid coupon
Allocate transaction price: Allocate price when the customer exercises the prepaid coupon in exchange for two pretzels. Although two pretzels sells for $4, the prepaid coupon was sold to the student for $2 to be redeemed at a later date when pretzels are available for sale
Revenue recognition: Recognize when the performance obligation has been satisfied, in this scenario recognize revenue immediately for $2, which was exchanged in the past for
consideration to receive two pretzels at a later date.
Figure 10-4: Deferred Revenue
Unearned Revenue $2
Sales Revenue $2
Conclusion:
This case shows how to properly recognize revenue through the five step procedure. The examples are relatively simple but the concepts and the applied methods are important for any issuer of financial statements with respect to cut-off periods and timeliness of financial reporting
CASE ELEVEN: DEFERRED INCOME TAXES Zagg Inc. Analysis and Application of Principles
Case Introduction:
This case use Zagg Inc.’s financial statements to show the proper treatment of income taxes.
This case study presents the companies transaction throughout the year and various calculations are made to provide information on this clients deferred income.
The term “book income” is used to represent the taxable entity portion, which is reflected on the company’s financial income statements. Book income usually does not align with taxable income, which is why it is important to note the differences when dealing with a company that has deferred taxes on their assets and or liabilities. Book income is seen in Zagg’s statement of operations for the year of 2012 as Income before tax provisions in the amount of $23,898,000.
As stated previously, book income differs from taxable income because certain figures included in a company’s book net income may have deferred taxes on their assets and liabilities which are necessary to show for transparency purposes but also it is necessary for the company to show what their net income looks like on their financial statements that is taxable in the current year as well as what they may be being deferring off into future periods.
Figure 11-1: Supporting Terminology and Examples
Permanent tax differences: A form of a difference in financial statements where the difference for tax reporting purposes will never be eliminated. A permanent difference that results in the elimination of a tax liability is desirable for a company. Examples of these differences include penalties and fines and municipal bond interest.
Temporary Tax Differences: is defined as a difference between the carrying amount of an asset or liability in the balance sheet of its tax base. An example of this can be a temporary deductible
in which is a temporary difference that can be deducted in the future when determining taxable profit or losses.
Statutory Tax Rate: is defined as a tax rate that is determined and imposed by law. An example of this would be the federal corporate tax rate.
Effective Tax Rate: is defined as the average tax rates that individual and corporations. These tax rates can been seen in excise taxes and payroll taxes.
Companies report deferred income taxes as a part of their total income tax expense because they need to show their current tax expenses as well as the amount of tax expense that they will be paying in the future or receiving back to them. If a company only reports their current tax bill that they have to pay for the current period, they could be reporting misleading information on their financial statements by understating their liability or possibly overstating their assets. This is a better method of recognizing their expenses even though they are not paying the portion of tax presently they need to show their outstanding taxes to be paid or received back in the future.
Deferred income tax assets are used as a term for representing a situation when a company has overpaid its taxes or paid for their taxes in advance. Since these taxes are seen as a benefit for a company to be in this position, the reporting company may recognize these as an asset and in return they may be granted a tax relief which they are given back or an over payment is returned to the company, therefore and asset. A simple example of this is when a company carries over losses in their fiscal year. This loss can be used to receive a tax befit reduction and can be seen as an asset as it reduces the total loss the company should have absorbed.
Alternatively a deferred income tax liability is a tax that a company has incurred but not yet paid in the current period but rather is planning on making the payment in the future. An example of a
tax liability may occur when a company has a difference in their depreciation expense by the tax laws and the accounting regulations.
Deferred income tax valuation allowance is an account that can been seen on a company’s balance sheet which is used to offset a portion or all of a company’s deferred tax assets. This is used because a company does not expect to be able to realize all of its value of the asset. This is likely used for a business that has a record of allowing these assets expire without using them or the company is expecting to incur certain losses in the near future and they are planning to set aside a balance to monitor and account for the loss. This allowance account should be monitored or kept in check frequently. The tax effect on such valuation allowance accounts are used to offset the deferred tax asset that they may be expecting to be able to realize as a contribution to their profits in the near future in effect the company can record these assets at their full value.
Zagg Inc. Income Tax Journal Entries
Figure 11-2: 2012 Income Tax Provision
Income Tax Expense $9,393,000
Net Deferred Tax asset $8,293,000
Income Tax Payable $17,686,0000
Figure 11-3 Net Deferred Income Tax Expense
Income Tax Expense $9,939,000
Deferred Tax Asset $8,002,000 Deferred Tax Liability $291
Income Tax Payable $17,686,000
Figure 11-4: Reconciliation of Zagg’s Effective Tax Rate ETR= 9393/23,898=39.3%
Conclusion:
Deferred income tax asset of $13,508,000 appears on Zagg’s balance sheet in two places
$6912 appears on the balance sheet in the current asset section of deferred income taxes and the rest $6596 appears further down the balance sheet and is reported as the noncurrent portion the deferred income tax assets.
CASE TWELVE: LEASE AGREEMENTS Build-A-Bear Workshop Analysis
Case Introduction:
This case analyses Build-A-Bear Workshop Company and discuss the advantages and disadvantages of a company looking to obtain a lease agreement. Two types of lease agreements are discussed in the case: Operating lease and capital leases. The advantages and disadvantages will be discussed in the following.
There are a couple advantages to a company that may choose to lease their assets as opposed to selling them right out. One advantage that leasing presents is a form of continued cash flow that a complete and full payment does not bring. Although a lump sum of payment is always straightforward, it may also be advantageous to a business to accept some cash now and more cash later. Additionally this could perhaps include interest to be received because they have agreed to take multiple payments in consistent installments at an agreed date. Another advantage with leasing assets out is the tax benefit that is considered an operating expense, which is tax deductible from pre-tax income.
Figure 12-1: Types of Lease Agreements
Operating Lease: is a lease whose term is short as compared to the overall useful life of the asset that is being leased out. In general, this type of lease is used in order to obtain and asset for a relatively short time period.
Capital Lease: is a lease contract that entitles a lessee to the temporary use of an asset. The lessee should treat this differently with accounting purposes for their business. A capital lease requires a lessee to add assets and liabilities associated with the lease. A capital lease differs from an operating lease, as a capital lease is closer to a purchase of an asset while an operating lease is a true lease agreement.
Direct-financing lease: This is a type of lease that couples a sale together with a financing
transaction. The treatment of these types of leases is done so where the lessor removes the leased asset from its books and replaces it with a receivable from the lessee. The lessor does recognize interest revenue and the lessor uses no other revenue accounts.
Sales-type lease: This type of lease is similar to a capital lease but more specifically varies from a capital lease when the present value of the lease payment is higher than the carrying amount of the leased asset. In this type of lease the lessor records an operating profit equal to the difference between the discounted lease payments and the carrying amount. After this, then the lessor records interest income over the lease term. The lessor has accounting implications the lease but the lessee has none.
Why do accountants distinguish between different types of leases?
Accountants distinguish between different types of lease agreements because most importantly it gives users of financial statements a transparent, relevant, and reliable look into this specific business. Another reason for this is because certain types of leases may arise as a liability for the lessee and an asset and or liability for the lessor. These difference reflect different outcomes on a company’s financial statements.
Hypothetical Rent Lease Scenario:
Part I: Will this lease be treated as an operating lease of capital lease under GAAP?
This lease will be treated under GAAP as an operating lease because it does not meet the lease requirement criteria for a capital lease.