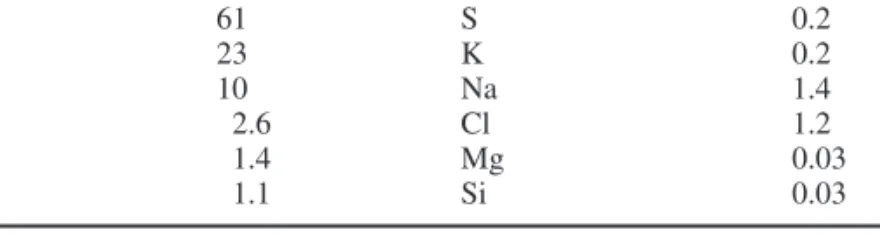
Southgate, formerly of the AFRC Institute of Food Research, Norwich, UK Mass spectrometry of natural substances in food. The researchers who choose to work in the field of trace element determinations are not necessarily experienced analytical chemists.
Atomic Fluorescence Spectrometry 164 8.1 Introduction, History and Principles 164
Nuclear Activation Analysis 172
Comparison of Analytical Techniques 222 12.1 General Approaches for Selecting a Technique 222
Importance of Trace Elements in Food
- Essential Trace Elements
- Classification of Trace Elements
- Discovery of Essential Trace Elements
- Functions of Trace Elements
In recent years, the importance of the role of trace elements in biological systems has been increasingly recognized. For this reason, trace elements are one of the important nutritional factors for the growth and maintenance of human and animal life.
Trace Element Studies
The second general role of trace elements is their function in regulating numerous biological activities. Efforts have been made in recent years to understand the role of trace elements in the biological system, especially in human metabolism.
- Introduction
- Analytical Errors
- Accuracy and Precision
- Determinate and Indeterminate Errors
- Significant Figures
- Mean, Median, Mode, Range and Mean Deviation
- Mean
- Median
- Mode
- Range
- Mean Deviation
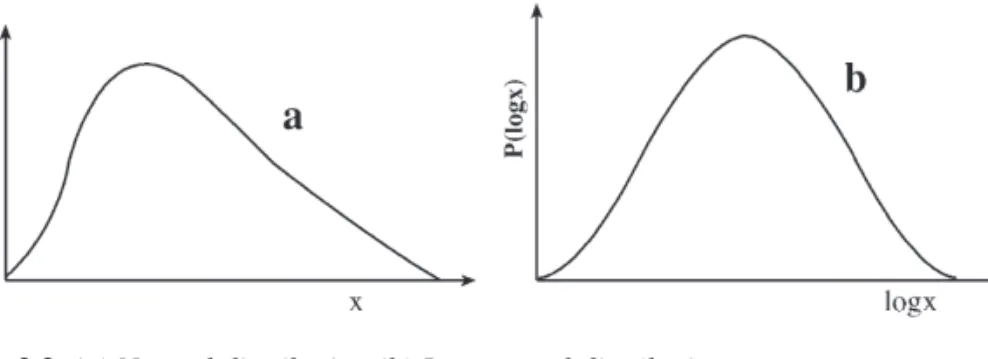
- Normal Distribution of Random Variables
This is expressed by precision, which can be defined as a measure of the repeatability of a measurement. In addition and subtraction type calculations, the number of significant digits is determined by the location of the decimal point and can be seen by visual inspection.
Gaussian Distribution
- Log-Normal Distribution
- Standard Deviation
- Confidence Limit, Confidence Interval and Confidence Level
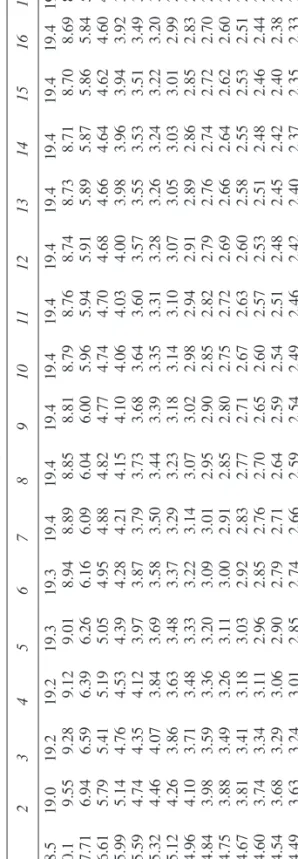
- Student’s t Distribution: Confidence Limit for Small Number of Measurements
- Testing for Statistical Hypothesis
- Comparison of Experimental Means with True Value or with Each Other: Student’s t Test
- Comparison of Two Experimental Standard Deviations
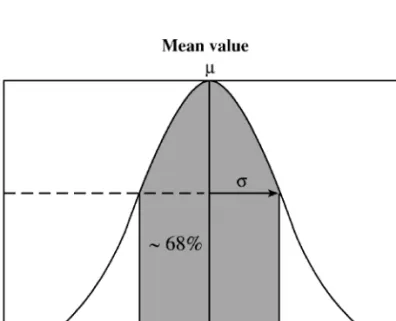
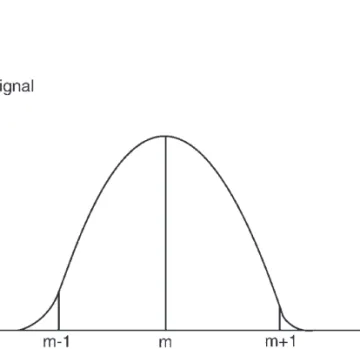
Measures of variability include certain constant fractions of the total area of the normal curve. The middle 50% corresponds to 0.6745σ. The first interpretation of the results is that whenever a sample is selected from a population, the chances are 68.26 out of 100 that its sample mean is within 1σ of the population mean.
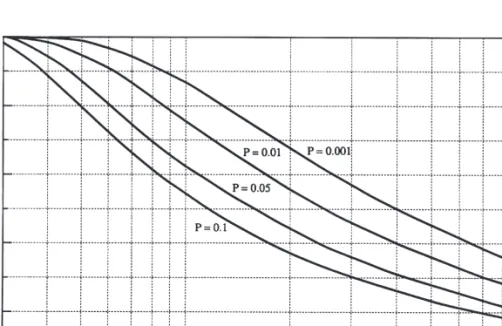
The F Test
Rejection of Outliers
- Dixon’s Q Criterion
- Student’s t Criterion
- Gibbs’s R Criterion
As in the case of t-criterion, x¯ and sare the mean and the standard deviation for N1. As seen, all three criteria gave the same result, namely the value of 26 should be rejected.
Linear Regression Analysis
- Multiple Linear Regression
The sum of the squares of the deviations, SSD, for each point from the line is The greater the slope of the regression line and the greater the variance of x,σx2, the greater will be the value of r, and thus the fraction of σy2.
Receptor Models
- Factor Analysis
- Chemical Mass Balance Method
- Enrichment Factors of the Elements
The primary goal of using factor analysis is to derive a small number of components that explain a maximum of the variance in the data. One of the biggest problems in factor analysis is deciding how many factors to retain.
Scope of Trace Analysis
Methodology, Terms and Definitions
- Sample, Analyte, Matrix and Blank
- Qualifications for a Trace Analysis Laboratory
- Water Purification
- Precision, Accuracy and Traceability
- Calibration
- Analytical Figures of Merit
- Detection Limit and Limit of Quantitation
- Analytical Range
- Sensitivity
- Signal to Noise Ratio
- Relations between Precision, Sensitivity, DL and S/N
- Selectivity and Interference
- Legal Importance of Results, Traceability and Other Related Concepts
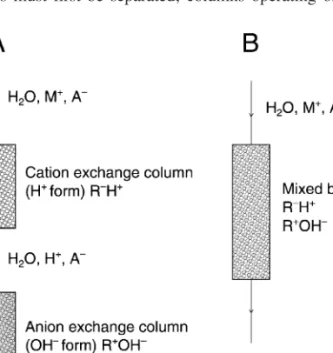
The state of being accurate and all the documentation and effort spent on accuracy is defined by the concept of traceability. The concept of traceability will be dealt with in more detail in section 3.2.7. The observation of the following points is a minimum requirement for a successful correction of multiplicative interferences using the standard addition method: i) The analytical signals obtained must be in a linear range so that extrapolation of the line to obtain the intercept on the x-axis will not cause any error. ii) The endogenous and exogenous analyte species should be in the same form in terms of oxidation state, chemical environment, etc.
Further Reading
General Guidelines in Collection and Preparation of Staple Foods and Diets
All sample containers to be used must be made of either polyethylene or polypropylene and preferably not previously used. If any contamination arising from containers is suspected, it should be checked using washed out blank solution using a proper procedure. The final pooling steps when preparing food and diet samples should be performed using polyethylene gloves; the use of talc must be avoided.
Sampling of Major Staple Foods
- Wheat
- Wheat Flour
- Bread
- Pasta
- Rice
- Potato
- Meat
- Vegetables and Fruits
- Milk
- Fresh Eggs
- Other Staple Foods
In terms of ash content, the type of white bread most consumed should be collected. At least 4 pasta samples each weighing 0.5 kg dry weight must be taken for the final analysis. The final samples must be placed in polyethylene bags, with at least 0.5 kg per sample.
Collection of Diet Samples
- Collection and Preparation of Foods for Composition of Representative Mixed Total Daily Diets, Market Basket
- Collection of Food Samples
- Duplicate Portion Technique
- Homogenization and Freeze Drying
The Food and Drug Administration emphasized that the total values should be a significant segment of the total population. Ideally, all foods with a daily intake of 0.1 g or more should be included in the food list. Samples should be homogenized with a homogenizer with Ti blades to avoid contamination.
Sample Dissolution and Decomposition
- Dry Ashing Techniques
- Wet Ashing Techniques
- Open Wet Digestion
- Closed Wet Digestion
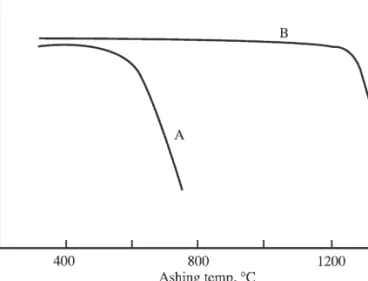
At elevated temperatures, some volatile forms of analyte may leave the contents of the mixture. On the other hand, analyte species can also be removed from the sample solution on the vessel walls, resulting in negative errors. Digestive bombs can be heated above the boiling point of the contained liquid because elevated pressure prevents boiling.
Fundamentals, Definitions and Terms
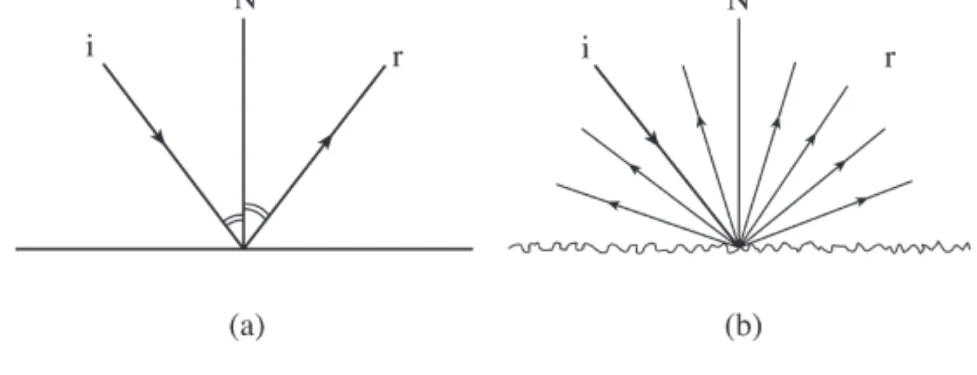
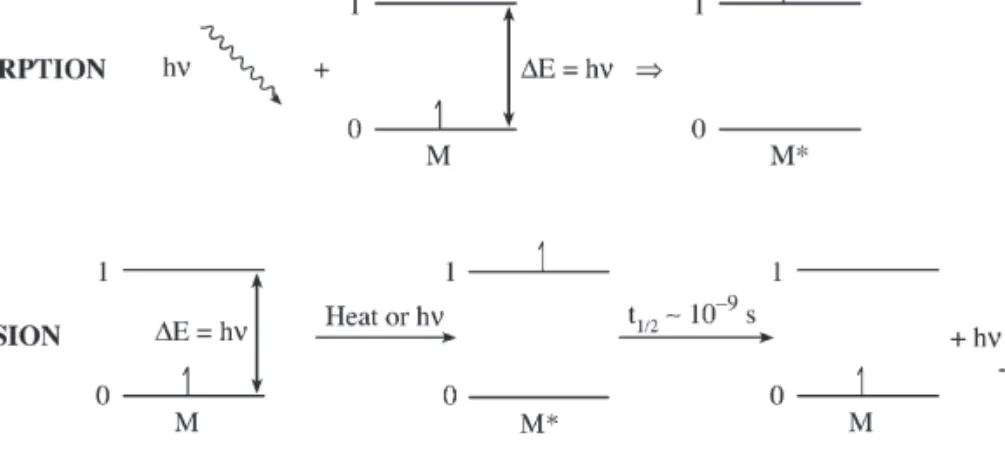
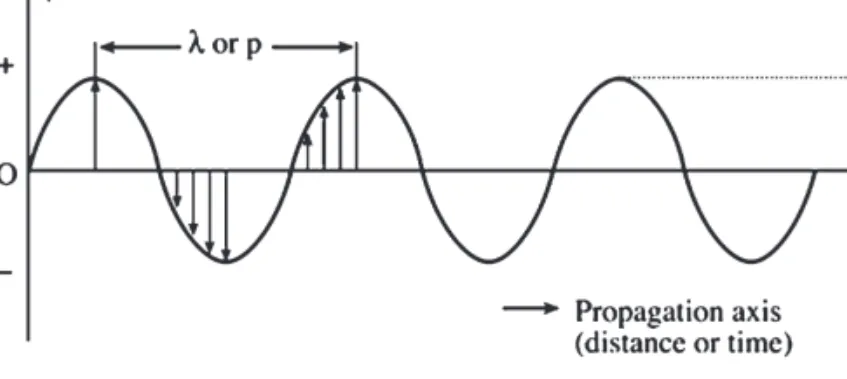
A similar phenomenon occurs on a reflective surface; if the imperfections on a smooth surface are much smaller than the wavelength of the incoming photon, near-total reflection occurs; angles of incidence and reflected rays with the normal are equal; this Figure 5.4 Total internal reflection. The phenomenon of plane polarization of light is shown in figure 5.7; the beam at "c" is transmitted through a polarizer that selectively absorbs components in the YZ plane to obtain plane polarized light only. Photoluminescence is called fluorescence when the emission Figure 5.7 Polarization of light: (a) Several electric radiation vectors propagating in the Z axis perpendicular to the face.
Atomic and Molecular Spectrometry
- Molecular Spectrometry
- Luminescence Spectrometry
- Atomic Spectrometry
These methods can be used for the determination of elements in ways similar to those in spectrophotometric methods. Group of techniques to determine elements in their atomic state can be called atomic spectrometry. Once the analyte species have been converted into free atoms and atomic ions, their determination can be performed by atomic absorption, atomic emission, or atomic fluorescence techniques, the first two of which are more commonly used today.
Instrumentation
- Basic Components for Spectrometric Instrumentation .1 Some Important Optical Units
- Wavelength Selectors
- Sources
- Detectors
An off-axis concave mirror is often used in spectrometer designs; its operation is shown in figure 5.13. The images at successive wavelengths are arranged in a plane perpendicular to the optical axis; this is called the focal plane, as shown in Figure 5.18, which extends from points f to p. This problem is solved by using a prism as an order sorter after the grid, as shown in Figure 5.23.
Introduction, History and Principles
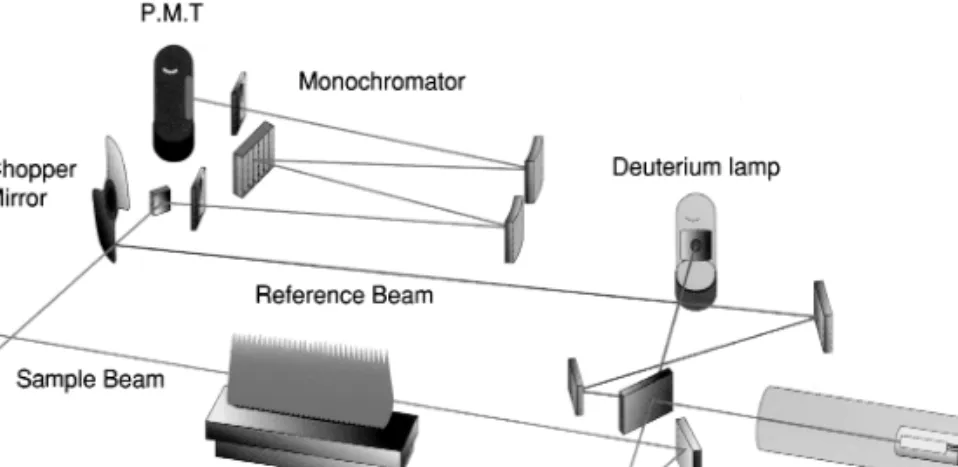
Therefore, the absorption value to be obtained by using a continuum source is obviously very small; a line source should be used for high sensitivity. Since the absorption value obtained when using a continuum source and low-resolution monochromator is quite low, line sources are commonly used in AAS; the spectral resolution is limited by the source bandwidths rather than the monochromator spectral slits, as opposed to molecular absorption measurements. This style was chosen to better emphasize the contrast between a line source and a continuum source.
Instrumentation
- Sources
- Monochromators
- Atomizers
- Flame Atomizers
- Furnace Atomizers
- Cold Vapour Atomic Absorption Spectrometry (CVAAS)
- Hydride Generation Atomic Absorption Spectrometry
- Atom Traps for Flame Atomizers
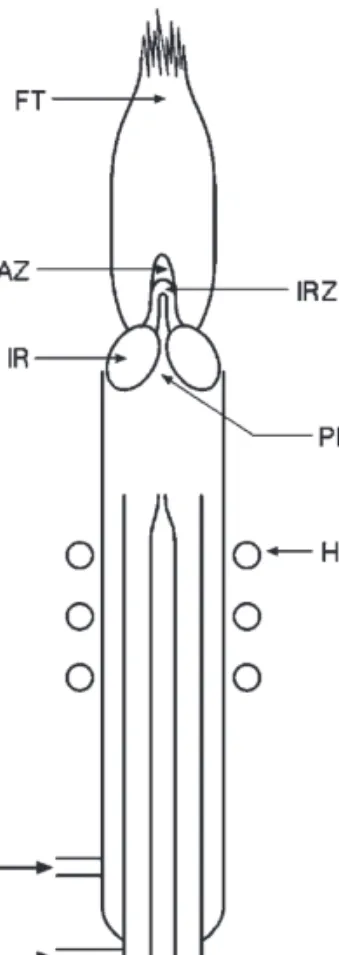
Once the atom cloud is formed in the nebulizer, the maximum physical overlap of the analyte with the source radiation must occur. The position of the droplet in cuvette is important; the drop position must be reproducible. As the analyte atoms are formed and then diffuse out of the cuvette, a transient signal is formed and recorded, as shown in Figure 6.5.
Interferences
- Non-spectral Interferences
- Spectral Interferences
This type of interference is multiplicative in nature and therefore the associated problems must be handled in the presence of the analyte. Because the splitting may not be perfect, background absorption contains some of the analyte's atomic absorption signal, resulting in overcorrection. During the Zeeman splitting, the polarization of the π and σ components is named according to the observation direction, as shown in Figure 6.16 and described below.
Analysis of Solid Samples
The magnet is in the atomizer and the magnetic field is applied alternately (ac), perpendicular to the optical axis; only the absorption profile is separated. When on, σ components from the source cannot be absorbed by atoms having the π configuration for the absorption profile; therefore only BA is measured. The σ components of the absorption profile are circularly polarized and wavelength shifted; therefore there is no interaction between them and the σ components from the source emission.
A General Evaluation and Capabilities of AAS Systems
ETAAS detection limits were found using 50 µL sample volumes, an integrated platform and full STPF conditions using AAnalyst 800 spectrometer. A list of detection limits is given in Table 6.1; the values are provided by Perkin Elmer Instruments.40 The values given in Table 6.1 are not necessarily comprehensive. ICP-OES and ICP-MS techniques provide better detection limits for most of these elements.
Introduction, History and Principles
Another major breakthrough has been the use of inductively coupled plasma (ICP) sources for AES. In the last 20 years, an important development in this field has been the use of mass spectrometric detection for ions formed in an ICP3; Determination at nanogram per liter levels for most elements is now possible using this technique called inductively coupled plasma-mass spectrometry (ICP-MS). Especially after advances in the use of Ar plasma as an ion source, SSMS has given way to ICP-MS for elemental analysis.
Optical Emission Spectrometry
- Optical Emission Spectrometry with Classical Sources
- Optical Emission Spectrometry with Plasma Sources
- Power Supplies for RF Generation
- Sample Introduction Systems
- Detection Systems and Measurement Modes in ICP-OES
- Interferences
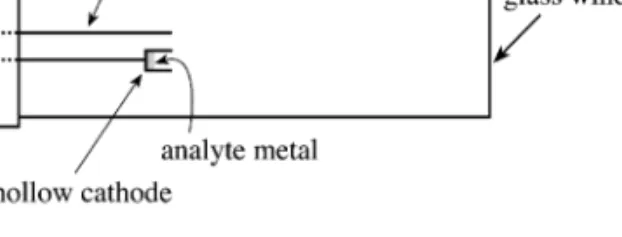
One of the electrodes is pure carbon (counter electrode) and the other (sample electrode) contains the sample in the form of a pure metal or alloy. The examples of different volatility are a problem; It may be necessary to ash the sample beforehand. The robustness of plasma conditions can be verified by measuring the intensity ratio of an ionic to atomic spectral lines of the same element.
Inductively Coupled Plasma–Mass Spectrometry
- Instrumentation
- Mass Analyzers
- Detectors
- Interferences
- Spectral Interferences
- Non-spectral Interferences
- Approaches for Elimination of Interferences
- Isotope Dilution ICP-MS
- Instruments and Applications
ICP-MS is the combination of an argon plasma as an ion source and a mass spectrometer. This technical problem has been at the center of attention especially in the early years of ICP-MS development. Currently, the use of these instruments is not as common as ICP-MS instruments with quadrupole analyzers.
Further Readings
- Introduction, History and Principles
- Instrumentation
- Excitation Sources
- Atomizers
- Interferences
- Instrumentation and Applications
- Introduction
- Basic Principles
- Radioactive Decay
- Half-Life
- Irradiation with Neutrons and Charged Particles
- Neutron Activation Analysis
- Cross Section
- Neutron Sources
- Preparation of Samples for Irradiation
- Short Irradiation
- Intermediate and Long-Lived Isotopes, Long Irradiation
- Calculation of Activity Produced after Neutron Irradiation
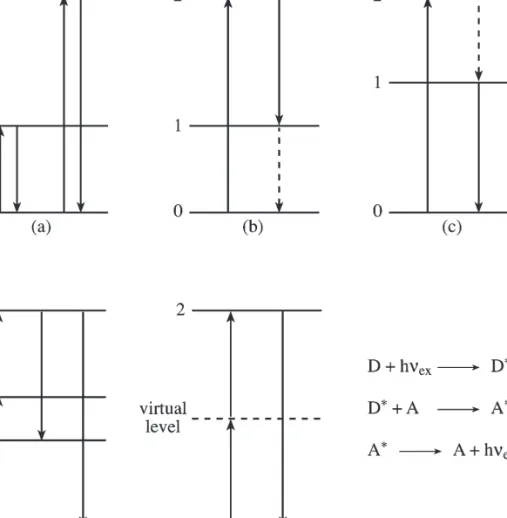
There are several types of AF, as shown in Figure 8.1; the resulting spectra include only lines. The main reasons for these achievements were. a) inherent sensitivity to a large number of elements, (b) its non-destructive character,. By analyzing this curve, the radioactivity or count rates of individual radionuclides can be obtained.