extinction among fossil taxa
Peter J. Wagnera,1and George F. Estabrookb,2
aDepartment of Paleobiology, National Museum of Natural History, Washington, DC 20013; andbDepartment of Ecology and Evolutionary Biology, University of Michigan, Ann Arbor, MI 48109
Edited by Mike Foote, University of Chicago, Chicago, IL, and accepted by the Editorial Board September 19, 2014 (received for review April 4, 2014) Evolution provides many cases of apparent shifts in diversification
associated with particular anatomical traits. Three general models connect these patterns to anatomical evolution: (i) elevated net ex- tinction of taxa bearing particular traits, (ii) elevated net speciation of taxa bearing particular traits, and (iii) elevated evolvability expanding the range of anatomies available to some species. Trait- based diversification shifts predict elevated hierarchical stratigraph- ic compatibility (i.e., primitive→derived→highly derived sequences) among pairs of anatomical characters. The three specific models fur- ther predict (i) early loss of diversity for taxa retaining primitive conditions (elevated net extinction), (ii) increased diversification among later members of a clade (elevated net speciation), and (iii) increased disparity among later members in a clade (elevated evolv- ability). Analyses of 319 anatomical and stratigraphic datasets for fossil species and genera show that hierarchical stratigraphic com- patibility exceeds the expectations of trait-independent diversifi- cation in the vast majority of cases, which was expected if trait- dependent diversification shifts are common. Excess hierarchical stratigraphic compatibility correlates with early loss of diversity for groups retaining primitive conditions rather than delayed bursts of diversity or disparity across entire clades. Cambrian clades (predominantly trilobites) alone fit null expectations well. How- ever, it is not clear whether evolution was unusual among Cambrian taxa or only early trilobites. At least among post-Cambrian taxa, these results implicate models, such as competition and extinction selectivity/resistance, as major drivers of trait-based diversification shifts at the species and genus levels while contradicting the predic- tions of elevated net speciation and elevated evolvability models.
trait-based diversification|extinction|evolvability|speciation|Cambrian
A
basic question in evolution is whether shifts in taxonomic and/or morphologic diversification are tied to particular anatomical traits. The fossil record includes many examples of taxa possessing one set of traits losing diversity over time, whereas other taxa with different sets of traits gain diversity (1–4). Simi- larly, phylogenies of extant taxa often suggest that speciose sub- clades possessing derived traits were once much less diverse than the remainder of the clade diagnosed by primitive traits (5–7). In a different vein, morphospace studies often indicate that partic- ular subclades diversify in regions of morphospace seemingly off limits to the remainder of the clade (8–10). Three models of trait- based diversification shifts explain these patterns. Model 1 (ele- vated net extinction) posits elevated extinction rates and/or de- creased origination rates among taxa with primitive traits (11, 12).Model 2 (elevated net speciation) posits elevated speciation rates and/or decreased extinction rates among some taxa with derived traits (11, 13, 14). Model 3 (elevated evolvability) posits that some characters vary only among some derived taxa and not among the remainder of the clade (3, 15). These models are not mutually exclusive: elevated evolvability might elevate net speciation (mod- els 2 and 3) (16), or elevated speciation in one part of a clade might induce elevated extinction in another part of a clade (models 1 and 2) (17). However, we do not know whether any of these three models predominates or even whether trait-based diversification shifts are the norm at low taxonomic (e.g., species and genus) levels.
Model Predictions
We can test whether traits correlate with diversification shifts on phylogenies of extant taxa (13, 14). However, accurately esti- mating extinction rates and recognizing lost diversity given only extant taxa are notoriously difficult (18, 19), both of which bias such tests against supporting the elevated net extinction model (20). Modifying these tests to include taxa sampled in different time intervals rather than from just the present should improve extinction rate estimates (21). Even then, error in phylogenetic reconstructions for fossil taxa is biased toward elevating early di- versification rates (22). Such error biases inferred trees against supporting differential net cladogenesis and possibly, against ele- vated evolvability.
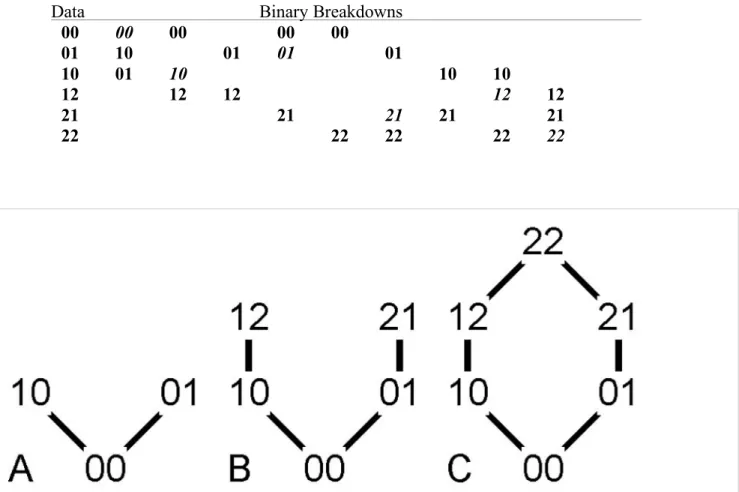
Trait-based diversification and trait-independent diversification make different predictions about the fossil record without refer- ence to specific phylogenies (9, 10, 23–25). Stratigraphic patterns among compatible character pairs are one example. Character pairs are compatible if there are phylogenies that do not require parallelism or convergence for either character (26, 27). If both characters have two states, then at most, only three of four possible combinations evolve. Such pairs are stratigraphically compatible (28) if they fit one of two patterns. Suppose that we label the character states on the oldest-known species 0. Hierarchical stratigraphic compatibility (HSC) is species with00occurring in the oldest strata, species with10appearing in younger strata, and species with11appearing in still younger strata. HSC is consistent with a 00→10→11sequence of evolution. Divergent stratigraphic compatibility (DSC) is species with00occurring in the oldest strata,
Significance
Shifts in biological diversity often are associated with particular anatomical traits. Anatomical data from over 300 clades of bra- chiopods, molluscs, arthropods, echinoderms, and chordates show that trait-based diversification shifts are common at even fairly low (genus and species) taxonomic levels. Cambrian taxa present the lone major exception. Among post-Cambrian taxa, diversification shifts correlate strongly with elevated net ex- tinction of primitive taxa rather than elevated net speciation of derived taxa or increased morphological disparity among de- rived taxa. This finding emphasizes the importance of extinction in shaping morphological and phylogenetic diversity among closely related species and genera as well as suggests another way in which Cambrian evolution was unique.
Author contributions: P.J.W. and G.F.E. designed research; P.J.W. performed research; P.J.W.
and G.F.E. contributed new reagents/analytic tools; P.J.W. analyzed data; and P.J.W. wrote the paper.
The authors declare no conflict of interest.
This article is a PNAS Direct Submission. M.F. is a guest editor invited by the Editorial Board.
Data deposition: The datasets used in this paper have been deposited in The Paleobiology Database,www.paleobiodb.org/cgi-bin/bridge.pl?a=nexusFileSearch(reference no.53093).
See Commentary on page 16240.
1To whom correspondence should be addressed. Email: [email protected].
2Deceased November 24, 2011.
This article contains supporting information online atwww.pnas.org/lookup/suppl/doi:10.
1073/pnas.1406304111/-/DCSupplemental.
www.pnas.org/cgi/doi/10.1073/pnas.1406304111 PNAS | November 18, 2014 | vol. 111 | no. 46 | 16419–16424 EVOLUTIONEARTH,ATMOSPHERIC, ANDPLANETARYSCIENCES
acters (26, 27). Simulations confirm this expectation (29) (SI Appendix, Fig. S4). If characters change infrequently, then there usually will be several species bearing00(hereafter, a paraclade) (30) contemporaneous with the first species bearing 10 (31).
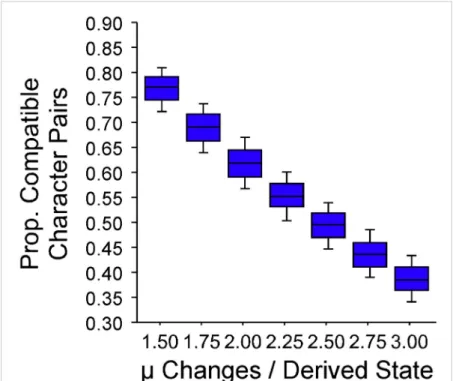
Under trait-independent diversification, that paraclade should generate more total descendants than the sole-derived species (30) and thus, generate more opportunities for a00→01transi- tion (DSC) than for a10→11transition (HSC). Simulations show that, given trait-independent diversification and no addition to character space, fewer than 40% of stratigraphically compatible pairs should be HSC (SI Appendix, Fig. S5). These expectations hold over a wide range of per-taxon sampling rates and evolu- tionary models (SI Appendix, Fig. S5) (note that the same sim- ulations show that we should sample state pairs in correct order for 95% of compatible character pairs).
Increasing net extinction rates within paraclades retaining00 pairs (model 1) reduces the chance of a00→01transition (and DSC) by reducing the expected descendants from paraclade members. Similarly, increasing net speciation rates for species with10(model 2) elevates the probability of a10→11transition (and HSC) by elevating the expected descendants of the species with 10. Finally, increasing the number of evolvable characters for the subclade diagnosed by10(model 3) introduces a suite of characters for which 10→11(and HSC) is the only probable transition. Thus, all three models elevate expected HSC.
Models 1–3 make unique predictions about correlations be- tween HSC and different paleontological patterns. Elevated net extinction and elevated net speciation (models 1 and 2) make dis- tinct predictions about stratigraphic distributions of species within paraclades and whole clades, respectively. Elevated net extinction (model 1) predicts that the pooled stratigraphic distributions of species retaining primitive conditions should have lower centers of gravity than other models predict (32, 33). Elevated net speciation (model 2) predicts that the pooled stratigraphic distributions for the clade should have a higher center of gravity than other models predict.
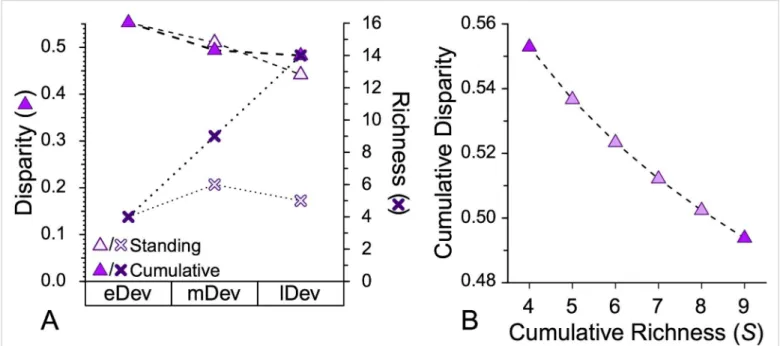
Elevated evolvability (model 3) makes unique predictions re- garding morphological diversity (disparity) relative to models 1 and 2. If fewer characters can change among early species than some derived species, then the disparity among allS/2 early species will be lower than expected given the total character space and likely rates of change (34, 35). These predictions apply to cumu- lative disparity (i.e., disparity among allS/2 species) rather than standing disparity (i.e., species extant halfway through a clade’s history), because extinction often greatly affects standing disparity (36) (Materials and MethodsandSI Appendix, Fig. S5).
We apply stratigraphic compatibility, center of gravity, and cumulative disparity analyses to 319 published character matrices of fossil species and genera to ask three questions. (i) Are pat- terns consistent with trait-based diversification shifts truly com- mon among fossil taxa at low taxonomic levels? (ii) Do these patterns vary among taxonomic groups and/or over time? (iii) Is there any general association with the expectations of elevated net extinction, elevated net speciation, or elevated evolvability?
Results
Excess HSC. HSC exceeds expectations of trait-independent di- versification in the vast majority of the clades (Fig. 1, Table 1, and SI Appendix, Table S3, results under alternative models).
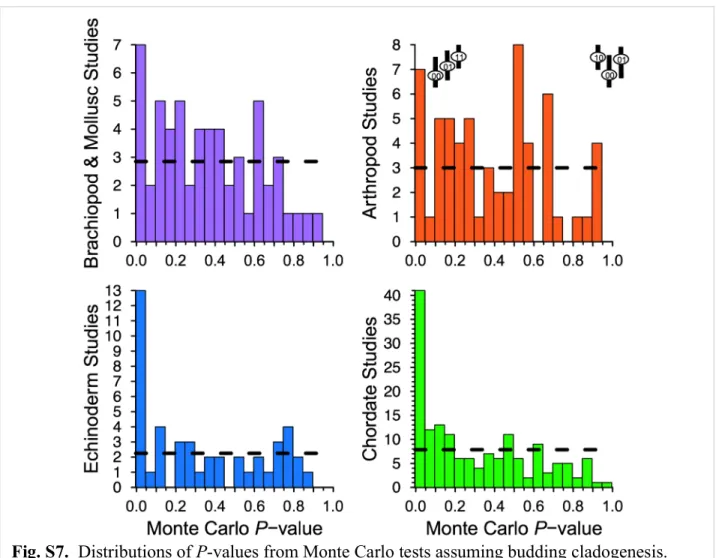
Only arthropods fail to have significantly more than 50% of clades with excess HSC. Major deviations are particularly com- mon: 37–53% of clades show excess HSC deviations that 25% or fewer clades should show; 12–29% of clades show deviations that only 5% or fewer clades should show (Table 1 andSI Appendix, Fig. S7).
Temporally, only Cambrian clades fit null expectations (Fig.
2); excess HSC is common thereafter, with only the Carbonif- erous failing to show excess HSC in significantly more than 50%
is significant atP≤0.05.
Associations Between Excess HSC and Other Evolutionary Patterns.
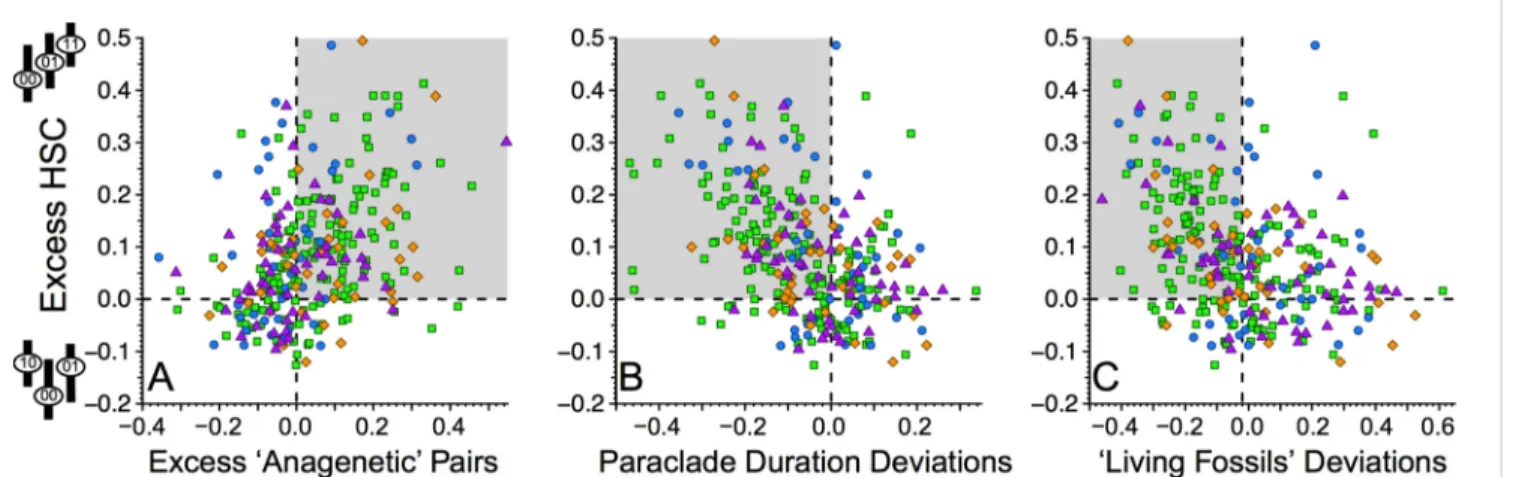
Clades with excess HSC typically have lower centers of gravity for paraclades retaining 00 pairs than expected given trait- independent diversification and origination, extinction, sam- pling, and character change parameters appropriate to each clade (Materials and Methods). This association (Fig. 3A) is highly significant for all clades (Kendall’sτ=−0.329,P=1.7×10⁻¹⁸) and among brachiopod and mollusc, arthropod, echinoderm, and chordate clades separately (Table 2). The associations also are significant for Ordovician-Permian and Meso-Cenozoic clades but not Cambrian clades (Table 2). Excess HSC is also associated with whole clades having lower than expected centers of gravity.
This association is much weaker than the HSC–paraclade asso- ciation, and it is significant only among chordate and Meso- Cenozoic clades (Table 2). Finally, no significant associations exist between excess HSC and deviations from expected cumu- lative disparity (Table 2).
Discussion
Our results strongly corroborate elevated net extinction (model 1), strongly contradict elevated net speciation (model 2), and are unsupportive of elevated evolvability (model 3). Before discussing the implications of these models in additional detail, we will first consider whether very different models might explain our results.
Alternative Explanations for Excess HSC.We should sample 95% of state pairs for compatible characters in correct order, regardless
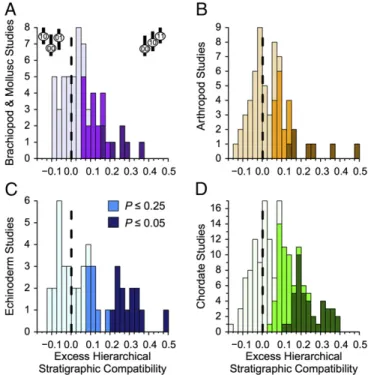
Fig. 1. Deviations between observed and expected HSC for fossil (A) bra- chiopods and molluscs; (B) arthropods; (C) echinoderms; and (D) chordates.
Positive numbers mean that00→10→11(upper right cartoon inA) sequences exceed Monte Carlo-generated expectations assuming continuous trait-in- dependent diversification with empirically estimated origination, extinction, and sampling rates and simulated character evolution matching observed compatibility for each dataset. Negative numbers mean that10←00→01 sequences (upper left cartoon inA) exceed those same expectations. Shades correspond to the significance of the deviations.
16420 | www.pnas.org/cgi/doi/10.1073/pnas.1406304111 Wagner and Estabrook
of average per-taxon sampling rates (SI Appendix, Fig. S5).
However, if species with derived states have vastly higher sam- pling rates than species with primitive states, then we could sample more state pairs out of order. We consider this an unlikely explanation for two reasons. First, such changes in preservation potential should be as apt to convert HSC to DSC as DSC to HSC. Second, it is an improbable explanation on first principles:
traits, such as basic skeletal mineralogy or environmental prefer- ence, that greatly alter preservation potential rarely vary among closely related species and genera (37, 38). Instead, the vast ma- jority of character states are variations on features with very similar preservation potentials (e.g., shapes on some region of bone or calcitic shell).
Our Monte Carlo tests use diversification models that maximize expected HSC. However, pervasive anagenesis is a very different model that also will generate copious HSC. If all species in a given dataset are morphospecies from a single anagenetically evolving lineage, then only HSC can be common: a 00→10 transition eliminates the sole (morpho-) species bearing00. A00→01tran- sition requires that the lineage first revert back to00. Anagenesis also predicts that HSC is anagenetic: species with00do not occur in younger strata than the first species with10. Anagenetic HSC is much more frequent than predicted by trait-independent di- versification (SI Appendix, Fig. S8A). However, very few datasets analyzed here are good candidates for being anagenetic lineages.
Most datasets include numerous clearly contemporaneous species,
and reconstructed phylogenies typically imply numerous subclades within each clade. Notably, trait-independent diversification under bifurcation models that mix anagenesis and cladogenesis predicts less HSC than it does under budding models with only clado- genesis (SI Appendix, Fig. S5). Our Monte Carlo tests assume the budding model. As such, assuming no anagenesis makes our results conservative (SI Appendix, Fig. S9 and Table S3).
An evolutionary explanation for reduced durations of para- clades relative to expected paraclade durations is that turnover rates decrease over time within clades. If this happens within individual clades that we analyze, then early paraclades should have shorter durations than expected given our null model. This pattern is well-documented for the Phanerozoic as a whole (39).
However, stage-to-stage variation in turnover is considerable for both metazoans (39) and larger taxonomic groups (e.g., gastro- pods or mammals) (40–42), which means that turnover actually varies considerably over the timespans covered by the datasets that we analyze. Moreover, individual clades often have early origination rates that are much higher than extinction rates (3, 41–44), which elevates DSC rather than HSC (SI Appendix, Fig. S5D).
Paleontologists choose species and genera for phylogenetic analyses to address particular issues, which might, in turn, bias our results. For example, workers compile many phylogenetic datasets to examine biogeographic patterns (45–47). However, biogeographic differentiation should encourage the subclade di- vergence and thus, should generate more DSC than null models.
Other phylogenetic datasets deliberately target the oldest mem- bers of clades to unravel subclade relationships because of a con- cern that homoplasy among late-appearing members of subclades will confound relationships among those subclades (48–50). De- liberately targeting early members of subclades should elevate DSC. Finally, high diversification rates early in clade history also would elevate DSC (see above).
Many of the clades that we analyze actually are paraclades within larger clades. Paraclades do not affect the implications of our results. Suppose that Eocene species show high HSC and corre- spondingly low centers of gravity among paraclades with primi- tive states. The implied relationship between primitive states and elevated net extinction in the Eocene follows if the clade went ex- tinct at the end of the Eocene or if the clade includes unanalyzed Oligocene species. Alternatively, a group might be paraphyletic relative to a contemporaneous taxon that is so different that workers have not analyzed them together. Again, subsequent evolution has no bearing on the history of character states within the paraphyletic group; moreover, if the daughter taxon is that different from its ancestors, then there probably are few character states that can be coded easily in both groups to reveal DSC. Fi- nally, our finding that paraclades with primitive states have un- usually low centers of gravity is not an artifact of paraphyly. We report the difference between expected metrics given trait- independent diversification and observed metrics; regardless of whether expected centers of gravity for paraclades are low or high (33), we find that the observed centers of gravity are too low.
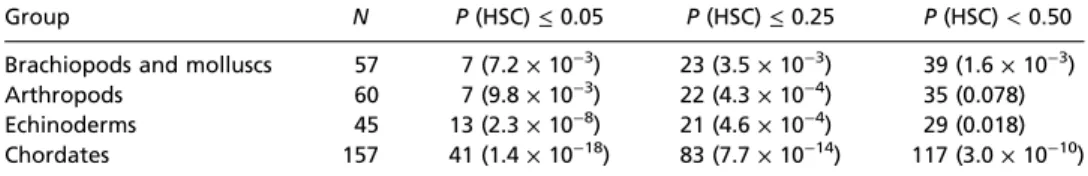
Group N P(HSC)≤0.05 P(HSC)≤0.25 P(HSC)<0.50
Brachiopods and molluscs 57 7 (7.2×10⁻³) 23 (3.5×10⁻³) 39 (1.6×10⁻³) Arthropods 60 7 (9.8×10⁻³) 22 (4.3×10⁻⁴) 35 (0.078) Echinoderms 45 13 (2.3×10⁻⁸) 21 (4.6×10⁻⁴) 29 (0.018) Chordates 157 41 (1.4×10⁻¹⁸) 83 (7.7×10⁻¹⁴) 117 (3.0×10⁻¹⁰)
Cases from each major group showing different levels of significance for excess HSC (measured as the proportion of Monte Carlo runs with equal or greater HSC). All cases withP≤0.05 are also counted asP≤0.25 andP<0.50. Numbers in parentheses give binomial probabilities of these outcomes given expectations of 5%, 25%, and 50% of datasets. Fig. 1 describes the test.
Fig. 2. Deviations between observed and expected HSC over time given budding cladogenesis. Colors denote higher taxonomic group like in Fig. 1.
Binomial probabilities of deviations from an expectation of 50% excess HSC are Cambrian (Cm):P=0.584 (11 of 22); Ordovician (O):P=0.049 (32 of 53);
Silurian (S):P=0.025 (12 of 17); Devonian (D):P=9.6×10⁻⁵(25 of 31);
Carboniferous (C):P=0.072 (11 of 17); Permian (P):P=0.018 (11 of 15);
Triassic (Tr):P=5.3×10⁻³(17 of 23); Jurassic (J):P=0.026 (18 of 27); Cre- taceous (K):P=1.1×10⁻⁴(36 of 48); Paleogene (Pg):P=2.9×10⁻⁵(39 of 51); and Neogene (Ng):P=2.9×10⁻⁵(12 of 15).
Wagner and Estabrook PNAS | November 18, 2014 | vol. 111 | no. 46 | 16421
EVOLUTIONEARTH,ATMOSPHERIC, ANDPLANETARYSCIENCES
General Models of Elevated Net Extinction.We conclude that ele- vated net extinction of paraclades retaining primitive conditions (model 1) drives most trait-based diversification shifts at low taxonomic levels. Paleontologists have proposed several explan- ations for elevated net extinction, including competition (43, 51, 52) and biased survivorship over extinction pulses (53). Compe- tition models, such as coupled logistic diversification, are partic- ularly appealing, because they offer mechanisms for actively elim- inating paraclades while not necessarily greatly increasing the overall diversity of a clade (1, 43, 52). Competition also predicts the elevated anagenetic HSC discussed above by linking elevated net extinction to the appearance of derived species (SI Appendix, Fig. S12). Competition with members of other clades could have the same effect (with or without logistic diversification) if it induces new states through mechanisms, such character dis- placement (54), in some lineages while elevating net extinc- tion in paraclades. Under either case, elevated net extinction might reflect decreased origination rates rather than increased extinction rates among lineages within paraclades (32).
Extinction resistance/selectivity favoring some derived taxa (24, 53) is another plausible model. Although few of the datasets examined here span mass extinctions, many of them span extinc- tion pulses (55). Like competition models, extinction resistance for a derived subclade predicts lower centers of gravity for many par- aclades than expected without selective extinction pulses. How- ever, extinction resistance/selectivity does not predict unusually high anagenetic HSC: The mechanism for paraclade extinction does not coincide with the appearance of derived traits. Moreover, we have empirical examples of extinction resistance associated with primitive traits (23, 56) as well as many cases in which there is no obvious selectivity at all (57). These considerations make extinction resistance/selectivity a less reliable and less powerful explanation; however, we cannot discount it entirely.
On the Viability of the Elevated Evolvability and Elevated Net Cladogenesis Models.Our results do not support the idea that ele- vated evolvability (model 3) drives trait-based diversification shifts.
The vast majority of clades showing excess HSC shows more dis- parity among early species than expected rather than less disparity.
High early disparity corroborates the idea that clades rapidly exhaust available character states (34, 58). It also raises the pos- sibly that evolvability is greatest early in clade history (25). If so, then pooling datasets to examine (say) the Carnivora as a whole might reveal associations between elevated evolvability and the founding of major clades that do not exist with the families and subfamilies examined here (16, 59).
Our results flatly contradict the idea that elevated net speciation (model 2) drives trait-based diversification shifts. The associations between clade centers of gravity and HSC actually are opposite of the model’s predictions. A corollary prediction (i.e., that major taxonomic groups with many examples of excess HSC should show rising net origination rates over time) is also incorrect.
Most Cenozoic mammal clades show excess HSC (SI Appendix, Fig. S11B) without any trend in net origination rates (42). Even more damning, most Silurian-Carboniferous trilobite clades show excess HSC (SI Appendix, Fig. S11A) while showing decreasing net origination rates (40). Thus, our results are another caution that the common inference of elevated net speciation from phy- logenies of extant taxa is an artifact of those trees being unable to support elevated net extinction models (18–21, 60).
Why Is the Cambrian Different?Cambrian clades alone show neither pervasive excess HSC nor a correlation between excess HSC and low centers of gravity for paraclades. This evidence of (relatively) high divergence might reflect the radiation of clades into new ecospace, allowing for unusually high numbers of subclades to diversify (61, 62), which in turn, might generate enough DSC to cancel out excess HSC within subclades. However, major radia- tions in the Ordovician, Triassic, and Paleogene contradict this
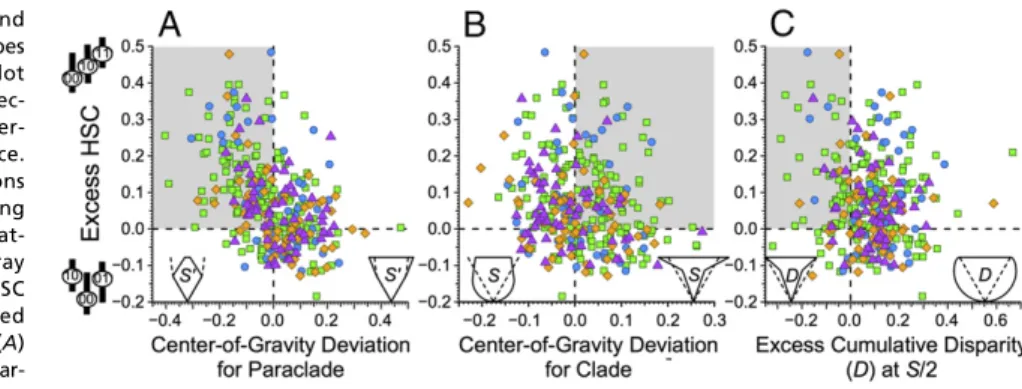
tation given continuous trait-independent diver- sification and no change of character space.
Cartoons on thexaxis idealize those deviations from the null model, with dashed lines giving expectations and solid lines giving possible pat- terns (D, cumulative disparity;S, richness). Gray boxes reflect predicted associations with HSC given (A) elevated net extinction, (B) elevated net speciation, and (C) elevated evolvability. (A) Observed minus expected centers of gravity for par- aclades retaining00combinations (where0denotes
the oldest appearing state). (B) Observed minus expected centers of gravity for whole clades. (C) Excess cumulative disparity among the first S/2 taxa in a clade ofStaxa. Additional information is in Figs. 1 and 2.
Table 2. Associations between excess HSC and other paleontological patterns
Group
Paraclade CG Clade CG CD atS/2
τ P τ P τ P
Brachiopods and molluscs −0.234 0.010 −0.135 0.139 −0.068 0.453
Arthropods −0.307 5.2×10⁻⁴ −0.077 0.386 −0.047 0.592
Echinoderms −0.274 8.0×10⁻³ −0.151 0.145 −0.028 0.784
Chordates −0.367 8.7×10⁻¹² −0.161 2.8×10⁻³ −0.048 0.373
Cambrian −0.074 0.631 −0.017 0.910 0.052 0.735
Paleozoic −0.236 6.2×10⁻⁵ −0.064 0.277 −0.025 0.666
Meso-Cenozoic −0.398 4.6×10⁻¹⁴ −0.175 9.3×10⁻⁴ −0.058 0.269 Associations between excess HSC and deviations from expected paraclade and clade centers of gravity (CGs) and cumulative disparity (CD) halfway through clade history (S/2) broken down by taxonomic group and time.
τgives Kendall’s rank correlation statistic.
16422 | www.pnas.org/cgi/doi/10.1073/pnas.1406304111 Wagner and Estabrook
Nearly all Cambrian datasets represent trilobites. Thus, the Cambrian pattern might corroborate the biomere model (56), which posits that trilobites retaining primitive states selectively survived extinction pulses in the Cambrian. Such extinction would offset background loss of taxa retaining primitive states (63). Notably, post-Cambrian trilobites (and particularly, Silurian- Carboniferous trilobites) show HSC patterns comparable with other metazoans (SI Appendix, Fig. S10 and Table S4). Moreover, arthropods show a significant association between excess HSC and overly low paraclade centers of gravity, although 50 of 60 clades are trilobites (Table 2). Assessing whether this reflects something different about Cambrian trilobites or the Cambrian as a whole requires data from Cambrian molluscs, echinoderms, etc. Never- theless, it does suggest yet another way in which Cambrian evo- lution was unique.
Conclusions
After the Cambrian, HSC among closely related species and genera greatly exceeds the expectations of trait-independent di- versification. Our finding indicates that trait-based diversification shifts are common at low taxonomic levels. The pattern corre- sponds with paraphyletic groups retaining primitive conditions losing diversity faster than predicted by trait-independent di- versification. Thus, elevated net extinction seems to be the primary driver of trait-based diversity shifts. Our results strongly contradict the idea that elevated net speciation within derived subclades is common, although elevated net speciation is a conclusion of many studies using phylogenies of extant species. Increased evolvability among anatomical characters also does not explain diversification shifts, although elevated evolvability might be important for the founding of the analyzed taxa. Future work should focus on assessing why we do not see clear signs of trait-based di- versification shifts among Cambrian taxa and means of recog- nizing elevated net extinction among taxa lacking fossil records.
Materials and Methods
Datasets.We analyze 319 published character matrices, all of which were assembled for phylogenetic analyses (SI Appendix, Tables S5 and S6). We focus on species- and genus-level datasets, because (i) we are interested in whether patterns associated with trait-based diversification shifts occur at low taxonomic levels, (ii) species- and genus-level analyzes minimize the potential for uneven species richness among taxa hiding evidence of di- vergence, and (iii) using species and genera instead of (say) families mini- mizes cases where characters used to diagnose a taxon are absent in the oldest known members of that taxon. We made exceptions for studies fo- cusing on early members of clades that include token members of groups that diversify after the study interval of the dataset (e.g., late Eocene repre- sentatives of subfamilies that diversify in the Oligocene are included in an analysis of Eocene species). We also exclude outgroup taxa, because out- groups usually represent a small fraction of the richness in a related clade. The vast majority of our datasets lacks any extant species or genera; however, any extant taxa in a dataset are included only if they have fossil representatives.
We set polymorphic characters to states that maximized their stratigraphic compatibility. In studies including extant species, we exclude any characters not coded for extinct taxa on the assumption that they are not fossilizable characters. We also exclude characters that are invariant within the ingroup.
We derive first and last appearance data from several sources, with the original publications and the Paleobiology Database (paleobiodb.org/) being the two biggest sources. Stratigraphic ranges for extant taxa reflect the first and last fossil occurrences rather than assuming that those taxa survive to the present.
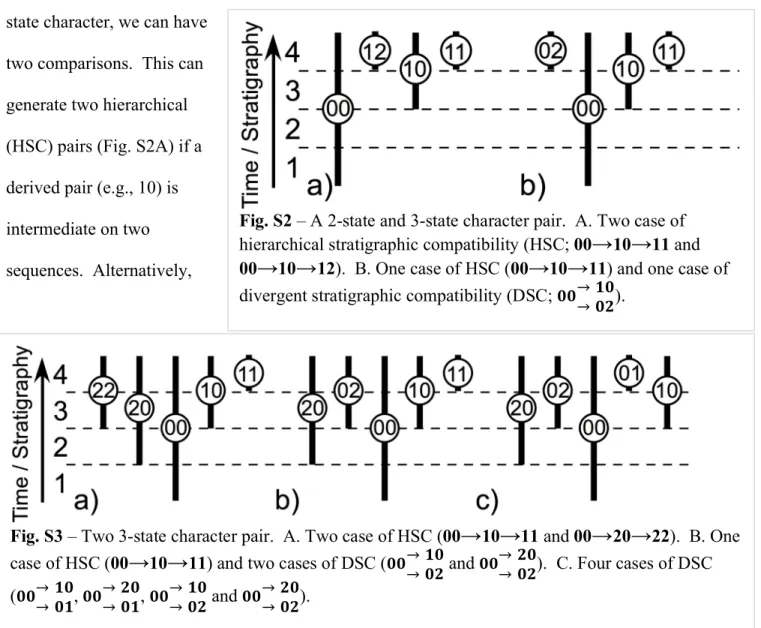
Metrics. Our analyses measure compatibility, stratigraphic compatibility, center of gravity, and morphological disparity. Compatible characters have three of four possible combinations if the characters are binary (26, 27); if one or both characters have three or more states, then we first assess whether the pair is compatible (SI Appendix, Fig. S1), and then, we tally all binary breakdowns of the two characters with three of four possible pairs (SI Ap- pendix, Figs. S2 and S3) (note that inapplicable and unknown conditions always are excluded from combinations). Our approach therefore treats all multistate characters as unordered, which maximizes their compatibility (27)
states in which species with the intermediate pair (e.g.,00given00,10, and 01) do not appear last in the fossil record (28). (Note that0represents the first appearing state, regardless of whether those states were coded 0 in the real data.) We tally hierarchical and DSC as described in the text; in cases where species with00and10first appear in the oldest strata before species with11, it is not clear which state for the first character appears first, and the data are consistent with both HSC and DSC. We tally such cases as one- half HSC and one-half DSC. We then use the proportion of stratigraphically compatible pairs that are HSC for comparison with Monte Carlo expectations (see below).
We calculate center of gravity following several prior studies (32, 33) using the stratigraphic ranges of the taxa in the dataset. We did this first for the entire clade (total clade center of gravity). For the average paraclade center of gravity within each clade, we took every HSC pair and then measured the center of gravity for the assemblage of taxa retaining the00condition (with 0representing the oldest appearing states, regardless of the actual number used in the dataset). We then estimated the average center of gravity of those paraclades. (If a character pair is one-half HSC because of two states appearing in the oldest strata, then the pair is given half-weight; see above.) This average was then rescaled to the total clade center of gravity for comparisons with Monte Carlo expectations (see below).
We measure morphological disparity as the average pairwise dissimilarity among species [i.e., the differing characters between two taxa=characters coded for both taxa (64)]. We use cumulative disparity rather than standing disparity (i.e., the average pairwise dissimilarity among allStaxa in a dataset and the average pairwise dissimilarity among the oldest S/2 taxa in that dataset). In cases where clades passedS/2 taxa partway through a stratigraphic interval, we estimate the disparity atS/2 assuming a log-linear relationship between disparity and richness (35). Suppose that a dataset with 29 species has 10 species through time 3 and 20 species through time 4 and that the average pairwise dissimilarity among the first 10 species is 0.4, whereas the average pairwise dissimilarity among the first 20 species is 0.5. Species 15 represents the halfway point. The cumulative disparity among the first 15 species is 0:4+ðln½15−ln½10Þ×0:5−0:4=ðln½20−ln½10Þ=0:453 (SI Appendix, Fig. S6).
We rescaleðμ pairwise dissimilarity among S=2Þ=μ pairwise dissimilarity among Sfor comparison with Monte Carlo expectations (see below).
Monte Carlo Analyses.We use Monte Carlo analyses to estimate expected HSC, centers of gravity, and cumulative disparities. Unlike bootstrapping or per- mutation tests in similar analyses (25), Monte Carlo tests assume that some phylogeny underlies character and stratigraphic distributions. For each clade ofStaxa, 1,001 phylogenies are simulated using origination and extinction rates estimated from the stratigraphic ranges of the original data until Staxa are sampled given sampling rates estimated from the same strati- graphic data. Usually, origination, extinction, and sampling are empirically estimated based on the proportions of taxa known from one, two, three, etc. intervals (65). For datasets with taxa limited to one or two intervals, we used a preliminary set of simulations to find rates maximizing the proba- bility of observingS taxa overXintervals, withXbeing the number of intervals in the dataset. Origination and extinction rates are constant, which matches the null hypothesis. Also, continuous exponential diversification generates more HSC than alternative models, such as logistic diversification (SI Appendix, Fig. S5D). We simulated phylogenies under both budding cladogenesis (where species can have descendants as long as they persist) and bifurcating cladogenesis (where morphospecies disappear anageneti- cally on giving rise to two descendants) but present only the budding results, because budding promotes more HSC (and thus, more conservative results) than bifurcation by allowing single species to have three or more descend- ants instead of only two descendants (SI Appendix, Fig. S5). We simulate morphological evolution among the same numbers of characters and states as the original dataset. Change ceases when compatibility among simulated characters matches that of the original dataset (66) and thus, at a likely overall amount (SI Appendix, Fig. S4).
The Monte Carlo tests generate:
i) expected HSC given continuous, trait-independent diversification over phylogeny generated under plausible rates of origination, extinction, sampling, and change;
ii) expected paraclade and clade center of gravity given continuous, trait- independent diversification over phylogeny under plausible rates of origination, extinction, sampling, and change; and
iii) expected cumulative disparity atS/2 over phylogeny given plausible and consistent rates of change in a single character space.
Wagner and Estabrook PNAS | November 18, 2014 | vol. 111 | no. 46 | 16423
EVOLUTIONEARTH,ATMOSPHERIC, ANDPLANETARYSCIENCES
1. Lidgard S, McKinney FK, Taylor PD (1993) Competition, clade replacement, and a history of cyclostome and cheilostome bryozoan diversity.Paleobiology19(3):352–371.
2. Roy K (1996) The roles of mass extinction and biotic interaction in large-scale re- placements: A reexamination using the fossil record of stromboidean gastropods.
Paleobiology22(3):436–452.
3. Eble GJ (2000) Contrasting evolutionary flexibility in sister groups: Disparity and di- versity in Mesozoic atelostomate echinoids.Paleobiology26(1):56–79.
4. Lupia R, Lidgard S, Crane PR (1999) Comparing palynological abundance and diversity:
Implications for biotic replacement during the Cretaceous angiosperm radiation.
Paleobiology25(3):305–340.
5. Sanderson MJ, Donoghue MJ (1994) Shifts in diversification rate with the origin of angiosperms.Science264(5165):1590–1593.
6. Purvis A, Nee S, Harvey PH (1995) Macroevolutionary inferences from primate phy- logeny.Proc Biol Sci260(1359):329–333.
7. Alfaro ME, et al. (2009) Nine exceptional radiations plus high turnover explain species diversity in jawed vertebrates.Proc Natl Acad Sci USA106(32):13410–13414.
8. Foote M (1993) Contributions of individual taxa to overall morphological disparity.
Paleobiology19(4):403–419.
9. Stockmeyer Lofgren A, Plotnick RE, Wagner PJ (2003) Morphological diversity of Carboniferous arthropods and insights on disparity patterns of the Phanerozoic.Pa- leobiology29(3):350–369.
10. Wagner PJ, Ruta M, Coates MI (2006) Evolutionary patterns in early tetrapods. II. Dif- fering constraints on available character space among clades.Proc Biol Sci273(1598):
2113–2118.
11. Stanley SM (1975) A theory of evolution above the species level.Proc Natl Acad Sci USA72(2):646–650.
12. Rosenzweig ML, McCord RD (1991) Incumbent replacement: Evidence for long-term evolutionary progress.Paleobiology17(3):202–213.
13. Slowinski JB, Guyer C (1993) Testing whether certain traits have caused amplified diversification: An improved method based on a model of random speciation and extinction.Am Nat142(6):1019–1024.
14. Maddison WP, Midford PE, Otto SP (2007) Estimating a binary character’s effect on speciation and extinction.Syst Biol56(5):701–710.
15. Wagner GP, Altenberg L (1996) Complex adaptations and the evolution of evolv- ability.Evolution50(3):967–976.
16. Rabosky DL, et al. (2013) Rates of speciation and morphological evolution are cor- related across the largest vertebrate radiation.Nat Commun4:1958.
17. Simpson C (2010) Species selection and driven mechanisms jointly generate a large- scale morphological trend in monobathrid crinoids.Paleobiology36(3):481–496.
18. Quental TB, Marshall CR (2009) Extinction during evolutionary radiations: Reconciling the fossil record with molecular phylogenies.Evolution63(12):3158–3167.
19. Rabosky DL (2010) Extinction rates should not be estimated from molecular phylog- enies.Evolution64(6):1816–1824.
20. Freckleton RP, Phillimore AB, Pagel M (2008) Relating traits to diversification: A simple test.Am Nat172(1):102–115.
21. Liow LH, Quental TB, Marshall CR (2010) When can decreasing diversification rates be detected with molecular phylogenies and the fossil record?Syst Biol59(6):646–659.
22. Wagner PJ (2000) The quality of the fossil record and the accuracy of phylogenetic inferences about sampling and diversity.Syst Biol49(1):65–86.
23. Liow LH (2004) A test of Simpson’s“rule of the survival of the relatively unspecialized”
using fossil crinoids.Am Nat164(4):431–443.
24. Liow LH (2006) Do deviants live longer? Morphology and longevity in trachyleberidid ostracodes.Paleobiology32(1):55–69.
25. Hughes M, Gerber S, Wills MA (2013) Clades reach highest morphological disparity early in their evolution.Proc Natl Acad Sci USA110(34):13875–13879.
26. Le Quesne WJ (1969) A method of selection of characters in numerical taxonomy.Syst Zool18(2):201–205.
27. Estabrook GF, Johnson CS, Jr, McMorris FR (1975) An idealized concept of the true cladistic character.Math Biosci23(2):263–272.
28. Estabrook GF, McMorris FR (2006) The compatibility of stratigraphic and comparative constraints on estimates of ancestor–descendant relations.Syst Biodivers4(2):9–17.
29. O’Keefe FR, Wagner PJ (2001) Inferring and testing hypotheses of correlated char- acter evolution using character compatibility.Syst Biol50(5):657–675.
30. Raup DM (1985) Mathematical models of cladogenesis.Paleobiology11(1):42–52.
31. Estabrook GF (1977) Does common equal primitive?Syst Bot2(1):16–42.
32. Gilinsky NL, Bambach RK (1987) Asymmetrical patterns of origination and extinction in higher taxa.Paleobiology13(4):427–445.
33. Uhen MD (1996) An evaluation of clade-shape statistics using simulations and extinct families of mammals.Paleobiology22(1):8–22.
34. Foote M (1995) Morphological diversification of Paleozoic crinoids.Paleobiology 21(3):273–299.
35. Foote M (1996) Models of morphologic diversification.Evolutionary Paleobiology:
Essays in Honor of James W Valentine, eds Jablonski D, Erwin DH, Lipps JH (Univ of Chicago Press, Chicago), pp 62–86.
36. Foote M (1993) Discordance and concordance between morphological and taxonomic diversity.Paleobiology19(2):185–204.
37. Jablonski D, Sepkoski JJ, Jr, Bottjer DJ, Sheehan PM (1983) Onshore-offshore patterns in the evolution of phanerozoic shelf communities.Science222(4628):1123–1125.
38. Bottjer DJ, Jablonski D (1988) Paleoenvironmental patterns in the evolution of post- Paleozoic benthic marine invertebrates.Palaios3(6):540–560.
39. Alroy J (2008) Colloquium paper: Dynamics of origination and extinction in the ma- rine fossil record.Proc Natl Acad Sci USA105(Suppl 1):11536–11542.
40. Webster M (2007) A Cambrian peak in morphological variation within trilobite spe- cies.Science317(5837):499–502.
41. Wagner PJ (1995) Diversification among early Paleozoic gastropods - contrasting taxonomic and phylogenetic descriptions.Paleobiology21(4):410–439.
42. Alroy J (1996) Constant extinction, constrained diversification, and uncoordinated stasis in North American mammals.Palaeogeogr Palaeoclimatol Palaeoecol127(1/4):
285–311.
43. Miller AI, Sepkoski JJ, Jr (1988) Modeling bivalve diversification: The effect of in- teraction on a macroevolutionary system.Paleobiology14(4):364–369.
44. Brayard A, et al. (2009) Good genes and good luck: Ammonoid diversity and the end- Permian mass extinction.Science325(5944):1118–1121.
45. Lieberman BS (1993) Systematics and biogeography of the“Metacryphaeusgroup”
Calmoniidae (Trilobita, Devonian), with comments on adaptive radiations and the geological history of the Malvinokaffric Realm.J Paleontol67(4):549–570.
46. Rode AL, Lieberman BS (2002) Phylogenetic and biogeographic analysis of Devonian phyllocarid crustaceans.J Paleontol76(2):271–286.
47. Mihlbachler MC (2008) Species taxonomy, phylogeny, and biogeography of the Brontotheriidae (Mammalia: Perissodactyla).Bull Am Mus Nat Hist311(1):1–475.
48. Froehlich DJ (1999) Phylogenetic systematics of basal perissodactyls.J Vertebr Paleontol 19(1):140–159.
49. Smith AB (2001) Probing the cassiduloid origins of clypeasteroid echinoids using stratigraphically restricted parsimony analysis.Paleobiology27(2):392–404.
50. Wesley-Hunt GD, Flynn JJ (2005) Phylogeny of the Carnivora: Basal relationships among the carnivoramorphans, and assessment of the position of“Miacoidea”rel- ative to crown-clade Carnivora.J Syst Palaeontol3(1):1–28.
51. Stanley SM (1979)Macroevolution: Pattern and Process(Elsevier, Amsterdam).
52. Sepkoski JJ, Jr, McKinney FK, Lidgard S (2000) Competitive displacement among post- Paleozoic cyclostome and cheilostome bryozoans.Paleobiology26(1):7–18.
53. Benton MJ (1996) On the nonprevalence of competitive displacement in the evolution of tetrapods.Evolutionary Paleobiology: Essays in Honor of James W Valentine, eds Jablonski D, Erwin DH, Lipps JH (Univ of Chicago Press, Chicago), pp 185–210.
54. Schluter D (2000) Ecological character displacement in adaptive radiation.Am Nat 156(Suppl):S4–S16.
55. Foote M (2005) Pulsed origination and extinction in the marine realm.Paleobiology 31(1):6–20.
56. Palmer AR (1965) Biomere: A new kind of biostratigraphic unit.J Paleontol39(1):
149–153.
57. Bapst DW, Bullock PC, Melchin MJ, Sheets HD, Mitchell CE (2012) Graptoloid diversity and disparity became decoupled during the Ordovician mass extinction.Proc Natl Acad Sci USA109(9):3428–3433.
58. Wagner PJ (2000) Exhaustion of morphologic character states among fossil taxa.
Evolution54(2):365–386.
59. Erwin DH (2007) Disparity: Morphological pattern and developmental context.Pa- laeontology50(1):57–73.
60. Quental TB, Marshall CR (2011) The molecular phylogenetic signature of clades in decline.PLoS ONE6(10):e25780.
61. Foote M (1996) Ecological controls on the evolutionary recovery of Post-Paleozoic crinoids.Science274(5292):1492–1495.
62. Erwin DH (2012) Novelties that change carrying capacity.J Exp Zoolog B Mol Dev Evol 318(6):460–465.
63. Jablonski D (1986) Background and mass extinctions: The alternation of macroevo- lutionary regimes.Science231(4734):129–133.
64. Foote M (1992) Paleozoic record of morphologica diversity in blastozoan echino- derms.Proc Natl Acad Sci USA89(16):7325–7329.
65. Foote M, Raup DM (1996) Fossil preservation and the stratigraphic ranges of taxa.
Paleobiology22(2):121–140.
66. Wagner PJ (2012) Modelling rate distributions using character compatibility: Im- plications for morphological evolution among fossil invertebrates.Biol Lett8(1):
143–146.
16424 | www.pnas.org/cgi/doi/10.1073/pnas.1406304111 Wagner and Estabrook
Trait-based extinction catches the Red Queen napping during the Cambrian
P. David Polly1
Department of Geological Sciences, Indiana University, Bloomington, IN 47405
The tenuous balance between speciation and extinction governs the rise and fall of di- versity within clades, from which have emerged the sweeping changes in Earth’s standing biodiversity since life’s origin (1, 2). In a clade where speciation and extinction are equally likely, net diversity remains con- stant; when the rate of speciation exceeds extinction, diversity increases exponentially;
and when the chance of extinction outweighs speciation, then diversity falls, resulting ulti- mately in the demise of the clade. Metazoan life diversified rapidly in the Cambrian and Ordovician periods (542–443 Mya), after which short-term extinction events and bursts of radiation overshadowed long-term increases in diversity (3, 4). This pattern sug- gests that rates of speciation exceeded extinc- tion during the first phase of metazoan diversification, after which the balance shifted back and forth. A long-standing question is whether clades that have successfully diversi- fied have done so by evolving new traits that confer an advantage allowing them to out- perform or outcompete other groups, either by winning battles in evolutionary arms races
or otherwise adapting faster than the Red Queen’s pace of constant extinction expected in resource-limited environments (5, 6). In PNAS, Wagner and Estabrook (7) ask whether diversification was associated with the evolution of new traits and, if so, did the probability of speciation go up in clades that have the new trait, did the group’s rate of trait evolution go up, did extinction go up in the clades that do not have the trait, or some combination of these. They analyzed 319 trait datasets from metazoan phyla with good fos- sil records—arthropods, brachiopods, mol- luscs, echinoderms, and chordates—sampled from the early radiation in the Cambrian to the present day. They found that diversifica- tion was linked to trait evolution in all post- Cambrian clades, but not in the earliest trilo- bites, and that it was linked to an increase in extinction among the clades that did not evolve new traits.
The analytical challenges for determining whether traits are related to diversification across 319 extinct clades are enormous.
Tackled directly, the problem requires iden- tifying the phylogenetic node at which a trait
changes, estimating the rates of speciation and extinction inside and outside that node, and repeating the exercise for all traits (8).
The number of candidate trait changes in even one clade is large, 275 in the early tet- rapod dataset alone (9). Furthermore, flaws in the phylogeny can lead to misinterpreta- tions about the link between diversification and traits, and phylogenetic analyzes of ex- tinct metazoan taxa are sparse compared with their immense Phanerozoic diversity.
To meet these challenges, the authors approached the problem indirectly by look- ing at the sequence of trait combinations in temporal series of fossil taxa and the times when clades reached their peak diversity.
Wagner and Estabrook used the concept of character compatibility (10) to simplify their analyses and to avoid relying too heavily on the topologies of potentially erroneous phy- logenetic trees. Compatibility analysis was de- veloped in the late 1960s and 1970s as part of the explosion of interest in computerized phylogenetic analysis. Estabrook, who died in 2011, was one of the major contributors to the theory, methods, and algorithms used to identify compatible characters and the so- called“convex”groups that share them (10–
12). Compatible characters are best under- stood as those character combinations that do not logically require homoplasy to explain them. Most approaches to phylogenetics test homoplasy (the independent evolution of a trait in two or more taxa) in the context of a specific tree topology. If a character change occurs only once on a tree, it is a uniquely derived synapomorphy, but if it changes more than once it is a homoplasy.
Phylogenetic algorithms typically search tree space for the topology that minimizes the number of homoplasies using one criterion or another (13). Parsimony, for example, finds the topology that strictly minimizes ho- moplasy and maximizes synapomorphy (14) and maximum likelihood finds the topology that maximizes the probability of the charac- ter distributions taking into account that if 00
01 10 11 00 10 10 11 A B C D
Compatible Incompatible
A B C D
1: 0 1 2: 0 1
A B C D
1: 0 1 2: 0 1 2: 1 0 C
2: 0 1
A
Oldest Youngest
00 10 11
00 10 01
00 10 11
HSC DSC Incomp-
atible
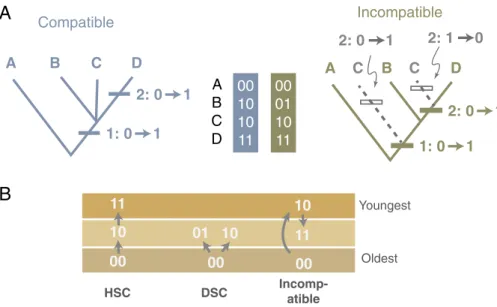
B
Fig. 1. (A) Character transitions on a phylogeny of compatible (Left) and incompatible (Right) sets of character combinations in four taxa. (B) Transitions in stratigraphically arranged character pairs.
Author contributions: P.D.P. wrote the paper.
The author declares no conflict of interest.
See companion article on page 16419.
1Email: [email protected].
16240–16241 | PNAS | November 18, 2014 | vol. 111 | no. 46 www.pnas.org/cgi/doi/10.1073/pnas.1419138111