A Chronology of
Middle Missouri Plains Village Sites
By Craig M. Johnson
with contributions by
Stanley A. Ahler, Herbert Haas, and Georges Bonani
Smithsonian Institution Scholarly Press
Smithsonian Institution Scholarly Press
s m i t h s o n i a n c o n t r i b u t i o n s t o b o t a n y • n u m b e r 9 5
Ecology of the Podocarpaceae in
Tropical Forests
Edited by
Benjamin L. Turner and
Lucas A. Cernusak
SerieS PublicationS of the SmithSonian inStitution Emphasis upon publication as a means of “diffusing knowledge” was expressed by the first Secretary of the Smithsonian. In his formal plan for the Institution, Joseph Henry outlined a program that included the following statement: “It is proposed to publish a series of reports, giving an account of the new discoveries in science, and of the changes made from year to year in all branches of knowledge.” This theme of basic research has been adhered to through the years by thousands of titles issued in series publications under the Smithsonian imprint, com- mencing with Smithsonian Contributions to Knowledge in 1848 and continuing with the following active series:
Smithsonian Contributions to Anthropology Smithsonian Contributions to Botany
Smithsonian Contributions to History and Technology Smithsonian Contributions to the Marine Sciences Smithsonian Contributions to Museum Conservation Smithsonian Contributions to Paleobiology
Smithsonian Contributions to Zoology
In these series, the Institution publishes small papers and full-scale monographs that report on the research and collections of its various museums and bureaus. The Smithsonian Contributions Series are distributed via mailing lists to libraries, universities, and similar institu- tions throughout the world.
Manuscripts submitted for series publication are received by the Smithsonian Institution Scholarly Press from authors with direct affilia- tion with the various Smithsonian museums or bureaus and are subject to peer review and review for compliance with manuscript preparation guidelines. General requirements for manuscript preparation are on the inside back cover of printed volumes. For detailed submissions require- ments and to review the “Manuscript Preparation and Style Guide for Authors,” visit the Submissions page at www.scholarlypress.si.edu.
s m i t h s o n i a n c o n t r i b u t i o n s t o b o t a n y • n u m b e r 9 5
Ecology of the
Podocarpaceae in Tropical Forests
Edited by
Benjamin L. Turner and Lucas A. Cernusak
washington d.c.
2011
ABSTRACT
Turner, Benjamin L., and Lucas A. Cernusak, editors. Ecology of the Podocarpaceae in Tropical Forests.
Smithsonian Contributions to Botany, number 95, viii + 207 pages, 70 figures, 18 tables, 2011.—The emergence of angiosperms in tropical forests at the expense of the gymnosperms, their ancestral relatives, was one of the most important events in the evolutionary history of terrestrial plants. Gymnosperms were nearly eliminated from the tropics after the evolution of angiosperms in the early Cretaceous, yet conifers of the Podocarpaceae are among the few gymnosperm families that persist in tropical forests worldwide.
Podocarps are often considered to be restricted to montane sites in the tropics, a feature of their biogeography that is used by paleo ecologists to reconstruct past forest communities. However, podocarps also occur in the lowland tropics, where they can be the dominant component of forest canopies. Podocarps have proved to be remarkably adaptable in many cases: members of the family have a semi-aquatic lifestyle, exhibit drought tolerance and resprouting, and include the only known parasitic gymnosperm. Other intriguing aspects of podocarp physiology include the mechanism of water transport in the leaves and the conspicuous root nodules, which are not involved in nitrogen fixation but instead house arbuscular mycorrhizal fungi. Perhaps most surprising, paleobotanical evidence indicates that far from being ‘relict’ members of tropical forest communities, podocarps have been dispersing into the tropics since the late Eocene epoch more than 30 million years ago. These and other aspects of the Podocarpaceae explored in this volume have far-reaching implications for understanding the ecology and evolution of tropical rain forests.
Cover images: Left, nodules and root hairs on Prumnopitys ferruginea (see chapter 11); center, seed- lings of Podocarpus guatemalensis growing in a shadehouse in Panama (see chapter 3); right, the semi- aquatic podocarp Retrophyllum minus growing in a stream in New Caledonia (see chapter 4). Photo credits, left to right: I. A. Dickie, A. W. Cheesman, and J. W. Dalling.
Published by SMITHSONIAN INSTITUTION SCHOLARLY PRESS P.O. Box 37012, MRC 957
Washington, D.C. 20013-7012 www.scholarlypress.si.edu
Text and images in this publication may be protected by copyright and other restrictions or owned by individuals and entities other than, and in addition to, the Smithsonian Institution. Fair use of copyrighted material includes the use of protected materials for personal, educational, or noncommercial purposes. Users must cite author and source of content, must not alter or modify content, and must comply with all other terms or restrictions that may be applicable. Users are responsible for securing permission from a rights holder for any other use.
Library of Congress Cataloging-in-Publication Data
Ecology of the podocarpaceae in tropical forests / Benjamin L. Turner and Lucas Cernusak, editors.
p. cm.—(Smithsonian contributions to botany ; no. 95) Includes bibliographical references and index.
1. Podocarpaceae. 2. Tropical plants. I. Turner, Benjamin L. II. Cernusak, Lucas. III. Series: Smithsonian contributions to botany ; no. 95.
QK494.5.P73P63 2011 585’.31734—dc22
2010042376
ISSN: 0081-024X (print); 1938-2812 (online)
The paper used in this publication meets the minimum requirements of the American National Standard for Perma- nence of Paper for Printed Library Materials Z39.48–1992.
Contents
PREFACE v
ACKNOWLEDGMENTS vii
SECTION I – EVOLUTIONARY HISTORY
1 Podocarp Evolution: A Molecular Phylogenetic Perspective 1
Edward Biffin, John G. Conran, and Andrew J. Lowe
2 Dispersal and Paleoecology of Tropical Podocarps 21
Robert J. Morley
SECTION II – DISTRIBUTION AND ECOLOGY OF TROPICAL PODOCARPS
3 Ecology and Distribution of Neotropical Podocarpaceae 43
James W. Dalling, Phoebe Barkan, Peter J. Bellingham, John R. Healey, and Edmund V. J. Tanner
4 Ecology and Distribution of the Malesian Podocarps 57
Neal J. Enright and Tanguy Jaffré
5 Podocarps in Africa: Temperate Zone Relicts or
Rainforest Survivors? 79
Hylton Adie and Michael J. Lawes
6 The Ecology of Podocarps in Tropical Montane Forests of Borneo: Distribution, Population Dynamics, and Soil
Nutrient Acquisition 101
Kanehiro Kitayama, Shin-ichiro Aiba, Masayuki Ushio, Tatsuyuki Seino, and Yasuto Fujiki
i v • S M I T H S O N I A N C O N T R I B U T I O N S T O B O T A N Y
SECTION III – A TEMPERATE PERSPECTIVE
7 Temperate and Tropical Podocarps: How Ecologically
Alike Are They? 119
David A. Coomes and Peter J. Bellingham 8 Ecology of Fire-Tolerant Podocarps in Temperate
Australian Forests 141
Philip G. Ladd and Neal J. Enright
SECTION IV – ECOPHYSIOLOGY AND ENVIRONMENT 9 Conifer–Angiosperm Interactions: Physiological Ecology
and Life History 157
Christopher H. Lusk
10 A Functional Analysis of Podocarp Ecology 165
Timothy J. Brodribb
11 Podocarp Roots, Mycorrhizas, and Nodules 175
Ian A. Dickie and Robert J. Holdaway
SECTION V – SYNTHESIS
12 Podocarpaceae in Tropical Forests: A Synthesis 189
Lucas A. Cernusak, Hylton Adie, Peter J. Bellingham, Edward Biffin, Timothy J. Brodribb, David A. Coomes, James W. Dalling, Ian A. Dickie, Neal J. Enright, Kanehiro Kitayama, Philip G. Ladd, Hans Lambers, Michael J. Lawes, Christopher H. Lusk, Robert J. Morley, and Benjamin L. Turner
SUBJECT INDEX 197
INDEX OF SCIENTIFIC NAMES 203
Preface
T
he emergence of angiosperms in tropical forests at the expense of the gymnosperms, their ancestral relatives, was one of the most important events in the evolutionary history of terrestrial plants. Although gym- nosperms were an important component of the flora on the supercon- tinent of Gondwana, they were virtually eliminated from the tropics following the evolution of angiosperms in the Early Cretaceous. Modern tropical forests are overwhelmingly dominated by angiosperms, yet a few gymnosperms persist.What can they tell us about the ecology of tropical forests?
Conifers of the Podocarpaceae are one of the few gymnosperms that inhabit tropical forests worldwide, although they remain the least well known of the three large conifer families. Podocarps occur throughout the Malesian, African, and neotropics and are common in temperate regions of Africa, Australasia, and South America. Tropical podocarps are often considered to be restricted to montane sites, a feature of their biogeography that is used by paleoecologists to reconstruct past forest communities. Yet they also occur in the lowland tropics, usually as rare individuals, but sometimes forming the dominant component of forest canopies.
In many cases podocarps have proved to be remarkably adaptable: mem- bers of the family have a semiaquatic lifestyle (Retrophyllum minus), exhibit drought tolerance and resprouting (Podocarpus drouynianus), and include the only known parasitic gymnosperm (Parasitaxus usta). Other intriguing aspects of their physiology include the mechanism of water transport in the leaves and the conspicuous root nodules, which are not involved in nitrogen fixation, but instead house arbuscular mycorrhizal fungi. Perhaps most surprising, paleobo- tanical evidence indicates that far from being “relict” members of tropical forest communities, podocarps have been dispersing actively into the tropics since the late Eocene epoch more than 30 million years ago. Clearly, there is much to be learned from tropical podocarps.
Arising from a workshop held at Macquarie University, Sydney, in February 2009, this volume explores in detail the ecology of the Podocarpaceae in tropical forests. Three main themes are covered:
v i • S M I T H S O N I A N C O N T R I B U T I O N S T O B O T A N Y
1. phylogeny and paleohistory of the Podocarpaceae in the tropics (chapters 1 and 2);
2. current distribution of podocarps in the African, Amer- ican, and Asian tropics (chapters 3–6); and
3. ecology and ecophysiology of the Podocarpaceae in both temperate and tropical ecosystems (chapters 7–11).
The volume concludes with a short synthesis that con- cisely summarizes the key conclusions of the workshop.
The outcome is a truly interdisciplinary review of tropical podocarps, which we hope will inspire further research on these fascinating trees.
A NOTE ON NOMENCLATURE
The taxonomy of the podocarps is complex and the least understood of the three major conifer families, with many synonyms, recent revisions, and additions that are likely to continue in the near future. Here we have followed the nomenclature of Farjon (2001) with the exception of Parasitaxus usta in place of Parasitaxus ustus (T. Jaffré,
UMR AMAP Institut de Recherche pour le Développe- ment (IRD), Laboratoire de Botanique et d’Ecologie Végé- tale, Nouméa, New Caledonia, personal communication, November 2009). We also include Phyllocladus here as a podocarp; the status of this genus has been controversial, but its elevation to family level as Phyllocladaceae is not supported by phylogenetic analyses, as outlined in chapter 1 of this volume. Finally, we use the term “tropical” here in a strict geographical sense, defined as the area between the Tropics of Cancer and Capricorn. The term should not be taken as synonymous with tropical climate, the extent of which has varied markedly in relatively recent geologi- cal history.
Benjamin L. Turner Smithsonian Tropical Research Institute,
Apartado 0843-03092, Balboa, Ancón, Republic of Panama
Lucas A. Cernusak Research School of Biology, The Australian National University, Canberra, ACT 0200, Australia
Acknowledgments
T
his volume is the product of a workshop held at Macquarie Univer- sity, Sydney, Australia, 2–6 February 2009. The workshop was made possible by the ARC–New Zealand Research Network for Vegetation Function, funded by the Australian Research Council. These work- shops were designed to promote novel thinking and personal interactions by bringing together small groups of scientists from diverse disciplines for a focused examination of a topic of considerable importance to plant science. We hope this workshop fulfilled these ideals. We thank Mark Westoby, Ian Wright, and Samantha Newton (all at Macquarie University) and Adrienne Nicotra (Aus- tralian National University) for their enthusiastic help in organizing the meet- ing. Lucas A. Cernusak was supported by a Postdoctoral Fellowship from the Australian Research Council (project number DP0771427). Finally, we thank a number of anonymous reviewers who provided detailed critical comments on the chapters. Their efforts have ensured the scientific excellence of this volume.1 Podocarp Evolution:
A Molecular Phylogenetic Perspective
Edward Biffin, John G. Conran, and Andrew J. Lowe
ABSTRACT. Phylogenetic reconstructions of the relationships among extant taxa can be used to infer the nature of the processes that have generated contemporary patterns of biotic diversity. In this study, we present a molecular phylogenetic hypothesis for the conifer family Podocarpaceae based upon three DNA fragments that have been sampled for approximately 90 taxa. We use Bayesian relaxed- clock methods and four fossil con- straints to estimate divergence times among the lineages of Podocarpaceae. Our dating analyses suggest that although the family is old (Triassic–Jurassic), the extant species groups are of recent evolutionary origin (mid- to late Cenozoic), a pattern that could reflect a temporal increase in the rate lineage accumulation or, alternatively, a high and constant rate of extinction. Our data do not support the hypothesis that Podocarpaceae have diversified at a homogeneous rate, instead providing strong evidence for a three- to eightfold increase in diversification associated with the Podocarpoid– Dacrydioid clade, which radiated in the mid- to late Cretaceous to the earliest Cenozoic, around 60–94 mya. This group includes a predominance of taxa that develop broad leaves and/or leaf- like shoots and are distributed predominantly throughout the tropics. Tropical podocarps with broad leaves may have experienced reduced extinction and/or increased speciation coincident with the radiation of the angiosperms, the expansion of megathermal forests, and relatively stable tropical climates that were widespread through the Tertiary.
INTRODUCTION
Patterns of species diversity reflect the balance of speciation and extinction over the evolutionary history of life. These, in turn, are parameters influenced by extrinsic factors, such as environmental condition and long- term processes of geological and climatic change, and intrinsic attributes of organisms, such as morphological innovations that increase the propensity for speciation or reduce the risk of extinction. The key aims of evolutionary biologists are to
Edward Biffin, John G. Conran, and Andrew J.
Lowe, Australian Centre for Evolutionary Biol- ogy and Biodiversity, School of Earth and Envi- ronmental Science, The University of Adelaide, Adelaide, South Australia 5005, Australia. Cor- respondence: E. Biffin, edward.biffin@adelaide .edu.au.
Manuscript received 13 April 2010; accepted 9 July 2010.
2 • S M I T H S O N I A N C O N T R I B U T I O N S T O B O T A N Y
explain patterns of diversity and, foremost, to determine whether there is evidence for significant heterogeneity in the “per lineage” patterns of diversity that require expla- nation (Sanderson and Wojciechowski, 1996; Magallón and Sanderson, 2001; Davies et al., 2004; Moore and Donoghue, 2007; Rabosky et al., 2007). Phylogenetic reconstructions of evolutionary relationships provide an indirect record of the speciation events that have led to ex- tant species. Because evolutionary rates can be estimated from phylogenetic data, such reconstructions can help to elucidate the significance and drivers of biotic diversity patterns (Moore and Donoghue, 2007; Ricklefs, 2007).
Molecular phylogenetics has revolutionized the field of evolutionary biology. For instance, the molecular clock hypothesis predicts that the level of genetic divergence be- tween any two lineages will be proportional to the time since divergence from a most recent common ancestor.
Therefore, using external calibrations (e.g., timing of vi- cariance events, fossils of known age, and phylogenetic affinity) or known mutation rates, it is possible to esti- mate the age of all of the splits in a molecular phyloge- netic tree (which often comprise a majority of splits with no associated fossil data to directly estimate the age).
There has been justified criticism of the molecular clock hypothesis. In particular, there is strong evidence that in most lineages, the constancy of mutation rates in proteins or DNA sequences cannot be assumed (e.g., Ayala, 1997;
Bromham and Penny, 2003). Recently developed meth- ods, which attempt to incorporate heterogeneity into phy- logenetic analysis by specifying a model of rate variation among lineages (referred to as relaxed- clock methods), are believed to provide more realistic estimates of diver- gence times in the absence of rate constancy (for recent reviews see Bromham and Penny, 2003; Rutschmann, 2006). Furthermore, there have been promising devel- opments in methods to account for uncertainty inherent in the fossil record; Bayesian methods, in particular, can incorporate fossil calibrations because parametric prior probability distributions make fewer assumptions (rela- tive to “fixed”- point calibrations) concerning the nodal placement of a given fossil datum on a phylogenetic tree (Yang and Rannala, 2006; Sanders and Lee, 2007). With improved confidence in hypotheses, there has been a di- versification of questions and associated methodologies developed around molecular clock phylogenies. These include the examination of vicariance versus dispersal ex- planations for diversity patterns (e.g., Crisp and Cook, 2007), the timing of evolutionary radiations and/or ex- tinctions and coincidence with environmental change (e.g., Davis et al., 2005), and estimation of the tempo of diversification using a statistical framework to contrast
phylogenetic data with null expectations (e.g., Rabosky et al., 2007; Rabosky and Lovette, 2008).
The conifer family Podocarpaceae comprises approxi- mately 173 species and 18 genera (Farjon, 1998) distributed primarily in the Southern Hemisphere, although extending northward as far as subtropical China and Japan and to Mexico and the Caribbean (see Enright and Jaffré, this vol- ume; Dalling et al., this volume). The podocarps have a rich fossil record that suggests an origin in the Triassic and a dis- tribution in both the Northern and Southern hemispheres through the Mesozoic, although by the Cenozoic the fossil record of the family is overwhelmingly southern (Hill and Brodribb, 1999). Currently, the Podocarpaceae comprise a majority of species- poor (Figure 1.1), range- restricted genera (e.g., Acmopyle, Lagarostrobos, Microcachrys, Microstrobos, Saxegothaea) that are presumably relictual, as evidenced by the fossil record, which indicates broader distributions and greater species diversities in the past (Hill and Brodribb, 1999). Relatively few genera are species rich and widely distributed, although Podocarpus comprises ap- proximately 105 species (Figure 1.1) and occurs on all con- tinents except Antarctica and Europe.
“Nearest living relative” comparisons of Podocar- paceae suggest the conservation of morphology, commu- nity associations, and ecological response over evolutionary time (Brodribb and Hill, 2004). From this perspective, the Podocarpaceae provide an outstanding opportunity to ex- plore the influences of organism–environment interactions in the context of large- scale geological and climatic change in shaping patterns of extant distribution and diversity. For example, the majority of podocarp species presently occur within angiosperm- dominated humid forests. This pattern is of considerable interest to paleobotanists, ecologists, and biogeographers (e.g., Brodribb and Hill, 2004; Brodribb and Feild, 2008), given that conifers in general have been considered less competitive than angiosperms in produc- tive environments (Bond, 1989). Using the ecophysiologi- cal tolerances of extant species as representative of closely allied extinct fossil taxa, it has been argued that charac- teristics such as leaf flattening and associated physiologies have promoted the persistence of Podocarpaceae in the face of angiosperm competition (Brodribb and Hill, 1997; Bro- dribb and Feild, 2008). However, within Australia, these characteristics may also be associated with range contrac- tion and at least local extinction of several lineages as a consequence of increasing aridity in the Miocene– Pliocene (Hill and Brodribb, 1999; Brodribb and Hill, 2004).
Here we use molecular (DNA sequence) data, first, to assess phylogenetic relationships among Podocarpaceae and, second, using a relaxed molecular clock approach, to estimate the timing of diversification events for the major
n u m b e r 9 5 • 3
lineages. From this perspective we explore macroevolu- tionary patterns within the family and specifically use the dated molecular phylogeny to test whether it is necessary to invoke among- lineage variation in diversification rates to explain the disparities in extant diversity among major groups of Podocarpaceae. Our results indicate a highly significant shift in diversification rates corresponding to approximately the Cretaceous–Tertiary boundary. The significance of this diversification rate shift is briefly ex- plored in the context of the angiosperm radiation, bioge- ography, and ecophysiology.
PhyLOgENETIC RELATIONshIPs IN ThE PODOCARPACEAE
Previous studies
There have been several previous phylogenetic stud- ies of the Podocarpaceae, including those based upon
morphology (Hart, 1987; Kelch, 1997, 1998) and mo- lecular (DNA sequence) data (Kelch, 1998, 2002; Conran et al., 2000; Sinclair et al., 2002). A key focus of these studies has been the assessment of relationships for clas- sification; for instance, the status of Phyllocladus has been controversial, although the elevation of this taxon to fam- ily level as Phyllocladaceae (e.g., Page, 1990a; Bobrov et al., 1999) is not supported by phylogenetic analyses to date (Conran et al., 2000; Quinn et al., 2002; Sinclair et al., 2002; Wagstaff, 2004; Rai et al., 2008). More gener- ally, there have been conflicting results from morphologi- cal versus molecular data; for example, the morphological analyses reported in Kelch (1997) suggest that gross leaf morphology is a reasonable predictor of evolutionary relationships in the Podocarpaceae, whereas analyses of DNA sequences found that scalelike leaves were polyphy- letic on the estimated topologies (Kelch, 1998; Conran et al., 2000; Sinclair et al., 2002). In this instance, there are, perhaps, reasonable grounds to favor the molecular over the morphological data, given the generally poor support FIGURE 1.1. Frequency distribution of species/genus for the Podocarpaceae (estimates according
to Farjon, 1998).
4 • S M I T H S O N I A N C O N T R I B U T I O N S T O B O T A N Y
for relationships from morphology, and in contrast to the molecules, the morphological data are not entirely inde- pendent of the conclusions (i.e., leaf morphologies were included as characters). From a wide range of studies, is- sues with morphology include fewer variable characters compared to DNA sequences and homoplasy, which may be a consequence of the choice of characters and character construction (i.e., homology assessment) as much as con- vergent or parallel evolution (Givnish and Sytsma, 1997;
Scotland et al., 2003). Nevertheless, morphological data will continue to be important in reconstructing phylogeny;
for instance, they provide the only readily sourced infor- mation on extinct fossil taxa (Wiens, 2004).
Phylogenetic studies to date have focused predomi- nantly on generic relationships among members of the Podocarpaceae, but Hart (1987) and Kelch (1997) in- cluded, at best, a single taxon per genus, with a view to resolving deeper branches of the podocarp phylogeny.
The studies of Conran et al. (2000), Kelch (2002), and Sinclair et al. (2002) included denser taxon sampling, so that generic monophyly could be assessed. Encouragingly, the evidence from both chloroplast and nuclear DNA is consistent with contemporary generic schemes (e.g., Page, 1988, 1990b; Farjon, 1998), although there are a few mi- nor exceptions. For example, Sundacarpus is nested within Prumnopitys with strong statistical support, according to Sinclair et al. (2002).
dataand Phylogenetic Methods
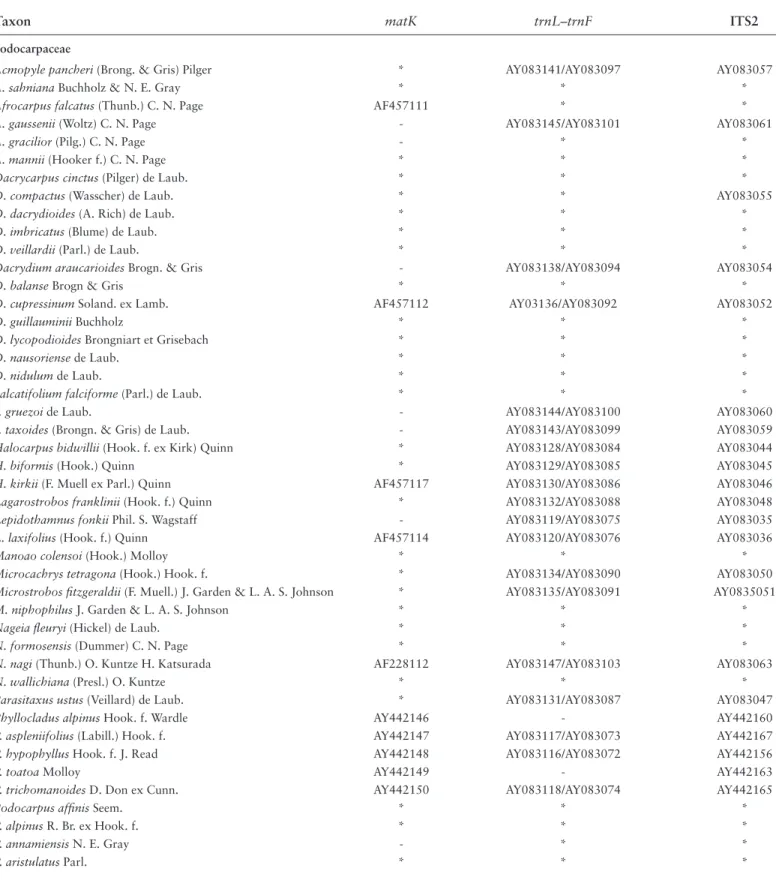
There is a range of evolutionary questions that are best addressed using complete, or near complete, sampling of species, which is the eventual aim of the authors. In the present context, we present a preliminary phylogenetic analysis of the Podocarpaceae using a data set compris- ing 89 taxa (including two Araucariaceae as an out- group) that have been sequenced for two chloroplast genes (matK gene and the trnL–trnF intron and spacer region) and internal transcribed spacer 2 of nuclear ribosomal DNA (ITS2). Data not sourced from GenBank were sequenced de novo (Table 1.1). For sequencing methods, the reader is referred to Quinn et al. (2002; matK) and Sinclair et al.
(2002; trnL–trnF and ITS2) and to Table 1.2, which details the primer combinations used for each fragment. Sequence alignment was performed using ClustalW (Thompson et al., 1994) and manual (“by eye”) adjustment. The aligned data matrix is available from the authors upon request. The molecular data were analyzed using Bayesian phylogenetic methods (as implemented in MrBayes version 3.1.2; Ron- quist and Huelsenbeck, 2003). In the first instance, each of
the matK, trnL–trnF intron and spacer, and ITS2 sequence alignments was analyzed separately, assuming a general time reversible (GTR) model of sequence evolution with Γ distributed rate variation among sites, and a proportion of sites were considered invariant (I) (run conditions as below). The topologies from each of the separate analyses were visually inspected to identify well- supported (poste- rior probability (PP) ≥ 0.95; i.e., the grouping is found in
≥95% of the topologies sampled from the PP distribution) but conflicting resolutions among individual data sets (none found), and the data were concatenated and ana- lyzed in combination using partitioned Bayesian analyses (i.e., topologies were derived by allowing each of the sepa- rate data partitions to evolveits best- fit set of GTR model parameters). Topologies were estimated from four inde- pendent runs of 1 × 10⁶ generations, sampling topology, and parameter values every hundredth generation, each with four starting chains (one cold, three heated). Conver- gence was assessed relative to the variance in parameter estimates between independent runs and by inspection of the convergence diagnostics that are summarized using the
“sump” command in MrBayes. Majority rule consensus trees were generated using the “sumt” command, discard- ing trees generated during the burn- in, with the burn- in proportion determined by inspection of the convergence diagnostics.
Some studies have reported high Bayesian posterior probability values corresponding to relatively weaker clade support from nonparametric bootstrapping (BS) for the same data set (see Alfaro et al., 2003, and refer- ences therein). In addition to Bayesian analyses, we used the maximum likelihood (ML) implementation GARLI (Zwickl, 2006) to estimate support for podocarp relation- ships. For these analyses, we used the concatenated align- ment, a GTR + I + Γ model of sequence evolution with parameter values estimated from the data, and we per- formed 100 BS pseudoreplicates to estimate clade support.
Phylogenetic relationshiPsofthe PodocarPaceae
The Bayesian majority rule consensus topology from the concatenated data analyses is presented in Figure 1.2.
We recovered generally consistent topologies from Bayesian and ML analyses in terms of both resolution and statistical support: clades receiving a PP > 0.95 also had ML BS values of >80%, and there were no strongly supported conflict- ing resolutions among criteria. As with previous molecu- lar phylogenies of the Podocarpaceae, the conventionally recognized genera are strongly supported as monophy- letic, with the exception of Prumnopitys, which includes
n u m b e r 9 5 • 5
TABLE 1.1. Taxon sampling for DNA sequences. GenBank accession numbers are listed. An asterisk (*) indicates de novo sequencing;
a dash (-) indicates missing data; and ITS2 = internal transcribed spacer 2.
Taxon matK trnL–trnF ITS2
Podocarpaceae
Acmopyle pancheri (Brong. & Gris) Pilger * AY083141/AY083097 AY083057
A. sahniana Buchholz & N. E. Gray * * *
Afrocarpus falcatus (Thunb.) C. N. Page AF457111 * *
A. gaussenii (Woltz) C. N. Page - AY083145/AY083101 AY083061
A. gracilior (Pilg.) C. N. Page - * *
A. mannii (Hooker f.) C. N. Page * * *
Dacrycarpus cinctus (Pilger) de Laub. * * *
D. compactus (Wasscher) de Laub. * * AY083055
D. dacrydioides (A. Rich) de Laub. * * *
D. imbricatus (Blume) de Laub. * * *
D. veillardii (Parl.) de Laub. * * *
Dacrydium araucarioides Brogn. & Gris - AY083138/AY083094 AY083054
D. balanse Brogn & Gris * * *
D. cupressinum Soland. ex Lamb. AF457112 AY03136/AY083092 AY083052
D. guillauminii Buchholz * * *
D. lycopodioides Brongniart et Grisebach * * *
D. nausoriense de Laub. * * *
D. nidulum de Laub. * * *
Falcatifolium falciforme (Parl.) de Laub. * * *
F. gruezoi de Laub. - AY083144/AY083100 AY083060
F. taxoides (Brongn. & Gris) de Laub. - AY083143/AY083099 AY083059
Halocarpus bidwillii (Hook. f. ex Kirk) Quinn * AY083128/AY083084 AY083044
H. biformis (Hook.) Quinn * AY083129/AY083085 AY083045
H. kirkii (F. Muell ex Parl.) Quinn AF457117 AY083130/AY083086 AY083046
Lagarostrobos franklinii (Hook. f.) Quinn * AY083132/AY083088 AY083048
Lepidothamnus fonkii Phil. S. Wagstaff - AY083119/AY083075 AY083035
L. laxifolius (Hook. f.) Quinn AF457114 AY083120/AY083076 AY083036
Manoao colensoi (Hook.) Molloy * * *
Microcachrys tetragona (Hook.) Hook. f. * AY083134/AY083090 AY083050
Microstrobos fitzgeraldii (F. Muell.) J. Garden & L. A. S. Johnson * AY083135/AY083091 AY0835051
M. niphophilus J. Garden & L. A. S. Johnson * * *
Nageia fleuryi (Hickel) de Laub. * * *
N. formosensis (Dummer) C. N. Page * * *
N. nagi (Thunb.) O. Kuntze H. Katsurada AF228112 AY083147/AY083103 AY083063
N. wallichiana (Presl.) O. Kuntze * * *
Parasitaxus ustus (Veillard) de Laub. * AY083131/AY083087 AY083047
Phyllocladus alpinus Hook. f. Wardle AY442146 - AY442160
P. aspleniifolius (Labill.) Hook. f. AY442147 AY083117/AY083073 AY442167
P. hypophyllus Hook. f. J. Read AY442148 AY083116/AY083072 AY442156
P. toatoa Molloy AY442149 - AY442163
P. trichomanoides D. Don ex Cunn. AY442150 AY083118/AY083074 AY442165
Podocarpus affinis Seem. * * *
P. alpinus R. Br. ex Hook. f. * * *
P. annamiensis N. E. Gray - * *
P. aristulatus Parl. * * *
continued
6 • S M I T H S O N I A N C O N T R I B U T I O N S T O B O T A N Y
TABLE 1.1. (Continued)
Taxon matK trnL–trnF ITS2
Podocarpaceae
P. brassii Pilger in Engler * * -
P. chinensis (Roxb.) Wall. ex Forbes * * *
P. costalis C. Presl. * * *
P. cunninghamii Colenso - * *
P. dispermus White * * *
P. drouynianus F. Muell. * * *
P. elatus R. Br. ex Endl. AF457113 * *
P. elongatus (Aiton) L’Herit. ex Persoon * * -
P. gnidioides Carrière * * *
P. guatemalensis Standl. - AY083151/AY083107 AY083067
P. henkelii Stapf * * AY845209
P. lambertii Klotzsch ex Endl. * * *
P. latifolius (Thunb.) R. Br. ex Mirb. - * AY845215
P. lawrencei Hook. f. * * *
P. lawrencei * * *
P. lawrencei * * *
P. lawrencei * * *
P. longifoliolatus Pilger in Engler * AY083149/AY083105 AY083065
P. macrophyllus (Thunb.) Sweet AF228111 * *
P. matudae Lundell * * *
P. neriifolius D. Don in Lamb. * * *
P. nivalis Hook. f. * * *
P. nubigenus Lindley * * *
P. polystachyus R. Br. ex Endl. * * *
P. rumphii Blume * * *
P. salignus D. Don * AY083148/AY083104 AY083064
P. smithii de Laub. - * *
P. spinulosus (Smith) R. Br. * * *
P. sylvestris J. Buchholz * AY083152/AY083108 AY083068
P. totara D. Don * * *
Prumnopitys andina (Poepp. ex Endl.) de Laub. * AY083124/AY083080 AY083040
P. ferruginea (D. Don) de Laub. AF457115 AY083127/AY083083 AY083043
P. ferruginoides (Compton) de Laub. * AY083126/AY083082 AY083042
P. ladei (Bailey) de Laub. * AY083125/AY083081 AY083041
P. taxifolia (Soland. ex D. Don) de Laub. * AY083123/AY083079 AY083039
Retrophyllum comptonii (Buchh.) C. N. Page - * *
R. vitiense (Seeman) C. N. Page * * *
Saxegothaea conspicua Lindl. AF457116 AY083121/AY083077 AY083037
Sundacarpus amarus (Blume) C. N. Page * AY083122/AY083078 AY083038
Araucariaceae
Agathis australis (D. Don) Loudon EU025980 AY083115/AY083071 AY083031
Araucaria heterophylla (Salisb.) Franco AF456374 - *
Araucaria biramulata Buchholz - AY083114/AY083070 -
n u m b e r 9 5 • 7
Sundacarpus (Prumnopitys sensu lato). The relationships among genera are also largely well supported. Strongly supported groupings include a “Podocarpoid” clade (Af- rocarpus, Nageia, Podocarpus, Retrophyllum), a “Dac- rydioid” clade (Dacrydium, Dacrycarpus, Falcatifolium), and a “Prumnopityoid” clade (Halocarpus, Lagarostrobos, Manoao, Parasitaxus, Prumnopitys sensu lato) (Figure 1.2).
These groupings were previously recovered by Conran et al.
(2000), although with relatively weak support. At a lower taxonomic level, resolutions include the pairing of Manoao and Lagarostrobos, with Parasitaxus sister to these, a rela- tionship that was suggested, but not statistically supported, in the analyses of Sinclair et al. (2002). Given the level of divergence, the segregation of Manoao from Lagarostrobos is reasonable on the basis of the present data, as is that of Falcatifolium from Dacrydium sensu stricto (cf. Conran et al., 2000). The deepest branches in the phylogeny are not strongly supported, although a group including Lepido- thamnus, Phyllocladus, and the Prumnopityoid clade has a PP of 0.91 and a BS and ML bootstrap support of 60%, and the pairing of Lepidothamnus and Phyllocladus is also weakly supported (PP = 0.79, BS = 68%).
Although genera, and most intergeneric relationships, receive strong support from these data, relationships among species are relatively ambiguous. For instance, all resolutions within Afrocarpus, Dacrycarpus, Nageia, and Phyllocladus are, at best, weakly supported (PP ≤ 0.9), whereas within Dacrydium and Podocarpus the major- ity of nodes receive low levels of statistical support. On one hand, poor resolution may be a consequence of data conflict (i.e., individual data sets support conflicting reso- lutions), leading to topological ambiguity. Alternatively, there may be insufficient evidence to adequately resolve relationships, analogous to sampling error in small data sets (Graham et al., 1998). As noted above, there were
no strongly supported conflicting resolutions noted in the visual inspection of topologies derived from individual data partitions, suggesting that the latter is a reasonable hypothesis. Furthermore, as the data are not uninforma- tive per se, it could be argued that poor resolution among species is a consequence of relatively recent radiations, such that lineages have had insufficient time to accrue informative mutations. Typically, this scenario is associ- ated with a broomlike topology (as discussed by Crisp et al., 2004), which is evident in the present data. Low- level studies of Afrocarpus (Barker et al., 2004), Phyllocladus (Wagstaff, 2004), and Retrophyllum (Herbert et al., 2002) report similarly poor resolution among species, consistent with relatively recent origins (see Wagstaff, 2004, who ex- plicitly considers divergence time estimates). The timing of radiations within the Podocarpaceae is addressed further in the next section.
MOLECULAR DATINg ANALysEs
In the present study, we use the Bayesian relaxed- clock implementation in BEAST (Drummond and Rambaut, 2007) to estimate divergence times among lineages of the Podocarpaceae. BEAST uses a probabilistic model to de- scribe the pattern of change in molecular rates through time and Markov chain Monte Carlo (MCMC) simulation sampling substitution rates, branch lengths, the individual parameters of the substitution model, and tree priors to de- rive the posterior probability of divergence time estimates (Drummond et al., 2006; Rutschmann, 2006). In contrast to other currently available molecular dating implemen- tations, BEAST samples both tree topology and branch lengths, allowing the user to coestimate phylogeny and substitution rates. Departures from the molecular clock TABLE 1.2. PCR and sequencing primers.
Region Name Sequence 5'-3' Reference
matK matkF1 AAYAARCATAGATCTTGGCARCAAT This study
matK matkF2 TGYGAATCCATTHTAGTTCCYCTT This study
matK matKR1 AGSRATCTTTCBCSRTATCTCACATA This study
matK matKR2 TTAGCRCATGAAAGTAGAAGTA This study
trnL–trnF TabC CGAAATCGGTAGACGCTACG Taberlet et al. (1991)
trnL–trnF TabF TI’TGAACTGGTGACACGAG Taberlet et al. (1991)
ITS2 ITS3P GCCACGATGAAGAACGTAGCGA Modified from White et al. (1990)
ITS2 ITS4P CCGCTTATTGATATGCTTAAGCTCA Modified from White et al. (1990)
8 • S M I T H S O N I A N C O N T R I B U T I O N S T O B O T A N Y
FIGURE 1.2. Phylogenetic relationships (Bayesian analysis, 50% majority rule) in the Podocarpaceae inferred from a matK, trnL–trnF chloroplast intron and spacer, and ITS2 data set. Branch lengths are proportional to the inferred number of changes; dashed branches have a posterior prob- ability (PP) < 0.95, and unless otherwise indicated, solid branches have a PP of 1.0. Genera are according to Farjon (1998), and higher- order groupings are according to Con- ran et al. (2000).
n u m b e r 9 5 • 9
assumption are estimated from the data, with completely clocklike (i.e., a single rate across the tree) to highly het- erogeneous (i.e., numerous rate changes among branches) models representing the opposite extremes of a spectrum of rate variation (Drummond et al., 2006).
In BEAST, fossil calibrations are incorporated as prior probability distributions, including parametric distribu- tions such as normal, lognormal, or exponential prior probabilities on the distribution of node ages. Given that many (if not most) fossil placements have a degree of un- certainty, this approach has advantages over the incor- poration of fossil data as “fixed”- point calibrations on a particular node (see, e.g., Yang and Rannala, 2006; Ben- ton and Donoghue, 2007; Sanders and Lee, 2007). For instance, a prior probability distribution can be designed with a peak probability corresponding to the age of a fos- sil and with decreasing, but nonzero, probabilities that the calibration node is either older or younger than the fossil age distributed according to a normal distribution ( Sanders and Lee, 2007).
Divergence time estimates were derived from a chlo- roplast data set comprising the matK coding region and trnL–trnF spacer and intron for 92 taxa (90 representa- tives of the Podocarpaceae and 2 representatives of the Ar- aucariaceae). Four fossil- derived constraints were used to calibrate molecular rates (Table 1.3). These were selected
from the literature (e.g., Hill and Brodribb, 1999) on the basis of the oldest reasonably placed macrofossil age for the associated lineage. The incompleteness of the fossil re- cord usually requires that a fossil assigned to a particular node provides the minimum age for that node (i.e., older fossils may yet be found), although fossil age constraints are often applied to the node that subtends the crown group, which may be significantly younger than the actual age of the fossil lineage (Magallón and Sanderson, 2001;
Magallón, 2004; Renner, 2005). Where the accuracy of fossil placement is uncertain the most objective calibration method may be to fix the stem group (age) as the minimum age for the diversification of the descendant crown group (given that the fossil in question is correctly assigned to a lineage; Renner, 2005). In other words, the stem group node must be at least as old or older than a fossil belong- ing to that lineage. Maximum (upper) constraints are more difficult to establish (Benton and Donoghue, 2007), although a “soft” upper bound (i.e., with nonzero prob- abilities associated with all reasonable values) can be de- fined using an appropriate parametric distribution (Yang and Rannala, 2006; Sanders and Lee, 2007).
In the present study, the fossil- derived dates were used to provide the minimum age for the most recent common ancestor of the corresponding stem group. Uncertainty in the association between the calibration node and the fossil
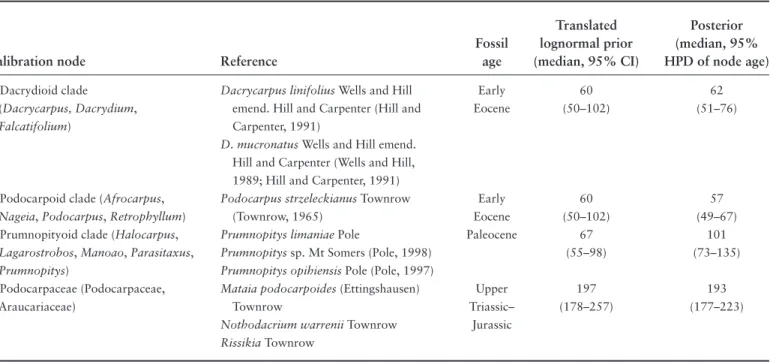
TABLE 1.3. Fossil calibration points used for divergence time estimation. Calibration node numbers correspond to Figure 1.3. Abbrevia- tions: CI, confidence interval; HPD, highest posterior density.
Translated Posterior Fossil lognormal prior (median, 95%
Calibration node Reference age (median, 95% CI) HPD of node age)
1. Dacrydioid clade Dacrycarpus linifolius Wells and Hill Early 60 62
(Dacrycarpus, Dacrydium, emend. Hill and Carpenter (Hill and Eocene (50–102) (51–76)
Falcatifolium) Carpenter, 1991)
D. mucronatus Wells and Hill emend.
Hill and Carpenter (Wells and Hill, 1989; Hill and Carpenter, 1991)
2. Podocarpoid clade (Afrocarpus, Podocarpus strzeleckianus Townrow Early 60 57
Nageia, Podocarpus, Retrophyllum) (Townrow, 1965) Eocene (50–102) (49–67)
3. Prumnopityoid clade (Halocarpus, Prumnopitys limaniae Pole Paleocene 67 101
Lagarostrobos, Manoao, Parasitaxus, Prumnopitys sp. Mt Somers (Pole, 1998) (55–98) (73–135) Prumnopitys) Prumnopitys opihiensis Pole (Pole, 1997)
4. Podocarpaceae (Podocarpaceae, Mataia podocarpoides (Ettingshausen) Upper 197 193
Araucariaceae) Townrow Triassic– (178–257) (177–223)
Nothodacrium warrenii Townrow Jurassic
Rissikia Townrow
1 0 • S M I T H S O N I A N C O N T R I B U T I O N S T O B O T A N Y
record was accommodated by providing a parametric (log- normal) prior probability distribution for the age of the node. The details of the fossil calibration priors are pre- sented in Table 1.3 and are illustrated in Figure 1.3. In each instance, the estimated fossil age was used to define the zero offset of the lognormal calibration prior, thereby im- posing a minimum age constraint approximating the fossil age on the relevant stem node. In addition to the above constraints, an upper age constraint of 300 mya was placed upon the age of the root. Although several extant lineages have been associated with microfossils extending back before the earliest known macrofossils (see Morley, this volume), we preferred the macrofossil evidence because of its greater complexity of characters. This allows greater confidence in the assignment of fossil material to extant lineages as the problems of homoplasy in the fossil record tend to increase with clade age (Wagner, 2000), which can readily mislead inferences when there are few characters for comparison (e.g., Willyard et al., 2007). Note that our calibration approach does not rule out much older ages (i.e., consistent with the microfossil dates) a priori as the calibration prior includes dates approximately twice as old as the macrofossil age in the 95% confidence interval (Table 1.3). We expect, however, that a detailed assessment of the fossil record of the Podocarpaceae is needed to iden- tify synapomorphies uniting fossil and extant taxa (e.g., Saquet et al., 2009), rather than postulated relationships based upon gross morphological similarity.
For the analyses in BEAST, a GTR + I + Γ model of sequence evolution was assumed with the substitution model parameters unlinked across data partitions. An uncorrelated lognormal model of rate variation among branches in the tree and a Yule prior on branch rates was also assumed a priori. Four independent MCMC runs, each of 5 × 10⁶ steps, were performed and subsequently pooled (after excluding an appropriate burn- in fraction, as determined using Tracer version 1.4; Rambaut and Drum- mond, 2007) to derive the 95% highest posterior density of topology and parameter estimates. The topology pre- sented in Figure 1.3 is the maximum clade credibility tree derived from the sample of 20,000 trees, with clade pos- terior probability and 95% highest posterior density (i.e., 95% of topologies sampled from the posterior have values within this range) of divergence times indicated. As with the nonclock analyses, the genera and most of the deeper internal branches are strongly statistically supported. Fur- thermore, the relationships inferred among lineages are generally consistent among the clock and nonclock phylo- genetic analyses (compare Figures 1.2 and 1.3).
ANALysEs Of DIvERsITy teMPoral Patternsof diversity
Although the family appears to be of ancient origin (mid- Mesozoic, 95% highest posterior density 177–223 mya), the molecular dating analyses suggest that the majority of extant genera have arisen relatively recently (Upper Cretaceous to Cenozoic; Figure 1.3), whereas the extant crown groups of these genera are estimated to have diversified from predominantly the mid- to late Cenozoic.
In Figure 1.4, the number of species in the phylogeny from the origination of the clade to the present (log scale) is plotted against the relative timing of inferred speciations (proportion of time since origination of the clade). This lineages- through- time plot shows a gradual increase in the rate of lineage accumulation and then an upturn at ap- proximately 40 mya, reflecting the estimated recent timing of the origination of most extant lineages.
Lineages- through- time plots have been widely used to infer macroevolutionary patterns; for instance, com- parison of the data to a Yule (or pure birth) speciation model can be used to make inferences regarding the tempo of evolution (e.g., Harmon et al., 2003; Ricklefs, 2007;
Rabosky and Lovette, 2008). Under a Yule model, there is an instantaneous rate of per lineage speciation and no extinction, giving an exponential increase in the number of lineages through time. Significant departures from this null model are indicative of temporal variation in the di- versification rate (i.e., the per lineage rate of speciation and/or extinction; Harmon et al., 2003).
In Figure 1.5, the expectation under a Yule model was generated by connecting the point representing the first node in the phylogeny with the point representing the number of extant podocarp taxa (173) on the log- linear lineages- through- time plot. This resulting straight line provides the null hypothesis of exponential growth of lin- eages. To provide a confidence interval on the expectation of exponential growth, 100 phylogenies were simulated under a Yule model, each giving rise to 173 extant lin- eages. Clearly, the podocarp data show significant depar- ture from the null model of exponential diversification, the comparison being consistent with the hypothesis that diversification rates in the Podocarpaceae have increased toward the present. However, there are other plausible hy- potheses that can be assessed using more complex models of diversification.
In Figure 1.6, the lineages- through- time plot is com- pared with a constant birth- death model, which includes
n u m b e r 9 5 • 1 1
FIGURE 1.3. Maximum clade credibility tree derived from analyses of chloroplast (matK and trnL–trnF intron and spacer) DNA sequences using the Bayesian relaxed- clock implementation BEAST. Median node heights are indicated, and shaded horizontal bars represent the 95% highest posterior density of divergence times for that node. Dashed branches have a PP ≤ 0.95. Numbered nodes correspond to fossil cali- brations as detailed in Table 1.3. Scale is in millions of years before present.
1 2 • S M I T H S O N I A N C O N T R I B U T I O N S T O B O T A N Y
an instantaneous rate of speciation and extinction. For the birth–death model, the extinction fraction was set to 0.95 (i.e., lineages have a 5% chance of survival to the present), and a 95% confidence interval was generated from 100 simulated birth- death topologies, as described above. As with the actual data, the simulated topologies show a sharp upturn toward the present and provide a close approximation to the data across the full depth of the Podocarpaceae phylogeny. In this instance, the sharp upturn in the rate of lineage accumulation may be ascribed to the “pull of the present” (Nee et al., 1994). That is, at a high relative extinction rate, the probability of a lineage persisting into the present decreases with the age of the
lineage, and therefore, recently evolved lineages are more likely to be observed in studies using only extant taxa. Re- cent simulation studies demonstrate that a similar upturn in lineages- through- time plots can also be generated under models with large declines in diversification rate, when the decline is mediated by a temporally increasing extinc- tion rate (Rabosky and Lovette, 2008). Failure to consider extinction can lead to potentially spurious inferences of evolutionary tempo.
Rabosky (2008) provides a method by which a rela- tive extinction rate can be approximated from phyloge- netic data, which is implemented in the LASER package (Rabosky, 2006) for the R programming language. This FIGURE 1.4. Lineages- through- time plot (log scale) for the Podocarpaceae based upon the relaxed-
clock analyses of chloroplast data. Sampling is reasonably complete for approximately 80% of the time since origination (dashed vertical line).
n u m b e r 9 5 • 1 3
method uses (ultrametric) branch length estimates and standing diversity estimates of terminal taxa to derive a maximum likelihood estimate of diversification rate, which varies with the relative extinction fraction (e). The likeli- hood surface can be visualized across the range of values of e to determine the value that returns the maximum like- lihood estimate of diversification rate. For the podocarp data, this analysis was performed on an ultrametric topol- ogy (median node heights estimated from the relaxed- clock analyses, above) sampled to generic level by pruning all but one representative per genus, with generic species richness estimates assigned to the terminals according to Farjon
(1998) (see Figure 1.8). Figure 1.7 plots the likelihood sur- face for relative extinction fractions ranging from zero (no extinction) to 0.99 (99% of lineages go extinct) and sug- gests that (given the model) a relative extinction rate some- what in excess of 0.9 (i.e., lineages have a <10% chance of surviving to the present) provides a reasonable approxima- tion for these data. Although there are no direct estimates of an extinction rate for the Podocarpaceae derived from fossils, the inference of a high relative extinction rate seems reasonable in light of the levels of Cenozoic diversity of the Podocarpaceae in the Southern Hemisphere fossil record (Hill and Brodribb, 1999).
FIGURE 1.5. Lineages- through- time plot (log scale) for the Podocarpaceae compared to the expec- tation of exponential growth of lineages (Yule model; solid line). A 95% confidence interval on this expectation (dashed lines) was generated from 100 phylogenies simulated under a Yule model, each giving rise to 173 extant species.
1 4 • S M I T H S O N I A N C O N T R I B U T I O N S T O B O T A N Y
shiftsin diversification rate
The above estimate assumes that the podocarp phy- logeny was generated under a constant rate of lineage diversification, an assumption that can be tested by con- trasting the likelihood of a model that fits a homogeneous diversification rate to the data with one in which an an- cestral diversification rate shifts at some point to a new diversification rate (Sanderson and Wojciechowski, 1996.;
Rabosky et al., 2007). These analyses were performed in LASER, using the branch length and per genus diversities as above, and were repeated for 100 topologies sampled
from the 95% highest posterior density of the BEAST runs to assess the robustness of the conclusion to variations in topology and branch length estimates. In the first instance, the relative extinction rate was set to 0.95, but subsequent analyses were performed using e = 0 to test that the con- clusions were robust to the model assumptions. For both relative extinction rates and all sampled topologies, com- parison of standing diversities with those expected under a uniform diversification rate rejects the null hypothesis of a homogeneous diversification rate for the Podocarpaceae (p < 1 × 10⁻⁵, e = 0.95). That is, the observed levels of diversity among the podocarpaceous lineages are better FIGURE 1.6. Lineages- through- time plot (log scale) for the Podocarpaceae compared to the
expectation under a constant birth–death speciation model. The dashed lines represent a 95%
confidence interval generated from 100 phylogenies simulated under a time- homogenous ex- tinction rate of 0.95.
n u m b e r 9 5 • 1 5
accounted for by a model in which diversification rates have increased or decreased significantly at some point in the evolution of family.
For the variable diversification rate model, the phylo- genetic tree is sequentially split at each node, and a diver- sification rate is optimized onto each descendant lineage.
The maximum likelihood diversification shift point is the node with the highest combined likelihood obtained by summing the lineage- specific likelihood estimates from each bipartite tree (Rabosky et al., 2007). For the podo- carp data, the maximum likelihood shift point is located on the most recent common ancestor (MRCA) of the Dacrydioid and Podocarpoid clades (Figure 1.8). The ex- tent of this shift ranges from an approximately threefold (e = 0) to an eightfold increase in diversification rate at e = 0.95. At e = 0.95, other nodes with a likelihood (L) ap- proaching the inferred maximum likelihood shift include the immediate ancestor of the Podocarpoid–Dacrydioid clade and the successively deeper node (ΔL = 3.5 and 1.9, respectively, compared to the maximum likelihood shift point), the Podocarpus crown node (ΔL = 3.53), and the MRCA of Lepidothamnus, Phyllocladus, and the Prum- nopityoid clade (ΔL = 4.9) (Figure 1.8). The latter is the largest diversification rate decrease inferred from these data. Among these, the two successive nodes immedi- ately below the maximum likelihood shift point are per- haps a consequence of “trickle down,” that is, potentially
spurious inference of rate shifts stemming from the nested nature of phylogenetic data and the high diversity of im- mediately more nested nodes (Moore et al., 2004). Simi- larly, the Podocarpoid–Dacrydioid clade not only includes Podocarpus but also unites other, relatively species rich, clades (e.g., the Dacrydioid clade with 35 species) and has a likelihood score exceeding the immediately more nested nodes. The identified maximum likelihood shift point was robust to variations in the modeled extinction fraction.
tiMingand correlatesof shifts
in diversification rate
A major event in the evolution of land plants was ecological radiation and taxonomic diversification of flowering plants, which is concomitantly associated with declining diversities among other plant groups, including conifers (e.g., Crane, 1987; Crane and Lidgard, 1989;
McElwain et al., 2005). The major diversification of an- giosperms is believed to have occurred in the mid- to Late Cretaceous (middle Albian to early Cenomanian, approxi- mately 100–94 mya); for instance, there is a dramatic increase in the representation of angiosperms in regional palynofloras (from approximately <5% to >40%) over a 40 million year period from the mid- Cretaceous, con- sistent with rapid radiation (Crane, 1987). Although the timing is debated, angiosperm- dominated megathermal
FIGURE 1.7. The likelihood of diversification rate estimates plotted against the relative extinction fraction under a model that assumes a homogenous diversification rate that varies with the extinction fraction. Analyses performed in LASER (Rabosky, 2006) using branch length and species richness data as in Figure 1.8.
1 6 • S M I T H S O N I A N C O N T R I B U T I O N S T O B O T A N Y
FIGURE 1.8. Chronogram of the Podo- carpaceae derived from the Bayesian relaxed- clock analyses and pruned to include a single representative of each genus (Podocarpus sampled to subge- nus). The estimated species richness of terminals is indicated. The Podocarpoid– Dacrydioid clade (indicated) represents the estimated maximum likelihood di- versification rate shift point. Bold taxon names indicate genera with broad leaves or shoots.