The Use of Applied Technology in Team Sport
The use of technology within sport is well established, most professional sport teams engage in the use of electronic performance and tracking systems. This book is the first to offer a deep and structured examination of these technologies and how they are used in a team sport setting.
The Use of Applied Technology in Team Sport describes and assists researchers, academics and professionals with understanding the methodology around applied technology in sport, examining what systems track players’ performance and who are the manufacturers that provide these systems.
This new volume goes on to describe how to apply the systems, highlights the ways of reporting analysis information and helps the reader to know and understand the future avenues of research and development.
The Use of Applied Technology in Team Sport is considered an essential guide for researchers, academics and students as well as professionals working in the areas of Applied Sport Science, Coaching, and subjects relating to Physiology, Biomechanics, Sports Engineering, Sports Technology and Performance Analysis in Sport.
José Pino-Ortega is Titular Professor in University of Murcia, Spain, and researcher of the BIOVETMED & SPORTSCI Research Group from the same university. He has a Ph.D. in Sport Sciences—Applied technology to Sport in Faculty of Sport Science from University of Murcia, Spain.
Markel Rico-González is a researcher of both University of Basque
Country, Spain, and BIOVETMED & SPORTSCI Research Group from
University of Murcia, Spain. He has a Ph.D. in Sport Sciences— Team
Sports Performance and Applied Technology and Applied Technology in
Faculty of Education and Sport from the University of Basque Country.
Routledge Research in Sports Technology and Engineering
The Routledge Research in Sports Technology and Engineering series showcases cutting-edge research from this increasingly significant discipline. Featuring the work of established and emerging scientists and practitioners from around the world, this series is an important channel for new and ground-breaking research in technology and engineering for sport.
Available in this series:
The Science and Engineering of Sport Surfaces
Edited by Sharon Dixon, Paul Fleming, Iain James and Matt Carré The Use of Applied Technology in Team Sport
Edited by José Pino-Ortega and Markel Rico-González
The Use of Applied Technology in Team Sport
Edited by José Pino-Ortega and Markel Rico-González
publisherlogo
First published 2021 by Routledge
605 Third Avenue, New York, NY 10017 and by Routledge
2 Park Square, Milton Park, Abingdon, Oxon, OX14 4RN
Routledge is an imprint of the Taylor & Francis Group, an informa business
© 2021 selection and editorial matter, José Pino-Ortega and Markel Rico-González ; individual chapters, the contributors
The right of José Pino-Ortega and Markel Rico-González to be identified as the authors of the editorial material, and of the authors for their individual chapters, has been asserted in accordance with sections 77 and 78 of the Copyright, Designs and Patents Act 1988.
© 2021 selection and editorial matter, José Pino-Ortega and Markel Rico-González ; individual chapters, the contributors
All rights reserved. No part of this book may be reprinted or reproduced or utilized in any form or by any electronic, mechanical, or other means, now known or hereafter invented, including photocopying and recording, or in any information storage or retrieval system, without permission in writing from the publishers.
Trademark notice: Product or corporate names may be trademarks or registered trademarks, and are used only for identification and explanation without intent to infringe.
Library of Congress Cataloging-in-Publication Data A catalog record for this book has been requested ISBN: 978-0-367-74298-0 (hbk)
ISBN: 978-0-367-74299-7 (pbk) ISBN: 978-1-003-15700-7 (ebk) Typeset in Times
by SPi Global, India
Contents
List of Figures List of Tables
List of Contributors
PART I
Data Collection Technology
1 Standardization of Electronic Performance and Tracking Systems
JOSÉ PINO-ORTEGA AND MARKEL RICO-GONZÁLEZ
2 Semi-Automatic Multiple Camera Systems
ALEJANDRO BASTIDA-CASTILLO, JOSÉ PINO-ORTEGA, MARKEL RICO-GONZÁLEZ, AND CARLOS D. GÓMEZ-CARMONA
3 Global Navigation Satellite Systems
CARLOS D. GÓMEZ-CARMONA, JOSÉ PINO-ORTEGA, MARKEL RICO-GONZÁLEZ, AND ALEJANDRO BASTIDA-CASTILLO
4 Local Positioning Systems
FILIPE MANUEL CLEMENTE, JOSÉ PINO-ORTEGA, AND MARKEL RICO-GONZÁLEZ
5 Microelectromechanical Systems
CARLOS D. GÓMEZ-CARMONA, JOSÉ PINO-ORTEGA, AND MARKEL RICO- GONZÁLEZ
6 Wearables for Internal Workload Monitoring: Combined Heart Rate and Mechanical Sensors
DANIEL ROJAS-VALVERDE
PART II
Data Transmission
7 Data Acquisition and Transmission
AMAIA MÉNDEZ ZORRILLA, IÑIGO ORUE SAIZ, ARITZ BADIOLA BENGOA, AND JULEN BADIOLA MARTÍNEZ
8 Real-Time Feedback: An Update
JOSÉ PINO-ORTEGA, ASIER LOS ARCOS, AND MARKEL RICO-GONZÁLEZ
PART III
Data Processing: Performance Variables
9 Kinematical Variables
PEDRO RECHE-SOTO, JOSÉ PINO-ORTEGA, AND LUCA PAOLO ARDIGÒ
10 Collective Tactical Variables
ASIER GONZALEZ-ARTETXE AND ASIER LOS ARCOS
11 Neuromuscular Variables
CARLOS D. GÓMEZ-CARMONA, JOSÉ PINO-ORTEGA, AND MARKEL RICO- GONZÁLEZ
12 Physiological Variables: Training Impulse and Heart Rate Variability
FABIO YUZO NAKAMURA AND JÚLIO ALEJANDRO HENRIQUES DA COSTA
13 Multidimensional Variables
PAULO PEREIRA, BRUNO GONÇALVES, JORGE BRAVO, ORLANDO FERNANDES, AND HUGO FOLGADO
PART IV
Big Data and Reduction Techniques
14 Big Data Applied to Team Sport Athletes’ Performance
MIGUEL ÁNGEL CASIMIRO, JOSÉ PINO-ORTEGA, AND MARKEL RICO-GONZÁLEZ
15 Data Mining in Sportsw
DANIEL ROJAS-VALVERDE, JOSÉ PINO-ORTEGA, AND MARKEL RICO-GONZÁLEZ
PART V
Computer Vision and Machine Learning
16 Computer Vision
ARNOLD BACA
17 Machine Learning
ARNOLD BACA
Index
Figures
3.1 (a) GNSS functioning and the effect of (b) HDOP, (c) data processing algorithms, (d) sampling frequency, (e) environmental conditions and infrastructures, and (f) body location of GNSS receiver
5.1 Model of a dynamometer-mass system in an accelerometer 5.2 Model of a dynamometer-mass system in a gyroscope
5.3 Company, devices, and locations of the devices that are used to register external workload through accelerometry in team sports (modified of Gómez-Carmona et al., 2020a, 2020b)
6.1 Methods for heart rate monitoring using wearable devices 6.2 Biosensors categorization based on the type of variables 7.1 GPS – Each player/athlete wears a GPS sensor
7.2 GPS Space Segment 7.3 GPS Control Segment 7.4 GPS User Segment
7.5 LPS – Each player/athlete wears a transponder (T) 7.6 Example of two camera-based ball tracking system
7.7 Network architecture of an eight camera-based sports player tracking system
8.1 UWB technology installation for real-time feedback
8.2 Possibilities within the device (left), possibilities when it reaches the PC (right)
13.1 Performance indicators aggregation for the development of multidimensional indicators (adapted from Bradley & Ade, 2018)
13.2 Flowchart of the procedures of data collection, processing and integration for the development of multidimensional indicators
15.1 Management and inter- multidisciplinary approach of an athlete’s
performance
15.2 Novel technology for a multidimensional approach 15.3 Data management and data mining flowchart
15.4 Principal component analysis procedure step by step
15.5 Factorability of r using a correlation matrix for the exclusion of variables giving the same information
15.6 Component load graph with (Up) and without VariMax rotation (Down)
15.7 A typical graph of sedimentation of PCA
15.8 PCA results in reporting examples (authors unpublished data) 16.1 Object detection on the example of soccer players
16.2 Image segmentation by background subtraction 16.3 Line distortion and difficult light conditions 16.4 Visualization of player movement
16.5 Occlusions
17.1 Machine learning types
17.2 Artificial neural network – supervised learning
17.3 Original positions of offense and defense group are transferred to a trained network, where clusters represent specific formations (source:
Perl, 2018, with permission)
Tables
1.1 EPTS providers
1.2 EPTS providers that have achieved IMS certificate
1.3 Manufacturers that have achieved FIFA’s Quality Certificate
2.1 Validity and reliability studies of the different commercial models of semi-automatic camera systems
2.2 Rating by FIFA velocity band for the two semi-automatic camera systems subjected to EPTS performance test report
2.3 Characteristics of semi-automatic camera systems of different manufacturers
3.1 Validity and reliability results published in the scientific literature related to tracking devices with GNSS technology
3.2 Characteristics of Global Navigation Satellite Systems of different manufacturers with IMS certificate
3.3 Rating by FIFA velocity band for the five GNSS subjected to EPTS performance test report (July 1, 2019 or January 16, 2020)
4.1 Validity and reliability results published in the scientific literature related to tracking devices with LPS technology
4.2 Ratings by FIFA velocity band for the two LPS subjected to EPTS performance test report (January 16, 2020)
4.3 Characteristics of LPSs of different manufacturers
5.1 Validity and reliability results published in the scientific literature related to tracking devices with accelerometers
5.2 Proposal to evaluate the reliability and validity of accelerometry-based data
6.1 Validity and reliability of wearable monitor sensors available
7.1 Comparative table of EPTS systems used in team sports
7.2 Comparison
7.3 Comparison between sports
8.1 WBAN communication standards and technologies (Adapted from Arbia (2018))
8.2 Characteristics of devices based on LPS (extracted from Serpiello, (2019))
8.3 Characteristics of devices based on GNSS (extracted from Serpiello (2019))
9.1 Kinematical variables used to quantify external load in team sports 10.1 Social criteria to assess tactical behavior: motor interaction type 10.2 Social criteria to assess tactical behavior: number of players 10.3 Space and equipment parameters to assess tactical behavior
10.4 Tactical behavior variables based on positional data classification
11.1 Accelerometry-based external workload variables utilized in the selected studies in this systematic review (extracted from Gómez- Carmona et al., 2020a, 2020b, 2020c)
12.1 TRIMP values during training sessions and/or matches of different team sports, including male and female players
13.1 Examples of multidimensional indicators for different team sports 17.1 Selected data categories in team sports analyses
17.2 Fields of application for machine learning in positional and video data analysis
17.3 Fields of application for machine learning in player and performance
analysis
Contributors
Arnold Baca
University of Vienna, Austria Aritz Badiola Bengoa
University of Deusto, Spain Julen Badiola Martínez University of Deusto, Spain Alejandro Bastida-Castillo University of Murcia, Spain Jorge Bravo
Comprehensive Health Research Centre (CHRC), Departamento de Desporto e Saúde, Escola de Saúde e Desenvolvimento Humano, Universidade de Évora, Portugal
Miguel Ángel Casimiro University of Murcia, Spain Filipe Manuel Clemente
Instituto Politécnico de Viana do Castelo, Escola Superior de Desporto e Lazer, Portugal and Instituto de Telecomunicações, Delegação da Covilhã, Portugal
Júlio Alejandro Henriques da Costa
Portugal Football School (Portuguese Football Federation), Portugal
Orlando Fernandes
Comprehensive Health Research Centre (CHRC), Departamento de Desporto e Saúde, Escola de Saúde e Desenvolvimento Humano, Universidade de Évora, Portugal
Hugo Folgado
Comprehensive Health Research Centre (CHRC), Departamento de Desporto e Saúde, Escola de Saúde e Desenvolvimento Humano, Universidade de Évora, Portugal
Carlos D. Gómez-Carmona University of Extremadura, Spain Bruno Gonçalves
Comprehensive Health Research Centre (CHRC), Departamento de Desporto e Saúde, Escola de Saúde e Desenvolvimento Humano, Universidade de Évora, Portugal
Asier Gonzalez-Artetxe
University of of the Basque Country, Spain Asier Los Arcos
University of the Basque Country, Spain Amaia Méndez Zorrilla
University of Deusto, Spain Iñigo Orue Saiz
University of Deusto, Spain Luca Paolo Ardigò
University of Verona, Italy Paulo Pereira
Comprehensive Health Research Centre (CHRC), Departamento de
Desporto e Saúde, Escola de Saúde e Desenvolvimento Humano,
Universidade de Évora, Portugal
José Pino-Ortega
University of Murcia, Spain Pedro Reche-Soto
University of Murcia, Spain Markel Rico-González
University of the Basque Country, Spain Daniel Rojas-Valverde
National University of Costa Rica, Republic of Costa Rica Fabio Yuzo Nakamura
Federal University of Paraíba, Brazil
Part I
Data Collection Technology
1 Standardization of Electronic Performance and Tracking Systems
José Pino-Ortega and Markel Rico-González
Introduction
In the last decade, technological developments have experienced accelerated growth and evolution in team sports, and this is impacting daily work in the area of sports sciences from researchers to practitioners (Rico- González et al., 2020b; Rojas-Valverde et al., 2020). Thanks to these innovations, sports scientists and team staff members are able to make decisions based on comprehensive real-time analysis during training sessions or matches (Andreassen et al., 2019; Aughey & Falloon, 2010;
Cummins et al., 2013; Maalej et al., 2011), an aspect that is gaining the greatest importance for performance optimization and injury prevention in team sports (Dunn et al., 2018; Ehrmann et al., 2016; Rago et al., 2019;
Rico-González et al., 2020a).
Nowadays, these technologies have been used extensively in rugby, basketball, Australian football, futsal, hockey, lacrosse, cricket, and netball but, especially, in soccer (Castellano, 2014; Colby et al., 2014; Cummins et al., 2013; Gabbett, 2010; Howe et al., 2020; Petersen et al., 2009; Rago et al., 2019; Rico-González et al., 2020b; Rico-González et al., 2020c;
Vázquez-Guerrero et al., 2019), where The Fédération Internationale de Football Association (FIFA) has standardized them under the name of Electronic Performance and Tracking Systems (EPTS).
In brief, technologies are the driving force of the industry providing three main benefits: comfort, safety, and performance in both players and referees involved in the game. Electronic Performance and Tracking Systems refers to some technologies that allow these developments: Video Assistant Referee (VAR), Goal-Line Technology (GLT), and EPTS (FIFA, 2017b):
Video Assistant Referee: VAR was incorporated into the Laws of the Game in March 2018 and has three main objectives: (1) continual development of additional and more accurate information to assist the decision-making process, (2) making the review process as efficient as possible, and (3) making VAR technology more affordable to enable its use at all levels of the game (FIFA, 2018b).
Goal-Line Technology: FIFA defined GLT as a “technical means of
instantly determining whether the whole of the ball has crossed the
goal line” (FIFA, 2017a). Thanks to a camera-based system, a
magnetic field located through cables installed underground and around the goal, and the receptors located inside the ball, the match officials receive pertinent information on a watch. The GLT design avoids stoppages during the competition (FIFA, 2017a).
EPTS: FIFA and the World Players’ Union develop standards on
management of personal player information such as performance or
health. Due to the importance of this innovation both organizations
have agreed to identify and develop standards and practical
applications for the collection, protection and use of personal player-
performance data based on the General Data Protection Regulation and
Swiss Law (FIFA, 2015).
Electronic Performance and Tracking Systems
EPTS were classified into multiple high-definition semi-automatic cameras (VID), Global Positioning Systems (GPS) or Global Navigation Satellite Systems, and Local Positioning Systems (LPS) (Dunn et al., 2018; Linke et al., 2018; Rico-González et al., 2020b). Although based on FIFA’s official definition, EPTS were also considered in combination with microelectromechanical (MEMS) and other devices such as heart rate monitors.
EPTS primary track player (and ball) position but can also be used in combination with electromechanical devices (accelerometers, gyroscopes, etc.) and heart rate monitors as well as other devices to measure load or physiological parameters.
(FIFA, 2015)
Since player tracking is considered a fundamental part of contemporary
team sports players’ development, and professional soccer clubs invest
significant amounts of money in EPTS to nurture elite players (Palucci
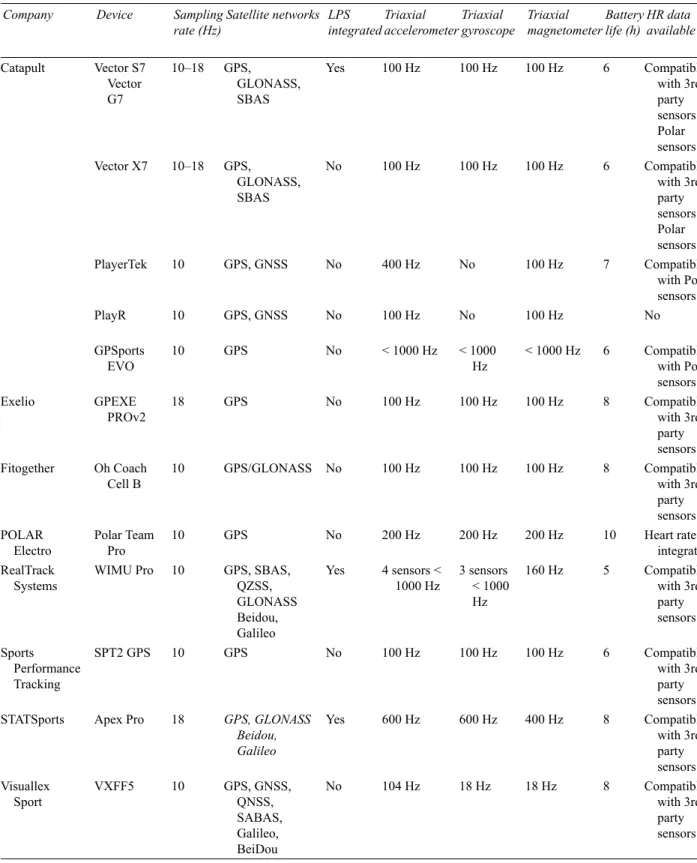
Vieira et al., 2019; Pino-Ortega & Rico-González, 2020), there are several
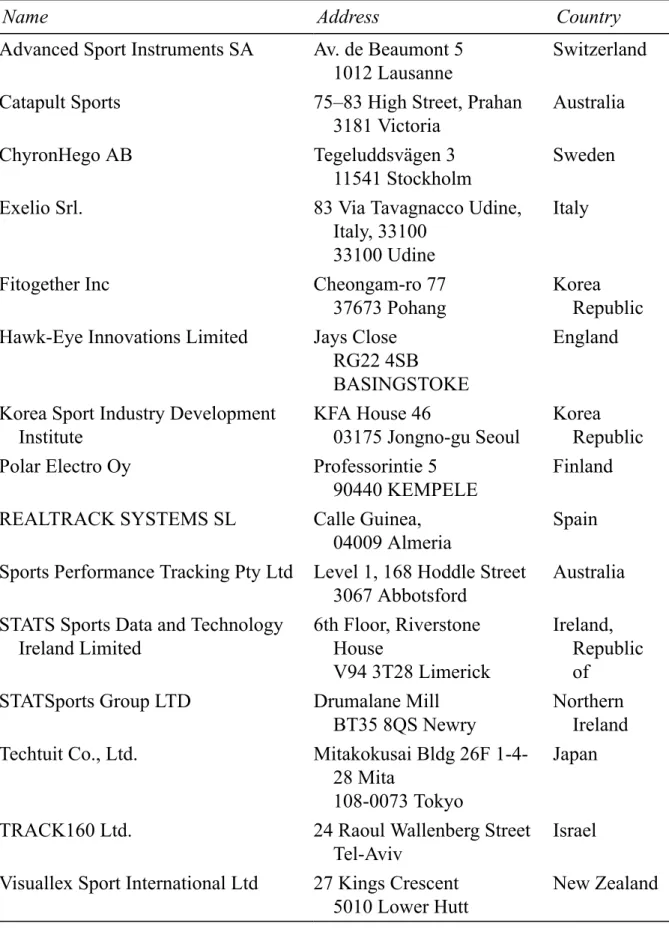
manufacturers that provide these technologies (Table 1.1) (extracted on
December 31, 2020 (FIFA, 2020b)):
Table 1.1 EPTS providers
Name Address Country
Advanced Sport Instruments SA Av. de Beaumont 5 1012 Lausanne
Switzerland
Catapult Sports 75–83 High Street, Prahan
3181 Victoria
Australia
ChyronHego AB Tegeluddsvägen 3
11541 Stockholm
Sweden
Exelio Srl. 83 Via Tavagnacco Udine,
Italy, 33100 33100 Udine
Italy
Fitogether Inc Cheongam-ro 77
37673 Pohang
Korea Republic Hawk-Eye Innovations Limited Jays Close
RG22 4SB BASINGSTOKE
England
Korea Sport Industry Development Institute
KFA House 46
03175 Jongno-gu Seoul
Korea Republic
Polar Electro Oy Professorintie 5
90440 KEMPELE
Finland
REALTRACK SYSTEMS SL Calle Guinea,
04009 Almeria
Spain Sports Performance Tracking Pty Ltd Level 1, 168 Hoddle Street
3067 Abbotsford
Australia STATS Sports Data and Technology
Ireland Limited
6th Floor, Riverstone House
V94 3T28 Limerick
Ireland, Republic of
STATSports Group LTD Drumalane Mill
BT35 8QS Newry
Northern Ireland Techtuit Co., Ltd. Mitakokusai Bldg 26F 1-4-
28 Mita
108-0073 Tokyo
Japan
TRACK160 Ltd. 24 Raoul Wallenberg Street
Tel-Aviv
Israel Visuallex Sport International Ltd 27 Kings Crescent
5010 Lower Hutt
New Zealand
Source: FIFA (2020a, 2020b).
However, until a few years ago, some federations such as the IFAB did
not allow their use during competitions, making some of these technologies
available for training sessions but not for competition (Rico-González et al.,
2020c). In 2015, as a consequence of the insistence of the clubs, the IFAB
published a circular communicating the feasibility of the use of all EPTS as
long as they were approved by the body responsible for the competition,
prohibiting them if they endangered players or referees (IFAB, 2020).
International Match Standard (IMS)
The IMS is a safety test that indicates that an EPTS has been officially tested and meets the minimum safety requirements of the IMS developed by FIFA and approved by the IFAB (FIFA, 2018a).
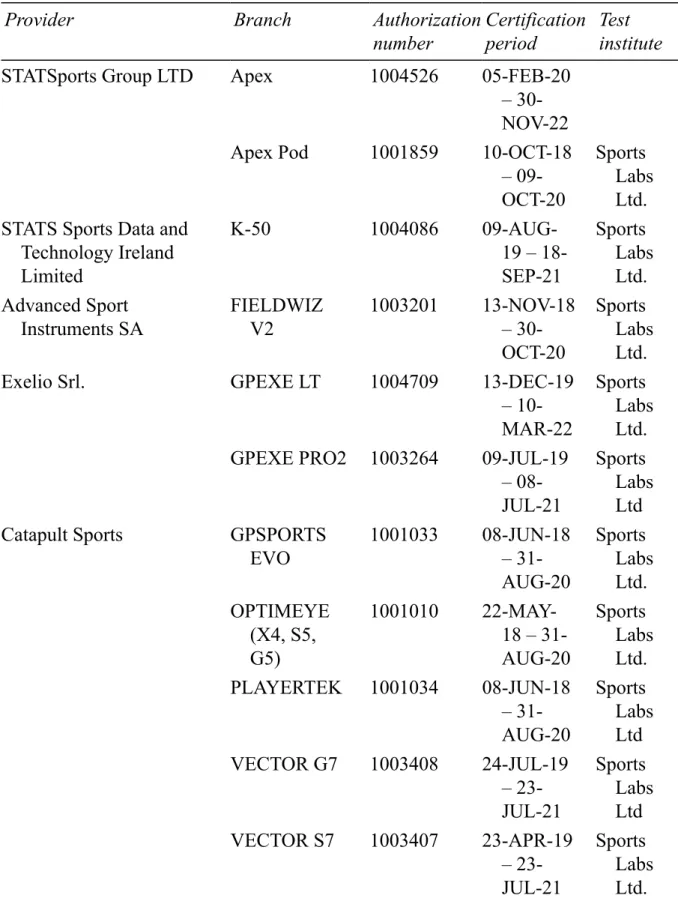
To achieve an IMS certificate, a device must undergo a set of tests carried
out in an independent laboratory. Table 1.2 shows those wearable systems
that have achieved an IMS certificate (FIFA, 2018a).
Table 1.2 EPTS providers that have achieved IMS certificate
Provider Branch Authorization
number
Certification period
Test institute
STATSports Group LTD Apex 1004526 05-FEB-20
– 30- NOV-22
Apex Pod 1001859 10-OCT-18
– 09- OCT-20
Sports Labs Ltd.
STATS Sports Data and Technology Ireland Limited
K-50 1004086 09-AUG-
19 – 18- SEP-21
Sports Labs Ltd.
Advanced Sport Instruments SA
FIELDWIZ V2
1003201 13-NOV-18 – 30- OCT-20
Sports Labs Ltd.
Exelio Srl. GPEXE LT 1004709 13-DEC-19
– 10- MAR-22
Sports Labs Ltd.
GPEXE PRO2 1003264 09-JUL-19 – 08- JUL-21
Sports Labs Ltd
Catapult Sports GPSPORTS
EVO
1001033 08-JUN-18 – 31- AUG-20
Sports Labs Ltd.
OPTIMEYE (X4, S5, G5)
1001010 22-MAY- 18 – 31- AUG-20
Sports Labs Ltd.
PLAYERTEK 1001034 08-JUN-18
– 31- AUG-20
Sports Labs Ltd
VECTOR G7 1003408 24-JUL-19
– 23- JUL-21
Sports Labs Ltd
VECTOR S7 1003407 23-APR-19
– 23- JUL-21
Sports
Labs
Ltd.
Provider Branch Authorization number
Certification period
Test institute
VECTOR X7 1003268 09-JUL-19
– 08- JUL-21
Sports Labs Ltd.
REALTRACK SYSTEMS SL
WIMU PRO 1001630 15-MAY-
18 – 31- AUG-20
Sports Labs Ltd.
Fitogether Inc OhCoach Cell
B
1001548 09-AUG- 18 – 31- AUG-20
Sports Labs Ltd.
Polar Team Pro POLAR
TEAM PRO
1003769 14-AUG- 19 – 10- SEP-21
Sports Labs Ltd Sports Performance
Tracking Pty Ltd
SPT 2 GPS TRACKER
1004266 04-DEC-19 – 03- DEC-21
Sports Labs Ltd.
Visuallex Sport International Ltd
VX FF5 1003768 12-AUG-
19 – 10- SEP-21
Sports Labs Ltd.
Korea Sport Industry Development Institute
ZEUS S 1004552 17-JAN-20
– 17- JAN-22
Sports Labs Ltd.
Source: FIFA (2020b).
However, the IMS must not be understood in any case as an evaluation of
the quality of the data. In order to assist leagues and competition organizers
in the use of EPTS, FIFA (approved by the IFAB) adds a reference standard
that guarantees the accuracy of an EPTS.
FIFA’s Quality Certificate
FIFA’s Quality Certificate assesses EPTS validity, that is, the agreement between the observed value and the true or criterion value of a measure (Hopking, 2000). Those EPTS providers that want to test and certify their product to the FIFA standard should follow four steps (FIFA, 2020a):
1. Product development: the EPTS provider should submit all requested information about the product that they want to test to [email protected].
2. Impact test: the provider should send wearable units to the Accredited Test Institute in accordance with the test protocol. Moreover, providers should comply with two conditions: the pledge from the World Federation of the Sporting Goods Industry and product liability insurance.
3. Performance test (step 3): each provider is required to participate at an event on site with their EPTS. All those providers that pass an annual Performance Test have their system certified for two years and published on the FIFA website (FIFA, 2020b).
The Performance Standard Test is composed of five tests: (1) circuit, (2) 2vs2 game, (3) 3vs3 game, (4) 5vs5 game and (5) full pitch coverage. The circuit test is on a track in an area of 25×25 meters and includes self-paced walking, self-paced jogging, maximal accelerations and changes of direction, and must have a minimum duration of 4 minutes per participant.
The small-sided games (2, 3 and 4) are played in an area of 25×25 meters in which players attempt to maintain ball possession without the possibility of scoring during 4 minutes. Finally, in full pitch coverage, the athletes should jog along internal lines of the pitch to ensure the full pitch is covered by manufacturers’ devices (FIFA, 2020a).
The outcomes are tested against two systems: (a) Vicon as the globally
recognized gold standard for motion capture, and (b) the Vision Kit system,
which utilizes labor-intensive methods to track players over the full size of
the pitch. The differences between manufacturer’s and motion
capture/computer vision data for both position (in m) and velocity (m.s-1)
in five zones (Z1: 0–7 km/h; Z2: 7–15 km/h; Z3: 15–20 km/h; Z4: 20–25
km/h; Z5: >25 km/h) are assessed for absolute and relative data. To
determine the level of agreement between the two sources, for the velocity, the root-mean-square difference (RMSD) is obtained between the two forms of the raw data; and mean absolute error is suitable for the position.
The data report is shown as a histogram and a grid of the capture space in 1×1 m bins. The criteria for product accreditation are: (a) Well Above, Q1 minus 1.5*IQR to 25th percentile; (b) Above, 25th percentile to median; (c) Standard, median to 75th percentile; (d) Below, 75th percentile to Q3 + 1.5*IQR; (e) Well Below, everything greater than below.
EPTS performance test reports can be found in the list available on November 21, 2020 at https://football-technology.fifa.com/en/media- tiles/fifa-quality-performance-reports-for-epts/. Find below a list of the current FIFA Quality Performance certified systems (Table 1.3).
4. Certification: those providers who decide to become a licensee and gain certification for their EPTS have two options: a commercial or non-commercial agreement.
Table 1.3 Manufacturers that have achieved FIFA’s Quality Certificate
EPTS Provider Branch
VID ChyronHego TRACAB Gen5
Hawk-Eye Ball & Player Tracking Instant Instant Fitness
Track160 Coach160
GPS/GNSS Catapult S5
Catapult Vector
Fitogether OhCoach Cell B Realtrack Systems WIMU PRO
STATSports Apex
LPS Catapult Vector
Realtrack Systems WIMU PRO
Key Points
Applied technology in team sports has grown exponentially, facilitating
decision- making based on objective data. To date, the FIFA Football
Technology Innovation Department is working on the standardization of
EPTS though two certificates: (1) Wearable Safety Test (IMS) and (2)
Performance Standard Test (FIFA Quality).
References
Andreassen, K., Johansen, D., Johansen, H., Baptista, I., Pettersen, S. A., Riegler, M.,
& Halvorsen, P. (2019). Real-Time Analysis of Physical Performance Parameters in Elite Soccer. 2019 International Conference on Content-Based Multimedia Indexing (CBMI), 1–6. doi:10.1109/CBMI.2019.8877422
Aughey, R. J., & Falloon, C. (2010). Real-Time Versus Post-Game GPS Data in Team Sports. Journal of Science and Medicine in Sport, 13(3), 348–349.
doi:10.1016/j.jsams.2009.01.006
Castellano, J. (2014). Deporte con dispositivos de posicionamiento global (GPS):
Aplicaciones y limitaciones. Revista de Psicología del Deporte., 23, 10.
Colby, M. J., Dawson, B., Heasman, J., Rogalski, B., & Gabbett, T. J. (2014).
Accelerometer and GPS-Derived Running Loads and Injury Risk in Elite Australian Footballers. Journal of Strength and Conditioning Research, 28(8), 2244–2252.
doi:10.1519/JSC.0000000000000362
Cummins, C., Orr, R., O’Connor, H., & West, C. (2013). Global Positioning Systems (GPS) and Microtechnology Sensors in Team Sports: A Systematic Review. Sports Medicine, 43(10), 1025–1042. doi:10.1007/s40279-013-0069-2
Dunn, M., Hart, J., & James, D. (2018). Wearing Electronic Performance and Tracking System Devices in Association Football: Potential Injury Scenarios and Associated Impact Energies. Proceedings, 2(6), 232. doi:10.3390/proceedings2060232
Ehrmann, F. E., Duncan, C. S., Sindhusake, D., Franzsen, W. N., & Greene, D. A.
(2016). GPS and Injury Prevention in Professional Soccer. Journal of Strength and Conditioning Research, 30(2), 360–367. doi:10.1519/JSC.0000000000001093 FIFA. (2015). EPTS Electronic Performance and Tracking Systems. Retrieved from:
https://football-technology.fifa.com/en/media-tiles/epts/
FIFA. (2017a). FIFA Quality Programme for Goal Line Technology. Retrieved from:
https://football-technology.fifa.com/en/media-tiles/fifa-quality-programme-for-goal- line-technology/
FIFA. (2017b). Football Technology. Retrieved from: https://football- technology.fifa.com/en/media-tiles/epts-fifa-announces-dates-for-epts-testing-2019/
FIFA. (2018a). About the IMS Standard for Wearable Tracking Devices. Football Technology. Retrieved from: https://football-technology.fifa.com/en/media- tiles/about-the-ims- standard-for-wearable-tracking-devices/
FIFA. (2018b). Video Assistant Referees (VAR). Football Technology. Retrieved
from: https://football-technology.fifa.com/en/media-tiles/video-assistant-referee-
var/
FIFA. (2020a). FIFA Quality Programme for Electronic Performance Tracking Systems (EPTS). How to Obtain Certification for EPTS. Retrieved from:
https://football-technology. fifa.com/media/172224/how-to-obtain-epts- certification-v14.pdf
FIFA. (2020b). Football Technology Resource Hub. Retrieved from: https://football- technology.fifa.com/en/resource-hub/certified-product-database/football-
technologies/epts/providers/
Gabbett, T. J. (2010). GPS Analysis of Elite Women’s Field Hockey Training and Competition. The Journal of Strength & Conditioning Research, 24(5), 4.
doi:10.1519/JSC.0b013e3181ceebbb
Hopking, W. (2000). Measures of Reliability in Sports Medicine and Science. Sports Medicine, 30(1), 1–15.
Howe, S. T., Aughey, R. J., Hopkins, W. G., Cavanagh, B. P., & Stewart, A. M.
(2020). Sensitivity, Reliability and Construct Validity of GPS and Accelerometers for Quantifying Peak Periods of Rugby Competition. PLoS One, 15(7), e0236024.
doi:10.1371/journal.pone.0236024
IFAB. (2020). Laws of the Game. Retrieved from: https://static- 3eb8.kxcdn.com/filesdocument-category/062020/fXHLhQuMmtekmfe.pdf
Linke, D., Link, D., & Lames, M. (2018). Validation of Electronic Performance and Tracking Systems EPTS Under Field Conditions. PLoS One, 13(7), e0199519.
doi:10.1371/journal.pone.0199519
Maalej, L., Battikh, T., & Jabri, I. (2011). Basketball Game Systems Identification by Real Time Video Processing. IETE Journal of Research, 57(6), 491.
doi:10.4103/0377-2063.92265
Palucci Vieira, L., Carling, C., Barbieri, F., Aquino, R., & Santiago, P. (2019). Match Running Performance in Young Soccer Players: A Systematic Review. Sports Medicine, 49(2), 28–318. doi:10.1007/s40279-018-01048-8
Petersen, C., Pyne, D., Portus, M., & Dawson, B. (2009). Validity and Reliability of GPS Units to Monitor Cricket-Specific Movement Patterns. International Journal of Sports Physiology and Performance, 4(3), 381–393. doi:10.1123/ijspp.4.3.381 Pino-Ortega, J., & Rico-González, M. (2020). Review of Ultra-Wide Band in Team
Sports. In UWB Technology (p. 14). IntechOpen.
Rago, V., Brito, J., Figueiredo, P., Costa, J., Barreira, D., Krustrup, P., & Rebelo, A.
(2019). Methods to Collect and Interpret External Training Load Using Microtechnology Incorporating GPS in Professional Football: A Systematic Review. Research in Sports Medicine, 1–22. doi:10.1080/15438627.2019.1686703 Rico-González, M., Los Arcos, A., Rojas-Valverde, D., Clemente, F. M., & Pino-
Ortega, J. (2020a). A Survey to Assess the Quality of the Data Obtained by Radio-
Frequency Technologies and Microelectromechanical Systems to Measure External Workload and Collective Behavior Variables in Team Sports. Sensors, 20(8), 2271.
Rico-González, M., Pino-Ortega, J., Clemente, F. M., & Los Arcos, A. (2020b). A Systematic Review of Collective Tactical Behaviour in Futsal Using Positional Data. Biology of Sport, 14.
Rico-González, M., Pino-Ortega, J., Nakamura, F. Y., Moura, F. A., Rojas-Valverde, D., & Los Arcos, A. (2020c). Past, Present, and Future of the technological Tracking Methods to Assess Tactical Variables in Team Sports: A Systematic Review. Proceedings of the Institution of Mechanical Engineers, Part P: Journal of Sports Engineering and Technology, 175433712093202.
doi:10.1177/1754337120932023
Rojas-Valverde, D., Pino-Ortega, J., Gómez-Carmona, C. D., & Rico-González, M.
(2020). A Systematic Review of Methods and Criteria Standard Proposal for the Use of Principal Component Analysis in Team’s Sports Science. International Journal of Environmental Research and Public Health, 17(23), 8412.
Vázquez-Guerrero, J., Fernández-Valdés, B., Jones, B., Moras, G., Reche, X., &
Sampaio, J. (2019). Changes in physical demands between game quarters of U18 elite official basketball games. PLoS One, 14(9), e0221818.
doi:10.1371/journal.pone.0221818
2 Semi-Automatic Multiple Camera Systems
Alejandro Bastida-Castillo, José Pino-Ortega, Markel Rico-González and Carlos D. Gómez- Carmona
Introduction
Data collection on physical and/or kinematic demands of the athlete has been a highly pursued endeavor by numerous coaches, trainers and sport scientist throughout almost all of its modern history (Paulis & Gómez, 2014).
The birth of current methods occurred in 1950, with the collection of information about the game in professional soccer with pencil and paper (Pollard, 2002). This method is referred to as notational analysis and is often recommended to coaches as an inexpensive way of providing insight into the physiological and technical demands of physical and sport activities by recording the player movement patterns that characterize skilled performance (Hughes & Franks, 2004; Pollard, 2002). That is, it is characterized by being a simple, laborious and cost-free analysis method. Racket sports and soccer represent the most commonly analyzed sports using notational analysis (Hughes & Franks, 2004). Among them, video-based manual monitoring methods arose in which a researcher subjectively quantified the athlete’s movements, as well as their frequency and duration (Hong et al., 1996).
A potential limitation of notational methods as described so far is the reliability of the data entry procedure or the researcher’s ability to reproduce the observed value when the measure is repeated (Hughes & Franks, 2004). In contrast, in the last two decades, automatic motion tracking systems have been developed which do not require human operators to locate manually, and continually record, the position of the tracked object. However, to the authors’ knowledge, a completely automated system for analyzing sport performance is not yet commercially available. Thus, they are more precisely referred to as semi-automatic multiple camera systems, and generally referred to by FIFA as optical-based camera systems (FIFA, 2015).
The operation of these systems involves several steps (which we will present in more detail below). In summary, the initial stage of semi-automatic tracking is the detection of moving targets in the captured images. These images must then be processed and segmented before shape models are fitted and the foreground shapes are extracted from the overall image. Further filtering and tracking methods are then used to predict the future locations and shapes of the tracked object (Needham, 2003).
In this way, the semi-automatic multiple camera system can be defined as a monitoring system of the athlete’s action, a ball, or an implement that records the information in a semi-automatic way. This technique has evolved considerably since Van Gool et al. (1988) used it at the end of the 1980s to analyze soccer players’ performance.
Obviously, there were numerous limitations associated with this manual video tracking technique, and now elite soccer teams use expensive and more functional semi-automated camera systems. To understand the characteristics of these systems, it is convenient to consider the different elements that influence their measurement, such as (i) the type of information that you intend to obtain (time-motion analysis, position of players on the pitch, tactical analysis), (ii) the type of system or commercial model, (iii) the performance of currently available algorithms, as well as (iv) different defects or limitations (such as the high cost, variable capture areas and lighting conditions, occlusion among players, and the need for multiple cameras). However, despite these drawbacks, this system is considered the most accurate and valid of time-motion and players’ positioning monitoring systems (Bradley et al., 2009; Di Salvo et al., 2009).
Although these systems could be used in any sports field, their use is developing almost exclusively in elite soccer, mainly motivated by their high cost of acquisition and use, as well as the usefulness and implementation of the information obtained. For about 20 years now, clubs have been recording information on the physical, technical and tactical performance of their players. Some of this information has been published in scientific journals and researchers can study it in the English Premier League (Di Salvo et al., 2009), Italian Serie A (Vigne et al., 2010), Spanish La Liga (Zubiaga, 2006), French Ligue 1 (Dellal et al., 2010), German Bundesliga (Dellal, 2008), as well as European matches in the UEFA Champions League (Bradley et al., 2014; Di Salvo et al., 2010) and international matches in the UEFA European Championships (Braz et al., 2010). Taking into account that any professional soccer team has a monitoring system nowadays (Buchheit et al., 2014; Buchheit & Simpson, 2016), it is noteworthy that many clubs carry out their own internal analysis of this information.
Validity and Reliability
As we have seen in Chapter 1, the scientific studies on the validity and reliability of GPS and LPS technology are numerous and have been increasing in recent years. In the case of the semi-automatic camera systems, they are not as numerous compared to the former. However, there is an increasing number of studies that are using such technology, especially Amisco® and Prozone®. Although the majority of studies are conducted to provide relevant information about performance analysis as well as physical performance of elite players in domestic and international competitions, there are a few studies that analyze the validity and reliability of these systems. The first study in this regard was verified by Di Salvo et al. (2006). The last ten years have seen a subsequent increase in the number of publications (>50) using this system. A few of these studies, measure the validity and reliability of the instrument used (n=4).
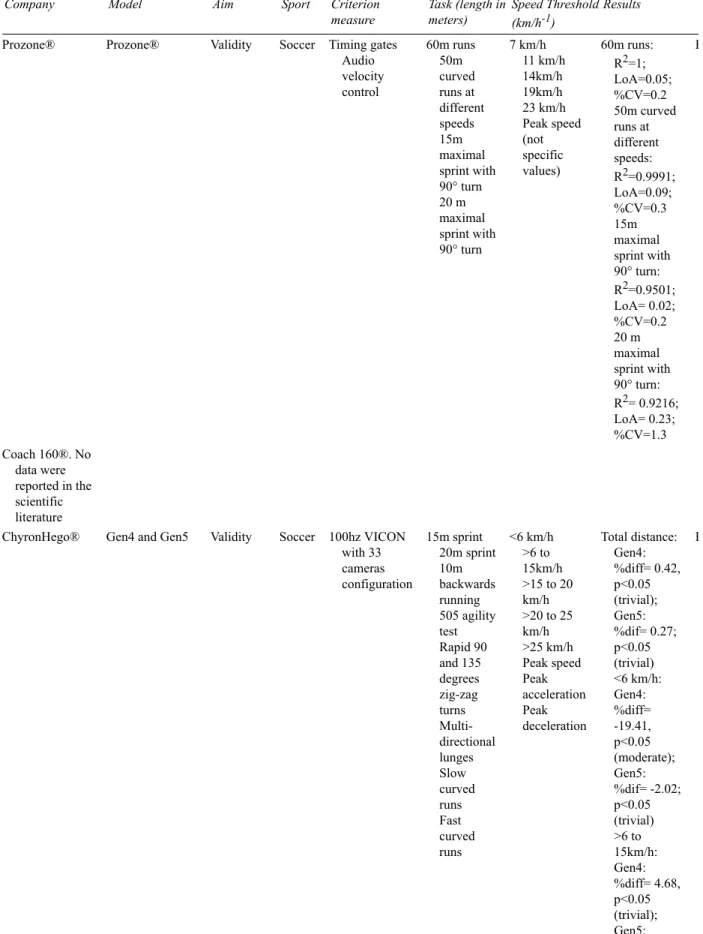
The commercial models of semi-automatic camera systems that are presented below (Table 2.1) demonstrate acceptable validity for different purposes in soccer. It is remarkable that all the experimental protocols used in the mentioned studies were carried out in the context of soccer. The high cost of the system could be the logical explanation. Prozone® and Venatrack® use a homologous experimental protocol and purpose validity analysis, and both were confirmed as valid systems to measure speed in specific movements at the different ranges of speed common in soccer. Only the ChyronHego® system was assessed using a VICON system as the criterion measure allowing an analysis of the position of the players. The conclusion was an acceptable validity for this purpose.
Table 2.1 Validity and reliability studies of the different commercial models of semi-automatic camera systems
Company Model Aim Sport Criterion
measure Task (length in
meters) Speed Threshold (km/h-1)
Results C
Prozone® Prozone® Validity Soccer Timing gates
Audio velocity control
60m runs 50m curved runs at different speeds 15m maximal sprint with 90° turn 20 m maximal sprint with 90° turn
7 km/h 11 km/h 14km/h 19km/h 23 km/h Peak speed (not specific values)
60m runs:
R2=1;
LoA=0.05;
%CV=0.2 50m curved runs at different speeds:
R2=0.9991;
LoA=0.09;
%CV=0.3 15m maximal sprint with 90° turn:
R2=0.9501;
LoA= 0.02;
%CV=0.2 20 m maximal sprint with 90° turn:
R2= 0.9216;
LoA= 0.23;
%CV=1.3 P
Coach 160®. No data were reported in the scientific literature
ChyronHego® Gen4 and Gen5 Validity Soccer 100hz VICON with 33 cameras configuration
15m sprint 20m sprint 10m backwards running 505 agility test Rapid 90 and 135 degrees zig-zag turns Multi- directional lunges Slow curved runs Fast curved runs
<6 km/h
>6 to 15km/h
>15 to 20 km/h
>20 to 25 km/h
>25 km/h Peak speed Peak acceleration Peak deceleration
Total distance:
Gen4:
%diff= 0.42, p<0.05 (trivial);
Gen5:
%dif= 0.27;
p<0.05 (trivial)
<6 km/h:
Gen4:
%diff=
-19.41, p<0.05 (moderate);
Gen5:
%dif= -2.02;
p<0.05 (trivial)
>6 to 15km/h:
Gen4:
%diff= 4.68, p<0.05 (trivial);
Gen5:
B
Company Model Aim Sport Criterion measure
Task (length in meters)
Speed Threshold (km/h-1)
Results C
%dif= 0.61;
p<0.05 (trivial)
>15 to 20 km/h: Gen4:
%diff= 7.52, p<0.05 (trivial);
Gen5:
%dif= -1.58;
p<0.05 (trivial)
>20 to 25 km/h: Gen4:
%diff= 8.94, p<0.05 (small);
Gen5:
%dif= 4.98;
p<0.05 (trivial)
>25 km/h:
Gen4:
%diff=
-9.13, p<0.05 (trivial);
Gen5:
%dif= -0.49;
p>0.05 (trivial) Peak speed:
Gen4:
%diff= 1.13, p<0.05 (trivial);
Gen5:
%dif= 0.14;
p>0.05 (trivial) Peak acceleration:
Gen4:
%diff=
-0.13, p>0.05 (trivial);
Gen5:
%dif= -0.33;
p>0.05 (trivial) Peak deceleration:
Gen4:
%diff= 0.49, p>0.05 (trivial);
Gen5:
%dif= 0.42;
Company Model Aim Sport Criterion measure
Task (length in meters)
Speed Threshold (km/h-1)
Results C
p>0.05 (trivial) Venatrack® Venatrack® Validity Soccer Timing gates 60m runs
50m runs with 45°
curve 15m sprint 30m dribble 10m run with 90°
turn Game- specific runs
7km/h 11km/h 14km/h 19km/h 23km/h
All tests: Mean difference=
−0.25; R2= 1.00; %CV=
1.8
V
DigitalStadium® DigitalStadium® Reliability Soccer Replication 2016 season of Italian Serie A
Not relevant R2= 0–89 to 1.00; %CV
= 0 to 0.7;
ICC 0.96 to 1.
D
Mediacoach® Mediacoach® Validity Soccer GPS (Apex 10Hz)
2017–2018 season of Spanish La Liga
14 to 21 km/h 21 to 24 km/h
>24 km/h
Total distance:
Bias=0.00 14 to 21 km/h:
Bias=0.24 21 to 24 km/h:
Bias=0.06
>24 km/h:
Bias=0.47 M
Notes: R2: Pearson product moment correlation; LoA: Limits of Agreement; %CV: Percentage of Coefficient of Variation; %Diff:
Percentage of difference.
In this regard, these systems are used with two objectives: (i) performance analysis in sport and (ii) the use of the data on performance analysis for scientific purposes. Generally, the first is only common in professional team sport, but the second can be conducted by both sport teams and research groups. In fact, this type of equipment is increasingly found in sports science laboratories.
The different commercial models of semi-automatic camera systems always present their values of accuracy in the information on the system. Sometimes, this report is accompanied by a scientific method, published in scientific journal that is peer-reviewed by experts in this topic and statistical method, something that suggests greater rigor in obtaining the results. In any case, subjecting a measurement system to a concurrent validity analysis is considered necessary for research purposes (Carling et al., 2008), although it is not necessary for the first use mentioned above.
EPTS Performance Test Report
The following are the optical-based tracking systems:
ChyronHego – TRACAB Gen5 (OTS) Track160 – Coach160 (OTS)
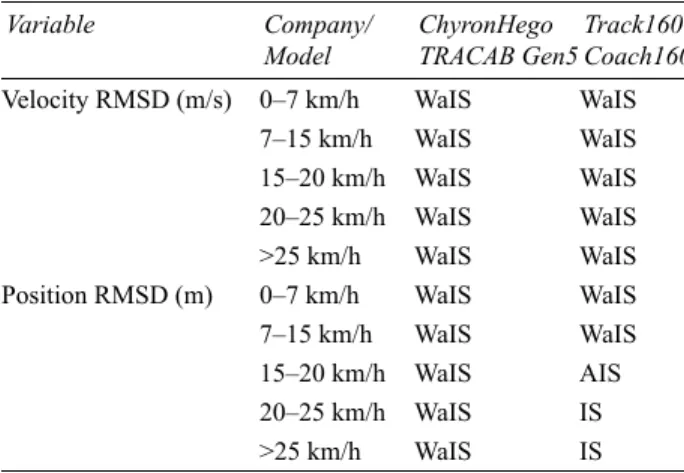
The results of the two tracking systems are summarized in Table 2.2. As we can see, the results reported according to the FIFA certificate for both systems were very satisfactory, obtaining, according to the interpretation of these reports, the best result in all the parameters for the CyronHego® system and almost perfect for the Track160®
system. The data were at the industry standard when tests measured position RMSD at speeds greater than 15 km/h.
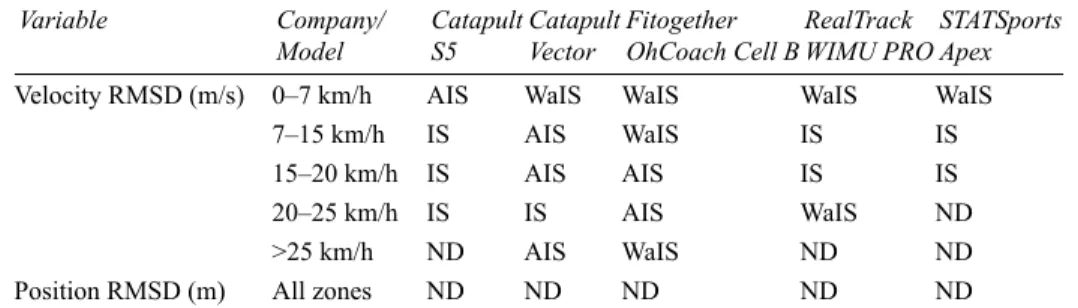
Table 2.2 Rating by FIFA velocity band for the two semi-automatic camera systems subjected to EPTS performance test report
Variable Company/
Model ChyronHego
TRACAB Gen5Track160 Coach160
Velocity RMSD (m/s) 0–7 km/h WaIS WaIS
7–15 km/h WaIS WaIS
15–20 km/h WaIS WaIS
20–25 km/h WaIS WaIS
>25 km/h WaIS WaIS
Position RMSD (m) 0–7 km/h WaIS WaIS
7–15 km/h WaIS WaIS
15–20 km/h WaIS AIS
20–25 km/h WaIS IS
>25 km/h WaIS IS
Notes: RMSD: Root mean square difference; WaIS: Well above industry standard; AIS: Above industry standard; IS: Industry standard; BIS: Below industry standard; WbIS: Well below industry standard. N/A: No comparison available due to velocities not being achieved by participants.
Manufacturer Characteristics
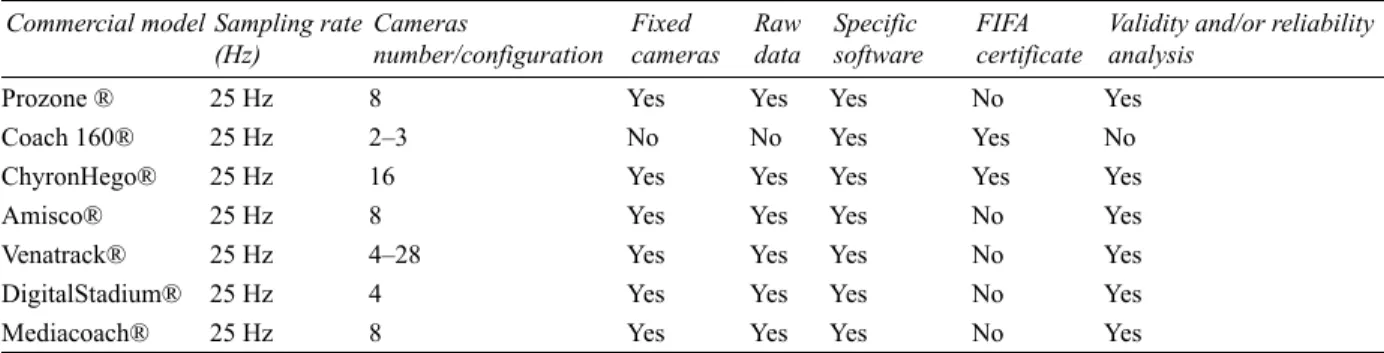
There are several semi-automatic camera systems that now exist on the commercial market providing different features of player tracking capacity (Needham, 2003). Below, examples of these systems will be introduced, and their common advantages and disadvantages will be summarized (Barris & Button, 2008; D’Orazio & Leo, 2010) (Table 2.3).
Table 2.3 Characteristics of semi-automatic camera systems of different manufacturers Commercial model Sampling rate
(Hz) Cameras
number/configuration Fixed
cameras Raw
data Specific
software FIFA
certificate Validity and/or reliability analysis
Prozone ® 25 Hz 8 Yes Yes Yes No Yes
Coach 160® 25 Hz 2–3 No No Yes Yes No
ChyronHego® 25 Hz 16 Yes Yes Yes Yes Yes
Amisco® 25 Hz 8 Yes Yes Yes No Yes
Venatrack® 25 Hz 4–28 Yes Yes Yes No Yes
DigitalStadium® 25 Hz 4 Yes Yes Yes No Yes
Mediacoach® 25 Hz 8 Yes Yes Yes No Yes
Only sport performance analysis systems without requirements to wear additional transmitting devices were included in the present section because they are instruments that are allowed by FIFA and consequently can be used in official competitions. The French company AmiscoTM and the UK-based ProzoneTM are specifically applied to elite soccer and currently provide services to elite European teams.
AmiscoTM (Sport Universal, Nice, France) offers a passive tracking system that measures players, ball, and/or referees on the soccer pitch. Sampling is at 25 Hz, and real-time information is provided from the multiple capture systems installed around the stadium. Operators are required to monitor all events, such as fouls, off sides and cautions that occur throughout the game (Setterwall et al., 2003).
Similarly, ProZoneTM (West Yorkshire, England) is another video tracking system designed for the analysis of soccer performance that requires an elaborate multi-camera system that is custom fitted at sports stadia. The footage from these cameras is used by the ProzoneTM company to track player positions manually over quadrants that make up the total playing area. The positional information of each player is then used to provide valuable statistics to the coaching staff (Needham, 2003).
Other companies started more recently to use similar passive technologies including VenatrackTM, TracabTM, and DigitalStadiumTM. The first can track players monitored in real time (at 25 Hz) providing identification through recognition algorithms (based on x, y and z coordinates for hands, feet, head and the pelvis and shoulder lines; Venatrack, UK). The system has a 28-camera configuration for maximum accuracy. TRACAB, with its Gen 5 version, provides a 25 Hz image-based performance monitoring system. The system is usually made up of 16 cameras and allows monitoring of players, the ball and/or referees. Finally, Digital.StadiumTM commercialized by SICS (Sport Information & Consultancy Services, Bassano, Italy) is currently used by a number of professional soccer teams and by the Italian national football federation. This system can offer indications about the game style and strategies adopted (technical and tactical analysis) by professional teams during national and international competitions (Beato et al., 2018).
Lessons Learned and Concluding Remarks
Different recommendations are given for the use of semi-automatic camera systems for load monitoring in sport:
Semi-automatic camera systems have characteristics than must be known previous to their use in professional sport.
All of the commercial models of semi-automatic camera systems were assessed for validity and/or reliability and reported as acceptable instruments for monitoring at least some kind of soccer performance analysis.
The FIFA certificate provides us with rigorous information about the operation of the system in soccer, and only ChyronHego® and Track 160® have obtained it.
The greatest advantage of semi-automatic camera systems was their accuracy and the reliability of the data obtained with strict manufacturers’ recommendations.
The greatest disadvantage of semi-automatic camera systems was their high cost and the complexity of their operation and data extraction.
References
Barris, S., & Button, C. (2008). A review of vision-based motion analysis in sport. Sports Medicine, 38(12), 1025–1043. doi:0112- 1642/08/0012-1025/$48.00/0
Beato, M., Jamil, M., & Devereux, G. (2018). The reliability of technical and tactical tagging analysis conducted by a semi- automatic VTS in soccer. Journal of Human Kinetics, 62(1), 103–110. doi:10.1515/hukin-2017-0162
Bradley, P. S., Dellal, A., Mohr, M., Castellano, J., & Wilkie, A. (2014). Gender differences in match performance characteristics of soccer players competing in the UEFA Champions League. Human Movement Science, 33, 159–171.
doi:10.1016/j.humov.2013.07.024
Bradley, P. S., Sheldon, W., Wooster, B., Olsen, P., Boanas, P., & Krustrup, P. (2009). High-intensity running in English FA Premier League soccer matches. Journal of Sports Sciences, 27(2), 159–168. doi:10.1080/02640410802512775
Braz, T. V., Spigolon, L. M. P., Vieira, N. A., & Borin, J. P. (2010). Modelo competitivo da distancia percorrida por futebolistas na Uefa Euro 2008. Revista Brasileira de Ciências do Esporte, 31(3), 177–191. doi:10.1590/S0101-32892010000300012
Buchheit, M., Haddad, H. A., Simpson, B. M., Palazzi, D., Bourdon, P. C., Salvo, V. D., & Mendez-Villanueva, A. (2014).
Monitoring accelerations with GPS in football: Time to slow down? International Journal of Sports Physiology and Performance, 9(3), 442–445. doi:10.1123/ijspp.2013-0187
Buchheit, M., & Simpson, B. M. (2016). Player tracking technology: Half-full or half-empty glass? International Journal of Sports Physiology and Performance, 1–23. doi:10.1123/ijspp.2016-0499
Carling, C., Bloomfield, J., Nelsen, L., & Reilly, T. (2008). The role of motion analysis in elite soccer: Contemporary performance measurement techniques and work rate data. Sports Medicine, 38(10), 839–862. doi:10.2165/00007256-200838100-00004 Dellal, A. (2008). Analyse de l’activité physique du footballeur et de ses conséquences dans l’orientation de l’entraînement:
Application spécifique aux exercices intermittents courses à haute intensité et aux jeux réduits. En Http://www.theses.fr.
Strasbourg 2. http://www.theses.fr/2008STR20071
Dellal, A., Wong, D. P., Moalla, W., & Chamari, K. (2010). Physical and technical activity of soccer players in the French First League—With special reference to their playing position. International SportMed Journal, 11(2), 278–290.
Di Salvo, V., Gregson, W., Atkinson, G., Tordoff, P., & Drust, B. (2009). Analysis of high intensity activity in premier league soccer. International Journal of Sports Medicine, 30(03), 205–212. doi:10.1055/s-0028-1105950
Di Salvo, Valter, Adam, C., Barry, M., & Marco, C. (2006). Validation of Prozone®: A new video-based performance analysis system. International Journal of Performance Analysis in Sport, 6(1), 108–119.
Di Salvo, Valter, Baron, R., González-Haro, C., Gormasz, C., Pigozzi, F., & Bachl, N. (2010). Sprinting analysis of elite soccer players during European Champions League and UEFA Cup matches. Journal of Sports Sciences, 28(14), 1489–1494.
doi:10.1080/02640414.2010.521166.
D’Orazio, T., & Leo, M. (2010). A review of vision-based systems for soccer video analysis. Pattern Recognition, 43(8), 2911–
2926. doi:10.1016/j.patcog.2010.03.009
Felipe, J. L., Gacia-Unanue, J., Viejo-Romero, D., Navandar, A., Sánchez-Sánchez, J. (2019). Validation of a video-based performance analysis system (Mediacoach®) to analyze the physical demands during matches in LaLiga. Sensors, 19 (19), 4113–4119. doi:10.3390/s19194113
FIFA. (2015). The Approval of Electronic Performance Tracking Systems (EPTS) Devices. Zurich Switzerland: Federation Internationale de Football Association. Circular No.: 1494.
Hong, Y., Robinson, P. D., Chan, W. K., Clark, C. R., & Choi, T. (1996). Notational analysis on game strategy used by the world’s top male squash players in international competition. Australian Journal of Science and Medicine in Sport, 28(1), 18–23.
Hughes, M., & Franks, I. M. (2004). Notational Analysis of Sport: Systems for Better Coaching and Performance in Sport.
Psychology Press. https://books.google.es/books?hl=es&lr=&id=4EZZvUcVJmUC&oi=fnd&pg=PR9&dq=Notational+
Analysis+of+Sport&ots=-hq21ABBa9&sig=R3vcqgYHBAm_b-t5hkZVYOedabY
Linke, D., Link, D., & Lames, M. (2020). Football-specific validity of TRACAB’s optical video tracking systems. PLoS One, 15(3). doi:10.1371/journal.pone.0230179
Needham, C. J. (2003). Tracking and Modelling of Team Game Interactions. Leeds: University of Leeds.
Paulis, J. C., & Gómez, D. C. (2014). Alternativas en la monitorización de las demandas físicas en fútbol: pasado, presente y futuro. Revista Española de Educación Física y Deportes, 404(18), 41–58.
Pollard, R. (2002). Pioneer of notational and performance analysis in football. Journal of Sports Sciences, 20(10), 853–855.
doi:10.1080/026404102320675684
Redwood-Brown, A., Cranton, W., & Sunderland, C. (2012). Validation of a real-time video analysis system for soccer.
International Journal of Sports Medicine, 33(08), 635–640. doi:10.1055/s-0032-1306326
Setterwall, D., Balsom, P., Walldius, Å., & Sundblad, Y. (2003). Computerised Video Analysis of Football – Technical and Commercial Possibilities for Football Coaching. 60. Sweden: University of Stockholm.
Van Gool, D., Van Gerven, D., & Boutmans, J. (1988). The physiological load imposed on soccer players during real match-play.
Science and Football, 1, 51–59.
Vigne, G., Gaudino, C., Rogowski, I., Alloatti, G., & Hautier, C. (2010). Activity profile in elite Italian soccer team. International Journal of Sports Medicine, 31(05), 304–310. doi:10.1055/s-0030-1248320
Zubiaga, A. Z. (2006). La actividad del jugador de fútbol en alta competición: Análisis de variabilidad [Http://purl.org/dc/dcmitype/Text, Universidad de Málaga]. https://dialnet.unirioja.es/servlet/tesis?codigo=144452
3 Global Navigation Satellite Systems
Carlos D. Gómez-Carmona, José Pino-Ortega, Markel Rico-González and Alejandro Bastida- Castillo
Introduction
The development of GNSS has been possible thanks to the creation of atomic clocks that are basic for satellite navigation. The principle by which atomic clocks work was developed by the Nobel laureate Isidor Rabi (Rabi et al., 1938). Its development has allowed the precise measurement of the length of time it takes a radio signal to travel from the satellite to the receiver. The first satellite navigation system was called “TRANSIT” and was developed and used by the United States Navy with five satellites. Later, this system was replaced by the Global Positioning System (GPS) designed by the defense department of the United States of America, being its application to provide navigation capacity to military forces by land, sea and air under all weather conditions (Misra and Enge, 1999).
Although its first application was in the military field, this system has been beneficial for use in the civil area for recreation, vehicle control, air and maritime navigation and topographic actions, and also for sports science (Larsson, 2003). The first approach to use GPS in sports was made by the GARMIN company for the measurement of human locomotion in 1997 (Schutz and Chambaz, 1997). At this time, GPS was the only operational tracking system and the Department of Defense of the United States had intentionally degraded its accuracy. From May 2000, the American government eliminated this signal degradation and the precision improved significantly to an estimated error of fewer than 2 meters (Terrier et al., 2000). Currently, there are four constellations of satellites depending on the nations that develop them: (1) GPS, developed by the American government with 32 satellites; (2) GALILEO, developed by the European Union with 21 satellites; (3) GLONASS:
developed by the Russian government with 29 satellites; and (4) BEIDOU, developed by the Chinese government with 15 satellites. However, only GPS and GLONASS can be used as a minimum of 24 satellites are required for valid use, so that tracking devices include single- (GPS) and dual-system (GPS/GLONASS) code receivers (Cornwall, 2008).
Considerations of the Use of GNSS
During the use of GNSS as tracking technology to identify time-motion demands in sports, different aspects should be considered to obtain a better signal quality:
Number of connected satellites: The satellites continuously send information to the tracking devices that are around them. When the device achieves communication with a larger number of satellites, an improvement in the accuracy of the recorded data was produced. The minimum number of satellites required for an adequate connection is four, but previous research has demonstrated that the signal quality is poor if the receiver is connected to fewer than six satellites (Witte and Wilson, 2004) (Figure 3.1).
image
Figure 3.1 (a) GNSS functioning and the effect of (b) HDOP, (c) data processing algorithms, (d) sampling frequency, (e) environmental conditions and infrastructures, and (f) body location of GNSS receiver.
Horizontal dilution of precision (HDOP): This measure provides the accuracy of the tracking signal concerning the geometrical disposition of the satellites. When the HDOP value is low, the satellites are spread out and precision is good, whereas when HDOP is high the precision is poor. This aspect is misinformed in research and its value is important as well as the number of connected satellites that is commonly mentioned in studies (Malone et al., 2017). The values range from 0 to 50, with values less than 1 being considered as ideal (Williams and Morgan, 2009) (Figure 3.1).
Data processing algorithms: Commonly, companies that develop technological devices including algorithms to identify poor quality data and correct them through interpolation, smoothing, or extracting them (Malone et al., 2017). This process could be helpful for practitioners to evaluate training and competition demands, instead, the black box of filters and algorithms used to process data is required to be able to compare data between devices and/or companies (Terziotti et al., 2018). Besides, this aspect also occurs with different versions of the same company devices, so after each actualization is necessary to assess the accuracy of the tracking device utilized (Kempton et al., 2015) (Figure 3.1).
Sampling frequency: This feature identifies the amount of data per second that the device is able to register. A higher sampling frequency is usually related to greater data quality, above all in team sports where there are many positioning changes during sports movements (Scott et al., 2016). However, it must be mentioned that not only sampling frequency will improve the quality of tracking data. Data quality related to sampling frequency also depends on the data obtaining methods that could be direct or interpolated data by mathematical algorithms (Johnston et al., 2014) (Figure 3.1).
Environmental conditions and infrastructures: Both characteristics have a direct influence on the quality of the GNSS tracking data. The occlusion of signal reception of satellites by devices is important due to the fact they send the signal in a straight way (Beekhuizen et al., 2013). For this reason, stadiums with big walls and concrete structures, rainy days or dense fog prevent communication between the transmitter (satellite) and the receiver (tracking device) due to the reflection and refraction effects (Larsson, 2003) (Figure 3.1).
Device’s body location: As well as in the case above, the human body also can act as an occlusion object.
Developing companies of tracking devices usually optimize their functioning at the interscapular line, but few companies have optimized at the center of mass or sternum (Gómez-Carmona et al., 2020). The main reason to select the interscapular line to place tracking devices is as this location eliminates the athlete’s body as a negative factor in the direct reception of the signal, being only the athlete’s head that could influence it (Akenhead and Nassis, 2016) (Figure 3.1).
Validity and Reliability
Validity and reliability are the most important parameters that sports scientists and practitioners should know about the tracking devices with GNSS receivers. Validity refers to how well a variable reflects what it intends to measure, while reliability refers to the consistency with itself (within-unit) and with other devices (between-unit) (Bassett, 2000). The validity of GNSS is vital due to an error that underestimates or overestimates the competition load directly influences a wrong design of training loads, which can lead to an increased risk of muscle injury (Cummins et al., 2013). For the validity assessments in team sports, most research presented its results as the standard error of measurement (SEM), the standard estimate of error (SEE), the percentage of differences (%diff), or the coefficient of variation (CV) from criterion measures. Otherwise, reliability is needed to allow the comparison between sessions and players, being the most common measures for reliability typical error of measurement (TEM), intraclass correlation coefficient (ICC) and CV (Hopkins, 2000). To interpret reliability results, previous recommendations shown the following rating: (a) good (>5%), (b) moderate (5–10%), or (c) poor (>10%) (Hopkins et al., 2009); but no recommendations have been realized for validity in sport science, so previous research adapted the recommendation for reliability on validity analysis for consistency and congruency (Scott et al., 2016).
Table 3.1 shows the validity and reliability analysis in the scientific literature of the devices that incorporate GNSS sensors for tracking purposes over 5 Hz in the Web of Science database on 15 November 2020. This criterion was employed as the noise calculated through TEM and CV in 1 Hz devices exceeds the signal smallest worthwhile changes and may not be capable of identifying the specific requirements in sports practice (Jennings et al., 2010a; Portas et al., 2010). A minimum of 10 Hz is necessary to achieve acceptable reliable and valid results through GNSS, but higher sampling frequency (15 and 18 Hz) have had no additional benefits. Literature suggests that >10 Hz GPS units are capable of registering time-motion demands as distance and average speed with adequate accuracy, intra- and inter-unit reliability to allow multiple comparisons of a single device and between devices. Data of peak speeds and instantaneous velocity distance covered and average speed during displacements are registered with good accuracy and reliability, but instantaneous speed should be treated with caution due to their lower precision and higher variability between devices.
Table 3.1 Validity and reliability results published in the scientific literature related to tracking devices with GNSS technology
Company Device SF Trials Assessment Criterion Variable Error Inter
Catapult MinimaxX
2.0
5 Hz Cricket running 600–8800 m
Validity Athletics track
Distance SEE = 1.7–
23.8 %