UTILIZING REVERSIBLE ADDITION FRAGMENTATION CHAIN TRANSER FOR THE SYNTHESIS OF POLYMERIC GENE DELIVERY VEHICLES
by
Jared Charles Spoons
A thesis submitted to the faculty of the University of Mississippi in partial fulfillment of the requirements of the Sally McDonnell Barksdale Honors College.
Oxford May 2014
Approved by
__________________________________
Advisor: Dr. Adam E. Smith
__________________________________
Reader: Dr. John H. O’Haver
__________________________________
Reader: Dr. Paul Scovazzo
© 2014 Jared Charles Spoons ALL RIGHTS RESERVED
DEDICATION
This thesis is dedicated to the faculty of the University of Mississippi School of Engineering, Department of Chemical Engineering, and the Sally McDonnell Barksdale Honors College as well as to my parents, Charles and Sheree Spoons, my grandmother Helen Messana, and my fiancée, Jessica Domaleski, all of whose endless support, guidance, and encouragement has made achieving my dreams possible.
ACKNOWLEDGEMENTS
I express my deepest appreciation to my advisor, Dr. Adam Smith and to my committee members, Dr. John O’Haver and Dr. Paul Scovazzo. I could not have
financed my education without the scholarships provided by the Department of Chemical Engineering and Air Force Reserve Officer Training Corps Detachment 430.
Lastly, I acknowledge the encouragement and support from my fellow
engineering students, Detachment 430 Cadet Cadre, and Colonel Bill Berry. You have made this part of my life enjoyable, enriching, and rewarding.
ABSTRACT
There are many techniques used today to make a variety of polymers but this thesis investigates the reversible addition-fragmentation chain transfer (RAFT)
polymerization technique and illustrates the advantages and importance of using RAFT polymerization technique to make the desired polymer. The research focused on two monomer units that were to form the diblock copolymer; the hydrophilic part,
oligo(ethylene glycol) methacrylate, and the cationic hydrophobic part 2-
diethylaminoethyl methacrylate. The goal was to produce a target diblock copolymer with a Mn value of 44K and a PDI under 1.5 with the block sizes being a 35K Mn
OEGMA chain and a 9K Mn DEAEMA chain. Using RAFT polymerization, I was able to make the desired diblock copolymer. Using this data, I can synthesize additional block copolymers depending on the need. This ability along with the advantage of being able to be used in a variety of conditions is why RAFT polymerization is such an important and desirable technique in making polymers.
TABLE OF CONTENTS
COPYRIGHT... ii
DEDICATION... iii
ACKNOWLEDGMENTS... iv
ABSTRACT... v
LIST OF FIGURES... vii
LIST OF ABBREVIATIONS……….………... ix
INTRODUCTION ...1
EXPERIMENTAL SECTION... 6
RESULTS/ DISCUSSION... 14
CONCLUSION/ LIMITATIONS... 26
LIST OF REFERENCES... 27
LIST OF FIGURES
1. Difference in chain length control and PDI for polymerization via RAFT
polymerization compared to traditional radical polymerization... 3 2. Proposed mechanism for RAFT polymerization ……….…………..…………..4 3. P(OEGMA-b-DEAEMA) polymeric RAFT species ………..…………..5 4. MaxQ 2000 heating block used in lab for polymerization process at 70oC………….7 5. Labconco FreeZone 1 lyophilizer used to sublime water from the polymer at 0.021
mbar and -52oC ……….………….……….9
6. Cross sectional view of a GPC column ………12 7. Block diagram of overall schematic of a GPC unit ………...13 8. Ultimate 3000 Injector and pump (left), columns (middle), and detectors (right) comprising the Dionex GPC unit used in lab experiments…………..……….13 9. Normalization of refactive index peaks verses time for five hour kinetics experiment polymerization of P(OEGMA)……… ………...……..14 10. P(OEGMA) Mn values verses polymerization time for 5 hour kinetic run shown in Figure 9……….……….15 11. Normalization of refractive index vs time five hour kinetics experiment
polymerization of DEAEMA sample 1……….……….…………16
12. P(DEAEMA) sample 1 Mn values versus polymerization time..……… ….….17 13. Normalization of reactive index for five hour kinetics experiment polymerization of DEAEMA sample 2………..……….…17 14. P(DEAEMA) sample 2 Mn values versus polymerization time ……….…18 15. Purified five hour polymerization of DEAEMA with an Mn of 11K and a PDI of 1.094………..……….19 16. Mn values of OEGMA vs polymerization time for the prediction of desired polymer size ………..….……….…20 17. The blue peaks is a 2.5 hour P(OEGMA) with a Mn of 34K and a PDI of 1.216 and the red peak is a 5 Hour P(OEGMA) with a Mn of 46K and a PDI of 1.008…………...20 18. Illustration of GPC characterization of P(OEGMA) 5 hour polymerization purified sample with an Mn of 32K and a PDI of 1.220……….21 19. Degree of polymerization achieved for P(OEGMA-b-DEAEMA) for 2 and 5 hour polymerization time………...22 20. P(OEGMA-b-DEAEMA) GPC characterization with red peak being 2hr run with an Mn of 40K and a PDI of 1.294 and the 5hr blue peak having an Mn of 43K and PDI of 1.268………...23 21. P(DEAEMA-b-OEGMA) siRNA uptake and micelle formation and release theory.25
LIST OF ABBREVIATIONS
CDP 4-cyano-4[(dodecyl-sulfanylthiocarbonyl)sulfanyl] pentanoic acid CTA chain transfer agent
DEAEMA 2-diethylaminoethyl methacrylate
DI deionized
DMF dimethylformamide DMSO dimethyl sulfoxide
dn/dc refractive index increment [mL/g]
DP degree of polymerization GPC gel permeation chromatography g/mol grams per mole
K one thousand
mg milligrams
mL milliliters
Mn number-average molecular weight OEGMA oligo(ethylene glycol) methacrylate PDI polydispersity index
RAFT reversible addition-fragmentation chain transfer siRNA small interfering ribonucleic acid
INTRODUCTION
Polymers are large molecules comprised of many structural repeat units called monomers joined together by either ionic, covalent, hydrogen, or London dispersion bonds. Most often, when polymers are formed, they form as long chains; however, they can branch or form star shapes. Polymers are found throughout nature and in our everyday lives. They can be naturally occurring or synthetic. Some examples of naturally occurring polymers include DNA, RNA, and proteins. Examples of synthetic polymers include nylon and polystyrene. Man has been synthesizing polymers since 1832 [1] and synthetic polymers are now commonly being used in various applications including agriculture, industry, sports, and medicine. There are a number of techniques used today to make a variety of polymers but the technique used for this research was reversible addition-fragmentation chain transfer (RAFT) polymerization. RAFT polymerization is a form of controlled living polymerization and was first reported in 1998[5]. The term “control” means that if the conditions for polymerization are selected so that the chain breaking processes are insignificant compared to the chain propagation, the synthesis of polymers with predetermined molecular weights and low polydisperisty become a reality[2]. The term “living” polymerization indicates that all the chains retain their active center after the full consumption of the monomer which will allow for propagation to resume upon the introduction of additional monomer [2]. Additionally, RAFT polymerization technique can be applied to a variety of monomers while
possessing tolerance to a variety of solvents, reaction conditions, and
functionalities. RAFT polymerization utilizes chain transfer agents (CTAs) which are organic compounds containing thiocarbonylthiol moieties that control the polymerization process and help prevents the growing polymer chains from terminating prematurely, thus allowing for greater chain length control. Low polydispersity index (PDI) from the created polymers is achieved using RAFT polymerization through the control of the CTA. PDI is the measure of the distribution of molecular mass in a given polymer sample. Typical ranges for PDI with a perfectly mono-disperse polymer achieving a PDI of 1.00 [9]. Chain length control consistency available using RAFT polymerization is shown in Figure 1 [4].The molecular weight of a RAFT polymer is controlled by the RAFT agent. The equation below shows how the number average DP is related to the RAFT agent (CTA) which is related to the Mn. Therefore, the molecular weight of a polymer is controlled by the RAFT agent as shown in Equation 1.
𝑥! = !!!
! =[!"#$]!∗[!]!
! (1)
Equation 1. Xn is the number average degree of polymerizaion, Mn is the number average molecular weight, Mo is the molar mass of the repeat unit, c is the fractional
monomer conversion, and RAFT is the chain transfer agent
Figure 1. Difference in chain length control and PDI for polymerization via RAFT polymerization compared to Traditional Radical Polymerization [4]
The proposed mechanism for the RAFT polymerization process in illustrated in Figure 2.
The RAFT mechanism illustrates how the initiator creates a radical unit that binds to the monomer which then transfer of the radical unit from one propagating polymeric chain to another via the CTA.
Figure 2. Proposed mechanism for RAFT polymerization [5]
The use of RAFT polymerization for pH responsive micelle formation behavior is important in the medical and pharmaceutical fields for the development of gene delivery techniques. The concept of gene delivery has been studied since 1963 with a variety of viral and non-viral gene delivery agents [5]. Viral delivery agents, or vectors, proved to be toxic in clinical trials. Thus, research shifted to non-viral methods such as polymers as gene delivery agents. Gene delivery techniques hold great potential for the treatment of a variety of genetic disorders such as cancer [5]. Cationic polymers, which this research focuses on, have been extensively studied, but biocompatible analogs need to be developed due to the high toxicity of the cationic polymers, non-specific
interactions with cells, and low gene expression.
This work focused on using the RAFT polymerization technique to synthesize diblock copolymers of oligo(ethylene glycol) methacrylate (OEGMA) and 2-
diethylaminoethyl methacrylate (DEAEMA). These monomers were chosen for their cellular uptake and their ability to form gene delivery vectors based off of pH changes.
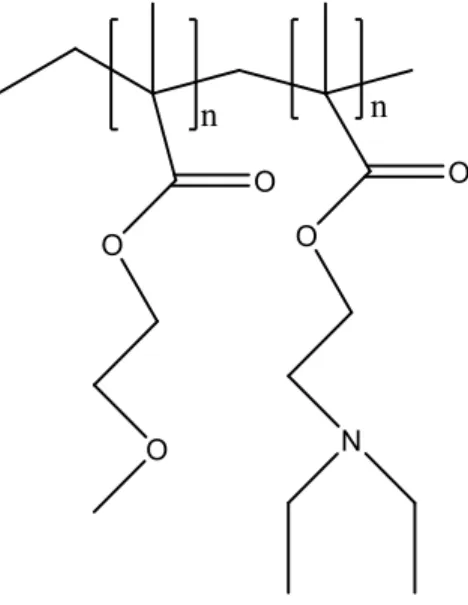
The preliminary research focused on determining the conditions necessary to target diblock copolymers comprised of a block of 35K OEGMA and a 9K DEAEMA. The structure of the monomer units of OEGMA and DEAEMA with the neutral hydrophilic monomer being the OEGMA and the cationic monomer being the DEAEMA can be found in Figure 3. The hydrophilic monomer block is important because it acts as the solubilizing block. P(OEGMA) maintains the overall solubility of the vector and also acts as a steric stabilizing layer preventing micellar fusion during cross-linking [10]. The cationic P(DEAEMA) has a strong affinity for small interfering ribonucleic acid (siRNA) and the cationic block leads to interpolymer binding forming a micelle at pH of 8 due to deprotenation protecting the siRNA from enzymatic degradation [11].
Figure 3. P(OEGMA-b-DEAEMA) polymeric RAFT species
EXPERIMENTAL SECTION Material
OEGMA (475 g/mol) and DEAEMA (185.3 g/mol) were purchased from Sigma Aldrich. These monomers were purified by running through an aluminum hydroxide column prior to remove the inhibitor (mono methyl ether hydroquinone) to allow for polymerization at 70oC. The CTA used was 4-cyano-4[(dodecyl-
sulfanylthiocarbonyl)sulfanyl] pentanoic acid (CDP). The initiator was 4,4’-azobis(4- cyanopentanoic acid) (V-501). Solvents included dimethylformamide (DMF) and dimethyl sulfoxide (DMSO).
Synthesis of P(OEGMA-b-DEAEMA) Copolymers The specifications for the polymerization of OEGMA were a degree of
polymerization (DP) of 75, a CTA/Initiator of 10, and monomer concentration of 0.5M.
A solution of CDP (80.3 mg), V-501 (5.5 mg), and OEGMA (7.125 mL) was mixed with 30 mL of DMSO and placed in a 50 mL cylindrical vial and capped. The cap was made of rubber to allow for deoxygenation of the solution. A gas vent needle was inserted on one side of the cap. This needle did not touch the liquid solution. A long needle
connected to a tank of ultra-high purity nitrogen was inserted on the other side of the cap and extended into the solution. The solution was purged with N2 for 15-30 minutes at room temperature. After the allotted time, the gas vent needle was removed just prior to
the nitrogen being turned off to insure no oxygen was allowed in. The long needle connected to the nitrogen tank was removed from the vial. The vial was then placed onto a heating block that was preheated to 70oC. A heating block uses a thermocouple
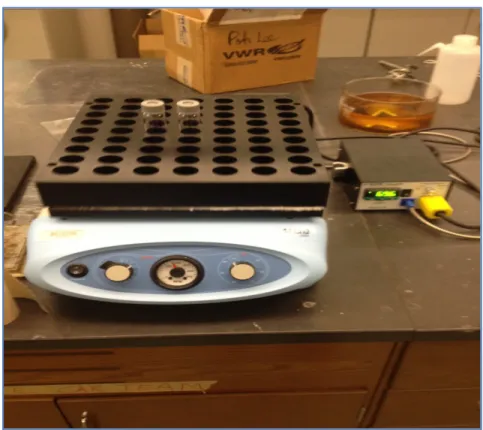
transmitter to provide a signal to the temperature controller which transmits this signal to an electrical output that provides heat to the block at the desired temperature. The heating block also acts as a stir bar by rotating the vials in a counter-clockwise rotation allowing equal heat distribution. The block moved in a circular fashion at a constant temperature of 70oC for 5 hours. Figure 4 shows what the heating block in the lab looks like.
Figure 4. MaxQ 2000 heating block used in lab for polymerization process at 70oC
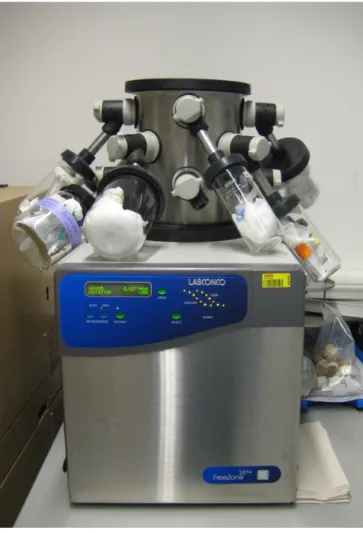
After 5 hours, the temperature and stirrer of the block was turned off and the cap was stabbed with a gas vent needle to allow oxygen in and terminate the process. The solution was allowed to cool at room temperature for 1 hour prior to handling. As the vial cooled, dialysis was performed using a Spectra/Por Dialysis Membrane. The membrane allows small molecules with a molecular weight of 3,500 or less to diffuse through into the DI water while keeping the larger polymer inside. The membrane was cut to the appropriate length for the volume necessary in the vial (about 4 inches) and soaked in deionized water for 15 minutes. After 15 minutes, the membrane was tied at one end and opened at the other forming a bag. The vial contents, now cooled, were transferred to the membrane bag. Any content that stayed within the vial was flushed using DI water and transferred to the membrane bag. The bag was placed in a 500 mL beaker filled to 350-400 mL of DI water. The water in the beaker was changed at 12 hour intervals for 6 days. This insured that no other content was left within the membrane bag besides the desired polymer. Once the bag was removed from the deionized water, the bag was cut at the top and contents poured into a 250 mL round bottom flask and then placed into a freezer and allowed to freeze. The contents of the 250 mL flask were frozen, and the flask was placed on the lyophilizer for 3 days. A picture of the lyophilizer is shown in Figure 5.
Figure 5. Labconco FreeZone 1 lyophilizer used to sublime water from the polymer at 0.021 mbar and -52oC
A lyophilizer works by creating a very low temperature and low pressure environment in which an aqueous solvent, in this case water, will reach its eutectic and sublime, leaving only the desired solute, polymer, behind [7]. After 3 days, the pure polymer was removed from the flask and placed into a glass vial. The contents were evaluated using the GPC. A solution of 168 μL of POEGMA (Poly-OEGMA) was mixed with 2 mL 54/23/23 (v/v/v %) H2O/MeOH/NaOAC and filtered into the auto sampler vials for the characterization in the GPC.
The specifications for the polymerization for the kinetics of DEAEMA (MW 185.3) were a DP of 100 with a CTA/Initiator of 10 and a monomer concentration of 0.5 M solution. A solution of CDP (32.3 mg), V-501 (2.24 mg), and DEAEMA (1.48 mL) was mixed with 16 mL of DMF and placed in a 50 mL vial capped with a rubber cap.
The vial was deoxygenated with nitrogen for 15 minutes. The vial was then placed on the heat block at 70oC with rotating motion for 5 hours with 2 mL samples taken every hour for the allotted time. These samples where then prepared for use in the GPC. A 0.25M solution was prepared by adding 863 μL of polymer to 2 mL of 54/23/23 (v/v/v
%) H2O/MeOH/NaOAC. This solution was then filtered into the auto sampler vials and capped for characterization using the GPC.
After the kinetics, a single five hour polymerization of DEAEMA was done on the heating block with a target DP of 50. Once completed, the DEAEMA was placed was poured into the Spectra/Por Dialysis Membrane and placed into a 500 mL beaker of DI water at a pH of 3. The DI water was made acidic by adding 300 μL of hydrochloric acid (HCl) and acidity was tested using pH strip indicators. P(DEAEMA) was allowed to soak in the acidic water for three days with daily water changing. After the three days, P(DEAEMA) was then placed into pure DI water for another three days with daily water changing. Upon completion of dialysis, P(DEAEMA) was placed in a round bottom flask and frozen so that it could then be placed on the lyophilizer. Once all the water sublimed off, the P(DEAEMA) was extracted out of the round bottom flask and a sample of the purified DEAEMA was then characterized by the GPC.
The synthesis of the P(OEGMA-b-DEAEMA) diblock copolymers followed a
similar process as described for the polymerization of OEGMA. POEGMA macroCTA (3000 mg), 5.3 mg V-501, and 0.861 mL of DEAEMA were placed in a 50 mL vial and polymerized and characterized as described above.
Characterization
Size exclusion chromatography was accomplished by using the GPC to determine the number-average molecular weight (Mn) and polydispersity indices for the polymers and diblock copolymers using an aqueous eluent of 54/23/23 (v/v/v %)
water/methanol/acetic acid with 0.1 M sodium acetate. The refractive index increments or dn/dc values were measured using the GPC for determination of absolute pure polymer molecular weights. The GPC is the most convenient method used for characterizing the complete molecular weight distribution of a polymer [6]. The end use of the polymers for this experiment requires precision in their make-up so that they can deliver the desired performance and endure the harsh conditions of the body. The GPC allows one to be extremely accurate with the polymer production by allowing one to look at the samples’
PDI, molecular weights, and “dn/dc” values. The dn/dc values are used to accurately measure the samples’ absolute molecular weights using a multi-angle light scattering instrument. The GPC works by separating molecules that were previously dissolved in an appropriate solvent by their “effective size in solution” [6]. Inside the GPC, the dissolved molecules are injected into a continually flowing stream of solvent (mobile phase). The mobile phase flows past a stationary phase which is made up of millions of rigid and highly porous particles of varying sizes. Molecules of varying sizes will elute out of the column at different rates with the higher molecular weight molecules eluting
first while the smaller molecular weight molecules experience an extended flow path, resulting in a longer retention time [6]. Figure 6 shows a cross sectional area a GPC column.
Figure 6. Cross sectional view of a GPC column [6]
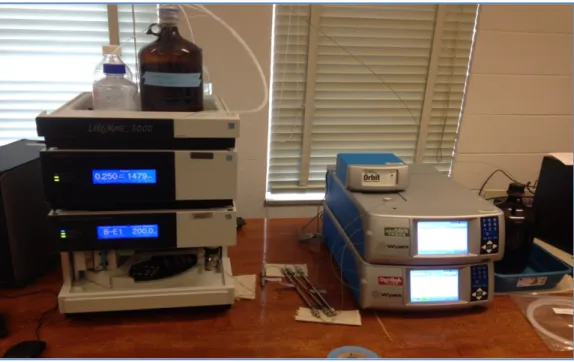
The design of the GPC system requires a variety of equipment parts. Injectors are needed to deliver the polymer solution to the mobile phase, pumps are needed to push the sample and solvent through the column, detectors are used to record the separation, and data acquisition is needed to control the test automatically, record results, and perform the desired calculations. Figure 7 shows the block diagram design of how a GPC functions and Figure 8 shows that the GPC unit used in the lab experiments is a Dionex Ultimate 3000.
Figure 7. Block diagram of overall schematic of a GPC unit [6]
Figure 8. Ultimate 3000 Injector and pump (left), columns (middle), and detectors (right) comprising the Dionex GPC unit used in lab experiments
RESULTS/ DISCUSSION
For the initial OEGMA polymerization, a targeted DP of 75 at 100% conversion was used for the research. In order to calculate the time necessary to run the
polymerization, a series of kinetic experiments was done. Kinetics experiments required a different polymerization set up than described in the polymerization process section.
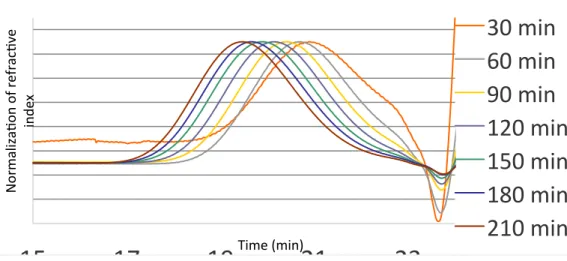
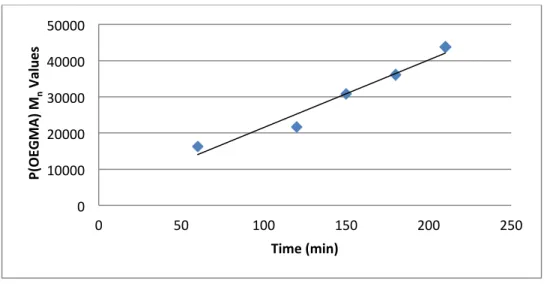
This form utilized a 250 mL round bottom flask, an oil bath at 70oC, and long nitrogen rich syringes that were pumped so that no air entered the needle nor the flask. Samples were taken every 30 minutes for 4 hours. The samples were then run through the GPC where peaks were evaluated for polymers and the Mn values were calculated, from which the DP verses time could be calculated. The results of the kinetic run for OEGMA are represented by Figure 9.
Figure 9. Normalization of refactive index peaks relating to Mn values verses time for five hour kinetics experiment polymerization of P(OEGMA)
15 17 19 21 23
Normaliza7on of refrac7ve index
Time (min)
30 min
60 min
90 min
120 min
150 min
180 min
210 min
Figure 10. P(OEGMA) Mn values verses polymerization time for 5 hour kinetic run shown in Figure 9
The peaks shown were standardized to a value of 1. This was done to show that as time increased, the molecular weight of the polymer also increased because the elution time decreased. The other irregular peaks to the right of the results are solvent peaks that were recorded as the solvent was pushed through the column.
This type of polymerization setup proved to be very challenging. To control the temperature of the oil bath a thermometer was connected to the heating plate. However, due to accidental shut downs, the temperature of the oil bath dropped below 70oC halting the polymerization process leading to inaccurate results. Additionally, it was very difficult to keep oxygen out of the syringe and round bottom flask during each sample uptake. It was important to keep oxygen out of the polymer because the oxygen terminates the active chain ends and ultimately the polymerization process. There was always a degree of uncertainty regarding the amount of oxygen contamination which could occur during each sample uptake.
0 10000 20000 30000 40000 50000
0 50 100 150 200 250
P(OEGMA) Mn Values
Time (min)
Different molarities and CTA/initiator values were tested to determine which yielded the desired results. At a DP of 75, a 0.5 Molar solution with a CTA/initiator ratio of 10 undergoing a five hour polymerization produced a Mn value of 32.3K. The
maximum Mn value that theoretically could have been achieved for the given DP was 35K, therefore it was determined that these conditions were successful.
Next the DEAEMA polymerization was done at a target DP of 50 at 100%
conversion. Two kinetics tests were run for DEAEMA. The total solution size for each test was 16 mL which was divided into six vials for the time specified for sample collection. These runs were different from the OEGMA kinetic runs as they were done on the heating block with samples terminated by oxygen at the allotted time. The samples were run through the GPC with results normalized. Data from the two samples are shown in Figures 11 through Figure 14.
Figure 11. Normalization of refractive index for five hour kinetics experiment.
polymerization of DEAEMA sample 1
0 0.2 0.4 0.6 0.8 1 1.2 1.4
25 27 29 31 33 35
Normaliza7on of refrac7ve index
Time (min)
1 hr 2 hr 3 hr 4 hr 5 hr
Figure 12. P(DEAEMA) sample 1 Mn values versus polymerization time
Figure 13. Normalization of reactive index for five hour kinetics experiment polymerization of DEAEMA sample 2
1350 1400 1450 1500 1550 1600 1650
0 1 2 3 4 5 6
DEAEMA Mn Values
Time (hrs)
0 0.2 0.4 0.6 0.8 1 1.2 1.4
25 27 29 31 33 35
Normaliza7on of refrac7ve index
Time (min)
1 hr 2 hr 3 hr 4 hr 5 hr
Figure 14. P(DEAEMA) sample 2 Mn values versus polymerization time The peaks of the DEAEMA samples were standardized to a value of 1. This data further reflects the findings illustrated by the kinetics experimentation of OEGMA that as time increased the molecular weight of the polymer also increased because elution time decreased. The irregular peaks to the right of the normalized peaks are solvent peaks that were recorded as the solvent was pushed through the column. From this data it was determined that a DEAEMA polymerization should be done for five hours. The results of the five hour polymerization process for purified DEAEMA is shown in Figure 15.
1000 1400 1800 2200 2600
0 1 2 3 4 5 6
DEAEAM Mn Values
Tim (hrs)
Figure 15. Purified five hour polymerization of DEAEMA with an Mn of 11K and a PDI of 1.094
The making of the desired 40K diblock copolymer of P(OEGMA-b-DEAEMA) was achieved through the testing of different time intervals. This was not kinetic
polymerization as samples were not taken every 30 minutes; instead, the polymerization process was allowed to continue through the desired length of time on the heat block with no disturbances. This technique proved very effective in achieving the desired results as it eliminated the error of oxygen contamination and the accidental errors of temperature malfunctions. Two samples of OEGMA were prepared the same and were run for 2.5 hours and 5 hours with the results shown in Figure 16 and Figure 17.
-‐0.05 0 0.05 0.1 0.15 0.2 0.25 0.3 0.35
0 10 20 30 40 50 60
Light sca;ering rela<ve scale
Time (min)
Figure 16. Mn values of OEGMA vs polymerization time for the prediction of desired polymer size
Figure 17. The blue peaks is a 2.5 hour P(OEGMA) with a Mn of 34K and a PDI of 1.216 and the red peak is a 5 Hour P(OEGMA) with a Mn of 46K and a PDI of 1.008
0 5000 10000 15000 20000 25000 30000 35000 40000 45000 50000
0 1 2 3 4 5 6
Mn Values
Time (hours)
-‐0.05 0 0.05 0.1 0.15 0.2 0.25 0.3 0.35 0.4 0.45 0.5
0 10 20 30 40 50 60 70
Light sca;ering rela<ve scale
Time (min)
This data further supports the kinetic data previously depicted in Figure 9. As the time for polymerization increases so does the molecular weight. Figure 17 illustrates that at 5 hours the polymer elutes from the column in 20 minutes while at 2.5 hours the polymer does not elute from the column until 25 minutes.
However these results are from unpurified samples of OEGMA polymer. The 5 hour polymerization sample was chosen for purification with the resulting peaks from the GPC shown in Figure 18.
Figure 18. Illustration of GPC characterization of P(OEGMA) 5 hour polymerization purified sample with an Mn of 32K and a PDI of 1.220
-‐0.2 0 0.2 0.4 0.6 0.8 1 1.2
0 10 20 30 40 50 60 70
Light scatering rela<ve scale
Time (min)
purification the OEGMA had a Mn of 32,300 with a PDI of 1.220 which indicated that a DP of 68 was achieved. This was very close to our target molecular size of 35K and DP of 75 and deemed a success.
This purified OEGMA was used as the macroCTA for the polymerization of the diblock copolymer. The desired DP for the diblock copolymer was 50 and it was theorized that this could be achieved with a 5 hour long polymerization process.
However, to verify that the polymerization process did not over shoot the desired DP;
two polymerization tests were done, one at 2 hours and the other at 5 hours. The result of this polymerization is shown in Figure 19 and Figure 20.
Figure 19. Degree of polymerization achieved for P(OEGMA-b-DEAEMA) for 2 and 5
hour polymerization time
0 5 10 15 20 25 30 35 40 45 50
0 1 2 3 4 5 6
Degree of Polymeriza<on
Time (hrs)
Figure 20. P(OEGMA-b-DEAEMA) GPC characterization with red peak being 2hr run with an Mn of 40K and a PDI of 1.294 and the 5hr blue peak having an Mn of 43K and
PDI of 1.268
From the diblock results, it was determined that a 0.5 molar solution with a CTA/initiator value of 10, and a DP of 50 running for 5 hours would produce a 8.5K Mn of DEAEMA. The results of the OEGMA and diblock polymerizations yielded the targeted value desired for this research, a diblock size of 44K Mn and a PDI of 1.
Using RAFT polymerization, polymers of controlled size and shape are tested for their efficiency in vitro to discover the relationship between chemical structure and gene expression [5]. Using RAFT polymerization I was able to make the desired size of
0 0.2 0.4 0.6 0.8 1 1.2
22 24 26 28 30 32 34
Light sca;ering relav<ve scale
Time (min)
P(OEGMA-‐b-‐DEAEMA) 5 hr
P(OEGMA-‐b-‐DEAEMA) 2 hr
polymer block formation. Additionally, I can synthesize additional polymers either larger or smaller to tailor the cellular uptake and gene expression. This, along with its ability to be used in a variety of experimental set ups, is why RAFT polymerization is such a desirable technique, especially in drug and gene delivery. These two monomer units were chosen for their properties to form micelles when exposed to different pH values. As mentioned previously, P(OEGMA) blocks maintain the solubility and stabilization of the micelle unit while the P(DEAEMA) has a high affinity for siRNA forming the micelle core at pH of 8 and dissolving at cytoplasmic pH 7.2. It is important to efficiently condense negatively charged siRNA to the cationic block having a positive surface charge to permit facile adsorptive endocytosis of the micelle into the cytoplasm
[12]. The cationic P(DEAEMA) showed relatively high gene transfection efficiency in the absence of serum proteins but was greatly reduced with the presence of these proteins.
This is because of the non-specific protein adsorption onto the positively charged surface of the polymer/siRNA complex, ultimately diminishing the endocytic transport into the cell. To resolve this problem the shielding and stabilization nature of the P(OEGMA) block is added to suppress the non-specific protein interactions [12]. It is theorized that this polymer diblock will be able to form a micelle unit containing siRNA and, upon entering the target cell, will release its contents to the cell because of the pH shift causing the deprotonation of the cationic DEAEMA. The theory of this transfer is illustrated in Figure 21.
Figure 21. P(DEAEMA-b-OEGMA) siRNA uptake and micelle formation and release theory
CONCLUSION
This research holds potential for life saving pharmaceutical applications
especially in the area of developing synthetic gene delivery vectors. The contribution this research made to science is the knowledge of the kinetics of the RAFT polymerization process using the monomers OEGMA and DEAEMA. With this data, this study can be repeated by making smaller diblock polymer units with estimated Mn values via the kinetics. The theory behind using the smaller polymer complex is for the diblock to have more effiecient cellular uptake because for efficient cell transfection the micelle should be 200 nm or less in diameter [12]. Once made, gel electrophoresis and H1-NMR should be used in addition to the GPC to study the size, shape, and content of the polymer unit made. These studies will eventually lead to in vitro testing.
LIST OF REFERENCES
1) "What are Polymers?." What are Polymers?. N.p., n.d. Web. 6 Apr. 2014.
<http://matse1.matse.illinois.edu/polymers/
2) "Features of Controlled "Living" Radical Polymerizations - Matyjaszewski Polymer Group - Carnegie Mellon University." Features of Controlled
"Living" Radical Polymerizations - Matyjaszewski Polymer Group - Carnegie Mellon University. Matyjaszewski Polymer Group, n.d. Web. 6 Apr. 2014.
<http://www.cmu.edu/maty/crp/feature-development-crp/features.html>.
3) "Polymer Molecular Weight Distribution and Definitions of MW Averages."
www.agilent.com/chem. Version 5990-7890EN. Agilent Technologies, Inc, 10 June 2011. Web. 6 Apr. 2014.
<https://www.chem.agilent.com/Library/technicaloverviews/Public/5990- 7890EN.pdf>.
4) "RAFT: Choosing the Right Agent to Achieve Controlled Polymerization."
Sigma-Aldrich. Sigma-Aldrich Co. LLC., n.d. Web. 6 Apr. 2014.
<http://www.sigmaaldrich.com/materials-science/polymer-science/raft- polymerization.html>.
5) Ahmed M, Narian R. Progess of RAFT based polymer in gene deliver. Prog Polym Sci (2012), <http:// dx.doi.or/10.1016/j.progpolymsci.2012.09.008>.
LIST OF REFERENCES CONTINUED
6) "GPC - Gel Permeation Chromatography." : Waters. Waters, n.d. Web. 6 Apr.
2014. <http://www.waters.com/waters/en_US/GPC---Gel-Permeation- Chromatography/nav.htm?cid=10167568&locale=en_US>.
7) Klutts. "Lyophilizer Use." Crypto. Version 5. N.p., n.d. Web. 6 Apr. 2014.
<http://www.crypto.wustl.edu/Protocols%20PDFs/Lyophilizer%20(SK).p df>.
8) Nobbmann, Ulf. "Refractive index increment dn/dc values." Refractive index increment dn/dc values. Malvern, 18 June 2013. Web. 6 Apr. 2014.
<http://www.materials-talks.com/blog/2013/06/18/refractive-index-increment- dndc-values/>.
9) Young, Robert J., and P. A. Lovell. Introduction to polymers. 3rd ed. Boca Raton: CRC Press, 2011.
10) Alarcon, Carolina, Sivanand Pennadam, and Cameron Alexander. "Chemical Society Reviews." Stimuli responsive polymers for biomedical applications - (RSC Publishing). Chemical Society Reviews, 27 July 2004. Web. 5 May 2014. <http://dx.doi.org/10.1039/b406727d>.
11) Hinton, Tracey, and Carlos Guerrero-Sanchez. "Biomaterials." The Effect of RAFT-derived cationic block copolymer structure efficiency. Elsevier, 12 May 2012. Web. 10 Apr. 2014.
<http://dx.doi.org/10.1016/j.biomaterials.2012.06.090>.
12) Lim, Dong, Young Yeom, and Tae Park. "Poly(DEAEMA-NVP)-b-PEG- galactose as Gene Delivery Vector for Hepatocytes." Bioconjugate Chem.
LIST OF REFERENCES CONTINUED
Version Vol. 11, No. 5. American Chemical Society, 31 Aug. 2000. Web. 5 May 2014. <http://pubs.acs.org/doi/abs/10.1021/bc000014u>.
![Figure 1. Difference in chain length control and PDI for polymerization via RAFT polymerization compared to Traditional Radical Polymerization [4]](https://thumb-ap.123doks.com/thumbv2/123dok/10461647.0/12.918.231.797.108.429/figure-difference-polymerization-polymerization-compared-traditional-radical-polymerization.webp)
![Figure 2. Proposed mechanism for RAFT polymerization [5]](https://thumb-ap.123doks.com/thumbv2/123dok/10461647.0/13.918.176.798.111.474/figure-2-proposed-mechanism-raft-polymerization-5.webp)
![Figure 6. Cross sectional view of a GPC column [6]](https://thumb-ap.123doks.com/thumbv2/123dok/10461647.0/21.918.285.744.253.594/figure-6-cross-sectional-view-gpc-column-6.webp)
![Figure 7. Block diagram of overall schematic of a GPC unit [6]](https://thumb-ap.123doks.com/thumbv2/123dok/10461647.0/22.918.225.801.109.409/figure-7-block-diagram-overall-schematic-gpc-unit.webp)
