VOLATILITY SPILLOVER OF INTRADAY EXCHANGE RATES ON SOME SELECTED ASEAN COUNTRIES
Neluka Devpura*, Iman Gunadi**, Aryo Sasongko***
*Corresponding author. Department of Statistics, University of Sri Jayewardenepura, Sri Lanka.
Email: [email protected]
** Bank Indonesia, Jakarta, Indonesia. Email: [email protected]
*** Bank Indonesia, Jakarta, Indonesia. Email: [email protected]
In this paper, we use hourly exchange rate data for selected ASEAN countries (Singapore, Indonesia, Malaysia, Thailand and the Philippines) to test the hypothesis that exchange rate own shocks dominate exchange rate volatility. We find strong evidence that own exchange rate volatility explains between 64% to 86% of their own exchange rate volatility movements. These results do not change when we include the Chinese CNY currency in the analysis. Moreover, we find that exchange rate shocks of ASEAN countries explain 36%, 24% and 23% of exchange rate volatility movements of Indonesia, Thailand, and Singapore, suggesting that for these countries are more synchronized.
Article history:
Received : April 03, 2021 Revised : July 29, 2021 Accepted : August 07, 2021 Available online : September 30, 2021 https://doi.org/10.21098/bemp.v24i3.1693
Keywords: ASEAN; Exchange rate; Volatility; Shocks.
JEL Classifications: C40; G20; F31.
ABSTRACT
I. INTRODUCTION
This paper utilized hourly exchange rate data for five ASEAN countries, namely, the Indonesia Rupiah (IDR), the Malaysian Ringgit (MYR), the Philippine Peso (PHP), the Singapore Dollar (SGD) and the Thai Baht (THB) to test the hypothesis that ASEAN exchange rate shocks help explain exchange rate movements in the region. Our hypothesis is that exchange rate shocks explain exchange rate movements in the ASEAN region. As a subset of this hypothesis, we test whether the Chinese CNY (vis-à-vis the US Dollar) exchange rate influences the exchange rate volatility of ASEAN countries.1
Using a vector autoregressive model to extract shock spillovers as proposed by Diebold and Yillmaz (2012), we document several interesting findings. First, our analysis reveals that the total spillover index is around 23% for the entire sample (2018 to 2021) and for both the pre-COVID-19 sample and the COVID-19 sample.
Second, regardless of the sample period employed, we find that other countries’
exchange rate volatility shocks explain IDR volatility most (almost 36%), followed by THB (24%) and SGD (23%). Third, we see that own shocks explain most movements in exchange rate volatility of all countries in our sample: own shocks explain between 64% (IDR) to 86% (MYR) volatility movements. Fourth, we do not find any difference in the role of specific exchange rate shocks and in own shocks in explaining exchange rate volatility in the COVID-19 sample compared to the pre-COVID-19 sample. Fifth, when we include the CNY as an additional exchange rate in the analysis, we find no significant change in the results.
Our motivation for testing the relative importance of exchange rate spillovers is twofold. The first motivation is theoretical and has roots in the work of Meese and Rogoff (1983a, b). Their main contribution was the idea that the random walk model is the best predictor of exchange rates. While the literature has accumulated mixed results in the sense that some studies do find other factors predicting exchange rates (see Narayan et al., 2021; Narayan et al., 2018), the random walk model is still popular. Narayan (2021) argues that one way of testing its suitability is to test whether, within a shock spillover framework, own shocks explain the bulk of the exchange rate movements. If so, this is evidence of the validity of the random walk model. The second motivation for our hypothesis test is the current pandemic. A growing literature now documents that exchange rate movements have behaved very differently in the COVID-19 period compared to pre-pandemic times. For example, exchange rates have been shown to exhibit bubbles (see Narayan, 2020a);
the resilience of exchange rates to shocks has changed (see Narayan, 2020b); and stock market returns react to exchange rate changes (see Narayan et al., 2020). We test whether the relationship between exchange rates has been influenced by the COVID-19 pandemic following the framework presented in Narayan (2021) in that we split the hourly data sample into a pre-pandemic period and a pandemic period, allowing us to make a direct comparison.
1 One referee of this journal asked that we explain why we preferred bilateral exchange rates over nominal effective exchange rates. Our motivation is straightforward: we are interested in bilateral exchange rate behavior rather than a basket of currencies.
Our contribution is directly to the literature that models exchange rates.2 There is a predictability literature which finds that financial news predicts exchange rates (Narayan et al., 2021), terrorist attacks predict exchange rates (Narayan et al., 2018), and US government shutdowns predict exchange rates (see Narayan et al., 2020).
There are many studies that focus on predicting exchange rates with different predictors. Among them, Molodtsova and Papell (2009) consider interest rate and output gap as predictors; Chen and Rogoff (2003) examine on commodity prices as a predictor; Cenedese et al. (2016) consider equity returns as a predictor for exchange rates and Engel et al. (2015) use the lagged exchange rate changes as a predictor. Very recently, Kim and Lee (2020) explored exchange rate predictability using output growth, financial variables (short term interest rates, term spread, and stock price changes), commodity price changes, and lagged exchange rate changes.3
While these studies depart from the random walk model applicability of exchange rates, using data on ASEAN exchange rates we show the random walk model works reasonably well. Our additional contribution is to show that for countries such as Indonesia, its exchange rate volatility (up to 36%) is dictated by the volatility of exchange rates in the region. We can add to this list THB (24%) and SGD (23%) as countries whose currency volatility is impacted by exchange rate volatility in the region.
The balance of the paper is organized as follows. Section II explains the data and methodology. Section III has results, and the final section concludes.
II. DATA AND METHODOLOGY
In this paper, we have selected 5 exchange rates against US Dollar, namely Indonesia Rupiah (IDR), Malaysian Ringgit (MYR), Philippine’s Peso (PHP), Singapore Dollar (SGD) and Thailand Baht (THB). Moreover, we have Chinese Yuan (CNY) to test for the robustness of the results. The data are high frequency intra-day 24-hour data and full sample time spans from 01/08/2018 to 31/05/2021.
Our motivation for the sample period is that since the COVID-19 starts from 31/12/2019 and continues till 31/05/2021 covers nearly one and half year. In order to get some sort of balanced data set when we analysis for pre-and post-COVID- data, we have chosen nearly one and half year back from start of COVID-19. In this way we control for any effect due to sample size variations.
Our main objective is to identify the spillover effects of exchange rate volatilities.
Our data source is REFINITIVE, Datascope. We computed the exchange rate (ER) returns by taking natural log percentage returns as follows.
2 There is very limited literature on volatility spillover of exchange rates, specifically using intra-day data (see, Baillie and Bollerslev, 1991). Thus, our contributions are unique.
3 For instance, see Rossi (2013) for a survey of forecast exchange rates with a range of different predictors.
(1)
Next, we calculated the volatility of the returns of the six exchange rate returns.
We employed a GARCH (1,1) model based on constant and the errors followed as Student t-distribution. This way, we received GARCH variance and we used this as a proxy to represent exchange rate volatilities.
Our main approach of spillover is Diebold and Yillmaz (2012) VAR model.
This method has been used by several authors: Antonakakis et al. (2018), Mensi et al. (2018) and Devpura (2021).4
Let’s consider a covariance stationary K-variable VAR(n),
Here, K is the number of currencies, which is five/six, ei ~(0,Σ) are the errors distributed i.i.d with variance matrix, Σ.
We denote the generalized h-step ahead forecast error variance decompositions as αij and is defined below.
Here, two variances are involved, own variance shares and cross variance shares. Σ and σii are the variance matrix and standard deviation of errors. vi is a vector with the i-th value is one and the rest are zeros.
The total spillover index is computed as below and let’s denote it by SIndex.
where
Moreover, directional spillover measure received by market i from all other markets j are:
Then, the directional spillovers transmitted by market i to all other markets j are:
4 Our paper is different to Devpura (2021) in which the author uses daily data of 16 exchange rates whereas we have considerd intra-day data of hourly data of 6 currencies.
(2)
(3)
(4)
(5)
III. RESULTS
We first look into the preliminary results of the currency data.
A. Preliminary Results
First of all, we plot the time series plots for the original six currencies to visualize the behavioural patterns of each of them. In Figure 1, we have plotted the exchange rate series against the US Dollar. Our sample period contains COVID-19 data as well, there is apparent property that all the graphs show the exchange rates are increased against US Dollar start of 2020 and implying the currencies are depreciating. Figure 2 illustrates the natural log percentage returns of the all six currencies. We see very high volatility on the returns by currencies except for CNY, specifically in the first quarter of 2020, in which COVID-19 was declared as a pandemic by the World Health Organization. Next, we plotted the GARCH(1,1) variance of the exchange rate returns. Again, we can observe large volatilities during the first quarter of 2020 in exchange rate returns of majority of currencies (SGD, PHP, IDR, and MYR). However, among them, IDR volatility goes high as about 20% recording the highest in the six currencies.
(6)
Figure 1.
Exchange Rates Full Sample Period 24-hour 01/08/2018 to 31/05/2021
The Currencies are Chinese Yuan (CNY), Indonesia Rupiah (IDR), Malaysian Ringgit (MYR), Philippine’s Peso (PHP), Singapore Dollar (SGD) and Thailand Baht (THB) per US Dollar respectively.
6.2 6.4 6.6 6.8 7.0 7.2
III IV I II III IV I II III IV I II
2018 2019 2020 2021
ER_CNY
Figure 1.
Exchange Rates Full Sample Period 24-hour 01/08/2018 to 31/05/2021 (Continued)
13,000 14,000 15,000 16,000 17,000
III IV I II III IV I II III IV I II
2018 2019 2020 2021
ER_IDR
3.9 4.0 4.1 4.2 4.3 4.4 4.5
III IV I II III IV I II III IV I II
2018 2019 2020 2021
ER_MYR
3.9 4.0 4.1 4.2 4.3 4.4 4.5
III IV I II III IV I II III IV I II
2018 2019 2020 2021
ER_MYR
Figure 1.
Exchange Rates Full Sample Period 24-hour 01/08/2018 to 31/05/2021 (Continued)
1.28 1.32 1.36 1.40 1.44 1.48
III IV I II III IV I II III IV I II
2018 2019 2020 2021
ER_SGD
29 30 31 32 33 34
III IV I II III IV I II III IV I II
2018 2019 2020 2021
ER_THB
Figure 2.
Exchange Rate Returns Full Sample Period 24-hour Day 01/08/2018 to 31/05/2021
The Currencies are Chinese Yuan (CNY), Indonesia Rupiah (IDR), Malaysian Ringgit (MYR), Philippine’s Peso (PHP), Singapore Dollar (SGD) and Thailand Baht (THB) per US Dollar respectively.
-1.2 -0.8 -0.4 0.0 0.4 0.8 1.2
III IV I II III IV I II III IV I II
2018 2019 2020 2021
CNY_RET
-2 -1 0 1 2
III IV I II III IV I II III IV I II
2018 2019 2020 2021
IDR_RET
-0.8 -0.4 0.0 0.4 0.8 1.2
III IV I II III IV I II III IV I II
2018 2019 2020 2021
MYR_RET
Figure 2.
Exchange Rate Returns Full Sample Period 24-hour Day 01/08/2018 to 31/05/2021 (Continued)
-1.5 -1.0 -0.5 0.0 0.5 1.0
III IV I II III IV I II III IV I II
2018 2019 2020 2021
PHP_RET
-.4 -.2 .0 .2 .4 .6
III IV I II III IV I II III IV I II
2018 2019 2020 2021
SGD_RET
-0.8 -0.4 0.0 0.4 0.8 1.2
III IV I II III IV I II III IV I II
2018 2019 2020 2021
THB_RET
Figure 3.
Volatility of Exchange Rate Returns Full Sample
This figure illustrates the volatilities of exchange rate returns Chinese Yuan (CNY), Indonesia Rupiah (IDR), Malaysian Ringgit (MYR), Philippine’s Peso (PHP), Singapore Dollar (SGD) and Thailand Baht (THB) per US Dollar respectively.
The volatilities were calculated using a GARCH (1,1) constant model with Student-t standard errors.
VOL_CNY
0.0 0.5 1.0 1.5 2.0 2.5 3.0
III IV I II III IV I II III IV I II
2018 2019 2020 2021
VOL_IDR
0 5 10 15 20
III IV I II III IV I II III IV I II
2018 2019 2020 2021
0.0 0.5 1.0 1.5 2.0
III IV I II III IV I II III IV I II
2018 2019 2020 2021
VOL_MYR
Figure 3.
Volatility of Exchange Rate Returns Full Sample (Continued)
VOL_PHP
0 1 2 3 4 5
III IV I II III IV I II III IV I II
2018 2019 2020 2021
VOL_SGD
.000 .025 .050 .075 .100 .125 .150
III IV I II III IV I II III IV I II
2018 2019 2020 2021
VOL_THB
0.0 0.2 0.4 0.6 0.8 1.0
III IV I II III IV I II III IV I II
2018 2019 2020 2021
B. Main Results
Our main focus is the five ASEAN currency volatilities namely, IDR, MYR, PHP, SGD and THB. Therefore, in the first part of the spillover analysis, we exclude CNY. We use CNY to test for the robustness of the results by extending the number of currencies to six.
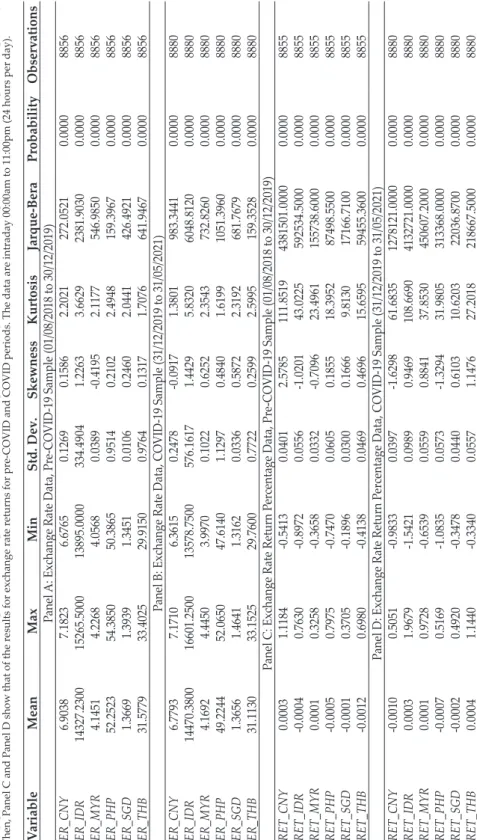
The descriptive analysis for all six currencies is shown in Table 1. We have three main samples. They are the full-sample, the pre-COVID-19 sample, and the COVID-19 sample. When we consider the sample sizes, the pre-COVID-19 period contains 8,856 data points and the COVID-19 sample has 8,880 observations; thus, the two sub-samples are roughly of the same size, paving the way for comparison.
When we compare the means of exchange rates of pre-COVID-19 and COVID-19 sample, the exchange rates have depreciated for IDR and MYR in COVID-19 sample, whereas for the rest of the exchange rates have been appreciated vis-à-vis the US Dollar over the COVID-19 period. However, when we consider standard deviations, except for the THB, the rest of the currencies show higher volatility in the COVID-19 sample.
In Table 2, our main objective is to assess the pairwise correlations among the six selected currencies. We use currency percentage rates of returns to obtain correlations. The highest correlation pair is the SGD-THB which is 0.477 (t-statistic
= 72.42). The second highest pair is SGD-CNY (0.3640, with a t-statistic of 52.057).
All the t-statistics conclude that all the pairwise correlations are significant at 5%
level of significance.
The Table 3 shows the main spillover results for the five currencies. The entries are the estimated contributions to the forecast error variance of volatility from one currency to another. The total spillover index is noted in the right bottom corner of the table. All the results in the table are based on a VAR model of order 4 and generate 10-hour ahead volatility forecast errors. Panel A reveals results for the full sample, Panel B shows results for the pre-COVID-19 period, and, finally, Panel C has results for the COVID-19 sample. When we look at the full sample spillover
“TO” others row, it ranges from 10.47% to 38.68%. The highest is noted by the MYR (38.68%), followed by SGD (25.92%). We read the “FROM” column, which is the last column that states the gross directional volatility from other currencies to IDR is largest (36.31%) followed by contributions from others to the THB (24.19%).
The total volatility spillover over the full sample is 23.47%.
Table 1. Summary Statistics This table reports the summary statistics for six currencies. The Currencies are Chinese Yuan (CNY), Indonesia Rupiah (IDR), Malaysian Ringgit (MYR), Philippine’s Peso (PHP), Singapore Dollar (SGD) and Thailand Baht (THB) per US Dollar respectively. Panel A and Panel B present exchange rate raw data results of pre-COVID and COVID periods respectively. Then, Panel C and Panel D show that of the results for exchange rate returns for pre-COVID and COVID periods. The data are intraday 00:00am to 11:00pm (24 hours per day). Variable Mean Max Min Std. Dev. Skewness Kurtosis Jarque-Bera Probability Observations Panel A: Exchange Rate Data, Pre-COVID-19 Sample (01/08/2018 to 30/12/2019) ER_CNY6.90387.18236.67650.12690.15862.2021272.05210.00008856 ER_IDR14327.230015265.500013895.0000334.49041.22633.66292381.90300.00008856 ER_MYR4.14514.22684.05680.0389-0.41952.1177546.98500.00008856 ER_PHP52.252354.385050.38650.95140.21022.4948159.39670.00008856 ER_SGD1.36691.39391.34510.01060.24602.0441426.49210.00008856 ER_THB31.577933.402529.91500.97640.13171.7076641.94670.00008856 Panel B: Exchange Rate Data, COVID-19 Sample (31/12/2019 to 31/05/2021) ER_CNY6.77937.17106.36150.2478-0.09171.3801983.34410.00008880 ER_IDR14470.380016601.250013578.7500576.16171.44295.83206048.81200.00008880 ER_MYR4.16924.44503.99700.10220.62522.3543732.82600.00008880 ER_PHP49.224452.065047.61401.12970.48401.61991051.39600.00008880 ER_SGD1.36561.46411.31620.03360.58722.3192681.76790.00008880 ER_THB31.113033.152529.76000.77220.25992.5995159.35280.00008880 Panel C: Exchange Rate Return Percentage Data, Pre-COVID-19 Sample (01/08/2018 to 30/12/2019) RET_CNY0.00031.1184-0.54130.04012.5785111.85194381501.00000.00008855 RET_IDR-0.00040.7630-0.89720.0556-1.020143.0225592534.50000.00008855 RET_MYR0.00010.3258-0.36580.0332-0.709623.4961155738.60000.00008855 RET_PHP-0.00050.7975-0.74700.06050.185518.395287498.55000.00008855 RET_SGD-0.00010.3705-0.18960.03000.16669.813017166.71000.00008855 RET_THB-0.00120.6980-0.41380.04690.469615.659559455.36000.00008855 Panel D: Exchange Rate Return Percentage Data, COVID-19 Sample (31/12/2019 to 31/05/2021) RET_CNY-0.00100.5051-0.98330.0397-1.629861.68351278121.00000.00008880 RET_IDR0.00031.9679-1.54210.09890.9469108.66904132721.00000.00008880 RET_MYR0.00010.9728-0.65390.05590.884137.8530450607.20000.00008880 RET_PHP-0.00070.5169-1.08350.0573-1.329431.9805313368.00000.00008880 RET_SGD-0.00020.4920-0.34780.04400.610310.620322036.87000.00008880 RET_THB0.00041.1440-0.33400.05571.147627.2018218667.50000.00008880
Table 2.
Pairwise Correlations of Exchange Rates
This table shows the correlation coefficients for the 6 exchange rates percentage returns. The Currencies are Chinese Yuan (CNY), Indonesia Rupiah (IDR), Malaysian Ringgit (MYR), Philippine’s Peso (PHP), Singapore Dollar (SGD) and Thailand Baht (THB) per US Dollar respectively. The pair-wise test of t-statistics are reported in the brackets.
Variable CNY_RET IDR_RET MYR_RET PHP_RET SGD_RET THB_RET
CNY_RET 1
IDR_RET 0.14961 1
(20.150)
MYR_RET 0.18820 0.10193 1
(25.5180) (13.6457)
PHP_RET 0.1830 0.0733 0.1100 1
(24.7930) (9.7978) (14.738)
SGD_RET 0.3640 0.0772 0.2649 0.2610 1
(52.0579) (10.3138) (36.5926) (36.006)
THB_RET 0.2635 0.0750 0.2010 0.1822 0.4777 1
(36.3787) (10.0201) (27.3277) (24.6786) (72.428)
Table 3.
Volatility Spillover Excluding Chinese CNY
This table reports the spillover results for volatility of five exchange rates: Indonesia Rupiah (IDR), Malaysian Ringgit (MYR), Philippine’s Peso (PHP), Singapore Dollar (SGD) and Thailand Baht (THB) respectively. The results are for Vector AutoRegression (VAR) of order 4, rolling window of 240 hours (10 days) and forecast horizon 10 hours. TO represents for the contribution to others, FROM represents contribution from others and OWN represents on the own.
NET gives the volatility spillover as the difference between gross volatility shocks transmitted to and gross volatility shocks received from all other exchange rates. Here, TSI indicates the Total Spillover Index.
Panel A: Full Sample
VOL_IDR VOL_MYR VOL_PHP VOL_SGD VOL_THB FROM
VOL_IDR 63.69 21.3 5.47 4.35 5.19 36.31
VOL_MYR 1.81 85.81 2.98 5.12 4.28 14.19
VOL_PHP 3.68 5.47 80.41 5.53 4.92 19.59
VOL_SGD 1.57 5.62 5 76.94 10.86 23.06
VOL_THB 3.41 6.29 3.58 10.92 75.81 24.19
TO 10.47 38.68 17.03 25.92 25.25 117.34
OWN 74.16 124.49 97.43 102.87 101.05 TSI
NET -25.84 24.49 -2.57 2.87 1.05 23.47
Panel B: Pre-COVID Sample
VOL_IDR VOL_MYR VOL_PHP VOL_SGD VOL_THB FROM
VOL_IDR 64.45 19.39 5.86 4.7 5.6 35.55
VOL_MYR 1.99 85.29 3.5 5.23 4 14.71
VOL_PHP 4.13 4.13 78.57 7.42 5.74 21.43
VOL_SGD 1.82 3.96 6.95 78.15 9.12 21.85
VOL_THB 3.89 4.98 3.28 10.3 77.55 22.45
TO 11.83 32.47 19.58 27.65 24.46 115.98
OWN 76.28 117.76 98.16 105.8 102.01 TSI
NET -23.72 17.76 -1.84 5.8 2.01 23.2
Now let us consider the two other panels of results which are for the pre- COVID-19 and the COVID-19 sub-samples. The exchange rate return volatility spillover from other currencies to IDR (36.52%), SGD (24.14%) and THB (26.38%) are higher in the COVID-19 sample. On the other hand, volatility spillover to other currencies from MYR (43.64%) is the highest is followed by THB (26.5%) in the COVID-19 sample. When we see the volatility index of the pre-COVID-19 and the COVID-19 sub-samples, 23.2% and 23.68% of return volatility forecast error variances, respectively, in all the five currencies have been noted. This is a slight increase of 2%.
To check for the sensitivity of the results to the choice of the order of VAR, we have considered orders 2 and 8 and the results are reported in Table 4. For the full sample period, when orders are set to 2 and 8, we have similar results for the volatility spillovers in the sense that the directional spillovers from other currencies to IDR is the largest and is followed by the top other two are SGD and the THB.
When the directional spillover to other currencies is considered, it is found highest from the MYR to others at 35%. However, we notice that regardless of the sample selection for VAR(2) the overall spillover index is 20% and meanwhile, when the lag order is 8, the total index is about 29%. Our key interest is to compare the spillover effects in the pre-COVID-19 and the COVID-19 sub-samples. When the VAR(2) model is employed, we have spillover results in Panels C and E for pre- COVID-19 and COVID-19 sub-samples, respectively. Similar to the full sample, we find spillover effect from other currencies to IDR to be the largest with a similar magnitude of spillover. When we consider the “TO” row, we find the spillover from MYR to other currencies to be the largest with a 25% increase in spillovers in the COVID-19 sample. However, the total spillover index is at 20% in both the pre- COVID-19 and the COVID-19 samples. We also use a lag order of 8 and results for the pre-COVID-19 and the COVID-19 samples are in Panels D and F, respectively.
We obtained results that are consistent with the VAR(2) model. Finally, we can conclude that although the total spillover index has not changed much from the pre-COVID-19 to the COVID-19 periods, there are some differences in the directional spillovers of exchange rate volatilities.
Table 3.
Volatility Spillover Excluding Chinese CNY (Continued) Panel C: COVID-19 Sample
VOL_IDR VOL_MYR VOL_PHP VOL_SGD VOL_THB FROM
VOL_IDR 63.48 22.66 5.05 3.99 4.82 36.52
VOL_MYR 1.61 86.18 2.48 5.09 4.65 13.82
VOL_PHP 3.21 6.45 82.47 3.7 4.17 17.53
VOL_SGD 1.27 6.85 3.15 75.86 12.86 24.14
VOL_THB 2.99 7.67 3.94 11.78 73.62 26.38
TO 9.08 43.64 14.62 24.56 26.5 118.4
OWN 72.56 129.82 97.09 100.42 100.11 TSI
NET -27.44 29.82 -2.91 0.42 0.11 23.68
Table 4.
Volatility Spillover with Different Order VARs Excluding Chinese CNY
This table reports the spillover results for volatility of five exchange rate volatilities: Indonesia Rupiah (IDR), Malaysian Ringgit (MYR), Philippine’s Peso (PHP), Singapore Dollar (SGD) and Thailand Baht (THB) respectively.
The results are for Vector AutoRegression (VAR) of order 2 and 8, rolling window of 240 hours and forecast horizon 10 hours. TO represents for the contribution to others, FROM represents contribution from others and OWN represents on the own. NET gives the returns spillover as the difference between gross return shocks transmitted to and gross returns shocks received from all other exchange rates. Here, TSI indicates the Total Spillover Index.
Panel A: Full Sample Volatility (VAR Order 2 and a 240-hour Rolling Window) VOL_IDR VOL_MYR VOL_PHP VOL_SGD VOL_THB FROM
VOL_IDR 67.94 20.09 4.69 3.34 3.93 32.06
VOL_MYR 1.44 88.59 2.04 4 3.94 11.41
VOL_PHP 2.55 4.92 83.33 4.96 4.24 16.67
VOL_SGD 0.94 4.75 4.19 79.48 10.64 20.52
VOL_THB 2.29 5.19 2.61 10.34 79.56 20.44
TO 7.22 34.95 13.53 22.64 22.75 101.09
OWN 75.16 123.54 96.86 102.12 102.31 TSI
NET -24.84 23.54 -3.14 2.12 2.31 20.22
Panel B: Full Sample Volatility (VAR Order 8 and a 240-hour Rolling Window) VOL_IDR VOL_MYR VOL_PHP VOL_SGD VOL_THB FROM
VOL_IDR 58.85 20 6.97 7.83 6.35 41.15
VOL_MYR 2.6 80.11 3.96 7.96 5.37 19.89
VOL_PHP 4.97 7.35 75.04 6.78 5.87 24.96
VOL_SGD 3.2 7.39 6.5 71.43 11.49 28.57
VOL_THB 4.84 7.95 4.68 12.04 70.49 29.51
TO 15.6 42.69 22.11 34.6 29.08 144.08
OWN 74.45 122.8 97.15 106.03 99.57 TSI
NET -25.55 22.8 -2.85 6.03 -0.43 28.82
Panel C: Pre-COVID-19 Volatility (VAR Order 2 and a 240-hour Rolling Window) VOL_IDR VOL_MYR VOL_PHP VOL_SGD VOL_THB FROM
VOL_IDR 68.2 19.39 5.16 3.46 3.79 31.8
VOL_MYR 1.74 88.41 2.43 3.52 3.91 11.59
VOL_PHP 3.74 3.88 80.63 6.85 4.88 19.37
VOL_SGD 1.12 3.43 6.19 80.69 8.57 19.31
VOL_THB 2.52 3.85 2.57 9 82.05 17.95
TO 9.13 30.55 16.35 22.83 21.16 100.02
OWN 77.33 118.96 96.99 103.52 103.21 TSI
NET -22.67 18.96 -3.01 3.52 3.21 20
Panel D: Pre-COVID-19 Volatility (VAR Order 8 and a 240-hour Rolling Window) VOL_IDR VOL_MYR VOL_PHP VOL_SGD VOL_THB FROM
VOL_IDR 59.47 17.18 7.22 9.28 6.85 40.53
VOL_MYR 2.41 79.05 4.45 8.78 5.32 20.95
VOL_PHP 5.12 7 72.57 8.7 6.61 27.43
VOL_SGD 3.17 5.43 8.78 72.88 9.73 27.12
VOL_THB 5.11 6.49 4.6 11.01 72.8 27.2
TO 15.81 36.1 25.04 37.76 28.51 143.23
OWN 75.28 115.15 97.62 110.65 101.31 TSI
NET -24.72 15.15 -2.38 10.65 1.31 28.65
Table 4.
Volatility Spillover with Different Order VARs Excluding Chinese CNY (Continued)
Panel E: COVID-19 Volatility (VAR Order 2 and 240-hour Rolling Window) VOL_IDR VOL_MYR VOL_PHP VOL_SGD VOL_THB FROM
VOL_IDR 68.14 20.33 4.18 3.2 4.15 31.86
VOL_MYR 1.11 88.68 1.65 4.52 4.04 11.32
VOL_PHP 1.34 5.59 86.26 3.13 3.68 13.74
VOL_SGD 0.71 5.62 2.26 78.44 12.97 21.56
VOL_THB 2.09 6.59 2.71 11.95 76.67 23.33
TO 5.25 38.13 10.8 22.79 24.84 101.81
OWN 73.39 126.81 97.06 101.23 101.51 TSI
NET -26.61 26.81 -2.94 1.23 1.51 20.36
Panel F: COVID-19 Volatility (VAR Order 8 and a 240-hour Rolling Window) VOL_IDR VOL_MYR VOL_PHP VOL_SGD VOL_THB FROM
VOL_IDR 58.83 22.14 6.71 6.44 5.89 41.17
VOL_MYR 2.78 80.91 3.53 7.27 5.51 19.09
VOL_PHP 4.78 7.39 77.73 4.91 5.19 22.27
VOL_SGD 3.13 8.97 4.31 70.15 13.44 29.85
VOL_THB 4.68 9.37 4.86 13.2 67.88 32.12
TO 15.37 47.87 19.41 31.82 30.03 144.5
OWN 74.19 128.78 97.14 101.97 97.91 TSI
NET -25.81 28.78 -2.86 1.97 -2.09 28.9
Next in Table 5, we explore the results by increasing the rolling window to a longer period: we set it to 20 days. Here, we use a VAR(4) and a VAR(8) model for the sake of comparison. Yet, when we compare the pre-COVID-19 and COVID-19 sub-samples, the IDR receives the highest contribution of others to explain its forecast error variances. The contribution of other currencies to IDR is 28.97% and 29.68% in the pre-COVID-19 and COVID-19 periods, respectively. On the other hand, the MYR shows the highest contribution to others in explaining the forecast error variance: 24.97% in the pre-COVID-19 period and 37.22% in the COVID-19 period. This represents an increase of 49% in spillovers in COVID-19 sub-sample.
As a final point on these results, we notice some heterogeneity among the volatility of the currencies. When we compare the forecast error variance with a lag of 4, the total spillover index is 18% to 19% while the corresponding effects at lag 8 are 22%
to 23%.
Table 5.
Volatility Spillover Based on a Larger Rolling Window (480 Hours) Excluding Chinese CNY
This table reports the spillover results for volatility of five exchange rate volatilities: Indonesia Rupiah (IDR), Malaysian Ringgit (MYR), Philippine’s Peso (PHP), Singapore Dollar (SGD) and Thailand Baht (THB) respectively.
The results are for Vector AutoRegression (VAR) of order 4 and 8, rolling window of 480 hours and forecast horizon 10 hours. TO represents for the contribution to others, FROM represents contribution from others and OWN represents on the own. NET gives the returns spillover as the difference between gross return shocks transmitted to and gross returns shocks received from all other exchange rates. Here, TSI indicates the Total Spillover Index.
Panel A: Full Sample Volatility (VAR Order 4 and a 480-hour Rolling Window) VOL_IDR VOL_MYR VOL_PHP VOL_SGD VOL_THB FROM
VOL_IDR 69.99 19.22 3.87 3.11 3.82 30.01
VOL_MYR 0.86 89.79 1.4 4.51 3.44 10.21
VOL_PHP 2.76 4.07 84.43 4.34 4.41 15.57
VOL_SGD 0.77 4.61 3.76 80.27 10.59 19.73
VOL_THB 1.81 4.41 2.41 10.85 80.52 19.48
TO 6.19 32.31 11.44 22.81 22.26 95
OWN 76.17 122.1 95.87 103.08 102.78 TSI
NET -23.83 22.1 -4.13 3.08 2.78 19
Panel B: Full Sample Volatility (VAR Order 8 and a 480-hour Rolling Window) VOL_IDR VOL_MYR VOL_PHP VOL_SGD VOL_THB FROM
VOL_IDR 66.62 18 5.08 5.97 4.33 33.38
VOL_MYR 1.23 86.09 1.85 6.71 4.11 13.91
VOL_PHP 3.64 5.3 81.16 5.04 4.86 18.84
VOL_SGD 1.77 5.63 4.61 77.26 10.73 22.74
VOL_THB 2.61 5.46 2.97 11.57 77.4 22.6
TO 9.25 34.39 14.5 29.28 24.04 111.47
OWN 75.87 120.49 95.67 106.54 101.44 TSI
NET -24.13 20.49 -4.33 6.54 1.44 22.29
Panel C: Pre-COVID-19 Volatility (VAR Order 4 and a 480-hour Rolling Window) VOL_IDR VOL_MYR VOL_PHP VOL_SGD VOL_THB FROM
VOL_IDR 71.03 17.08 4.31 3.09 4.49 28.97
VOL_MYR 1.12 89.86 1.79 4.16 3.08 10.14
VOL_PHP 3.29 2.18 82.74 6.07 5.72 17.26
VOL_SGD 0.93 2.79 5.47 81.84 8.97 18.16
VOL_THB 1.68 2.92 1.97 10.85 82.57 17.43
TO 7.02 24.97 13.55 24.17 22.26 91.96
OWN 78.05 114.82 96.29 106.01 104.83 TSI
NET -21.95 14.82 -3.71 6.01 4.83 18.39
Panel D: Pre-COVID-19 Volatility (VAR Order 8 and a 480-hour Rolling Window) VOL_IDR VOL_MYR VOL_PHP VOL_SGD VOL_THB FROM
VOL_IDR 67.7 14.65 5.06 7.45 5.14 32.3
VOL_MYR 1.25 85.45 2.33 7.09 3.88 14.55
VOL_PHP 3.95 4.55 78.63 6.83 6.04 21.37
VOL_SGD 1.64 3.59 6.67 78.98 9.11 21.02
VOL_THB 2.28 3.93 2.62 11.14 80.04 19.96
TO 9.13 26.71 16.68 32.51 24.16 109.2
OWN 76.83 112.17 95.32 111.49 104.2 TSI
NET -23.17 12.17 -4.68 11.49 4.2 21.84
Table 5.
Volatility Spillover Based on a Larger Rolling Window (480 Hours) Excluding Chinese CNY (Continued)
Panel E: COVID-19 Volatility (VAR Order 4 and 480-hour Rolling Window) VOL_IDR VOL_MYR VOL_PHP VOL_SGD VOL_THB FROM
VOL_IDR 70.32 19.84 3.58 2.93 3.32 29.68
VOL_MYR 0.63 89.72 1.04 4.65 3.96 10.28
VOL_PHP 2.35 4.96 86.61 2.77 3.32 13.39
VOL_SGD 0.54 6.31 2.21 78.15 12.79 21.85
VOL_THB 2.03 6.11 2.96 11.41 77.49 22.51
TO 5.56 37.22 9.79 21.75 23.39 97.71
OWN 75.88 126.94 96.4 99.9 100.87 TSI
NET -24.12 26.94 -3.6 -0.1 0.87 19.54
Panel F: COVID-19 Volatility (VAR Order 8 and 480-hour Rolling Window) VOL_IDR VOL_MYR VOL_PHP VOL_SGD VOL_THB FROM
VOL_IDR 66.78 19.81 5.32 4.36 3.73 33.22
VOL_MYR 1.27 86.58 1.42 6.2 4.54 13.42
VOL_PHP 3.47 5.07 84.17 3.4 3.89 15.83
VOL_SGD 1.86 7.55 2.7 75.01 12.89 24.99
VOL_THB 3.07 7.24 3.45 12.54 73.69 26.31
TO 9.66 39.67 12.89 26.5 25.04 113.77
OWN 76.44 126.25 97.06 101.51 98.74 TSI
NET -23.56 26.25 -2.94 1.51 -1.26 22.75
So far, we have discussed results for a forecast horizon of 10-hour. We now test if the results are sensitive to the length of the horizons. The results are reported in Table 6. We observe that regardless of the order of the VAR model and different forecast horizons, the full sample, the pre-COVID-19 sample and the COVID-19 sample, all show the total spillover index to be roughly the same. Nevertheless, when we observe the individual spillover effects, there is some heterogeneity among the values obtained for the pre-COVID-19 versus the COVID-19 sample.
Table 6.
Volatility Spillover at Different Forecast Horizons Excluding CNY
This table reports the spillover results for volatility of five exchange rate volatilities: Indonesia Rupiah (IDR), Malaysian Ringgit (MYR), Philippine’s Peso (PHP), Singapore Dollar (SGD) and Thailand Baht (THB) respectively.
The results are for Vector AutoRegression (VAR) of order 4, rolling window of 480 hours and forecast horizons 20 and 50 hours. TO represents for the contribution to others, FROM represents contribution from others and OWN represents on the own. NET gives the returns spillover as the difference between gross return shocks transmitted to and gross returns shocks received from all other exchange rates. Here, TSI indicates the Total Spillover Index.
Panel A: Full Sample, h=20
VOL_IDR VOL_MYR VOL_PHP VOL_SGD VOL_THB FROM
VOL_IDR 69.97 19.22 3.88 3.11 3.82 30.03
VOL_MYR 0.86 89.77 1.41 4.52 3.44 10.23
VOL_PHP 2.76 4.07 84.41 4.35 4.42 15.59
VOL_SGD 0.77 4.62 3.78 80.23 10.59 19.77
VOL_THB 1.81 4.44 2.45 10.86 80.44 19.56
TO 6.2 32.35 11.51 22.84 22.28 95.17
OWN 76.17 122.12 95.92 103.07 102.72 TSI
NET -23.83 22.12 -4.08 3.07 2.72 19.03
Panel B: Full Sample, h=50
VOL_IDR VOL_MYR VOL_PHP VOL_SGD VOL_THB FROM
VOL_IDR 70.29 19.84 3.61 2.93 3.33 29.71
VOL_MYR 0.63 89.68 1.07 4.65 3.97 10.32
VOL_PHP 2.35 4.96 86.58 2.78 3.32 13.42
VOL_SGD 0.55 6.34 2.25 78.07 12.79 21.93
VOL_THB 2.04 6.16 3.06 11.41 77.33 22.67
TO 5.58 37.31 9.98 21.77 23.41 98.05
OWN 75.86 126.99 96.56 99.84 100.74 TSI
NET -24.14 26.99 -3.44 -0.16 0.74 19.61
Panel C: Pre-COVID, h=20
VOL_IDR VOL_MYR VOL_PHP VOL_SGD VOL_THB FROM
VOL_IDR 71.02 17.08 4.32 3.09 4.49 28.98
VOL_MYR 1.12 89.84 1.8 4.16 3.08 10.16
VOL_PHP 3.29 2.18 82.73 6.08 5.72 17.27
VOL_SGD 0.93 2.79 5.49 81.82 8.97 18.18
VOL_THB 1.68 2.93 1.98 10.87 82.53 17.47
TO 7.03 24.97 13.59 24.21 22.27 92.07
OWN 78.04 114.81 96.32 106.02 104.8 TSI
NET -21.96 14.81 -3.68 6.02 4.8 18.41
Panel D: Pre-COVID, h=50
VOL_IDR VOL_MYR VOL_PHP VOL_SGD VOL_THB FROM
VOL_IDR 71.01 17.07 4.33 3.09 4.49 28.99
VOL_MYR 1.12 89.82 1.81 4.16 3.08 10.18
VOL_PHP 3.29 2.18 82.73 6.08 5.72 17.27
VOL_SGD 0.93 2.79 5.49 81.81 8.97 18.19
VOL_THB 1.68 2.93 1.99 10.87 82.52 17.48
TO 7.03 24.97 13.63 24.21 22.27 92.1
OWN 78.04 114.79 96.35 106.02 104.8 TSI
NET -21.96 14.79 -3.65 6.02 4.8 18.42
Table 6.
Volatility Spillover at Different Forecast Horizons Excluding CNY (Continued) Panel E: COVID, h=20
VOL_IDR VOL_MYR VOL_PHP VOL_SGD VOL_THB FROM
VOL_IDR 70.3 19.85 3.59 2.93 3.33 29.7
VOL_MYR 0.63 89.7 1.05 4.65 3.97 10.3
VOL_PHP 2.35 4.96 86.58 2.78 3.32 13.42
VOL_SGD 0.55 6.34 2.23 78.1 12.79 21.9
VOL_THB 2.04 6.16 3.03 11.41 77.36 22.64
TO 5.58 37.31 9.9 21.77 23.41 97.96
OWN 75.88 127.01 96.48 99.87 100.77 TSI
NET -24.12 27.01 -3.52 -0.13 0.77 19.59
Panel F: COVID, h=50
VOL_IDR VOL_MYR VOL_PHP VOL_SGD VOL_THB FROM
VOL_IDR 70.29 19.84 3.61 2.93 3.33 29.71
VOL_MYR 0.63 89.68 1.07 4.65 3.97 10.32
VOL_PHP 2.35 4.96 86.58 2.78 3.32 13.42
VOL_SGD 0.55 6.34 2.25 78.07 12.79 21.93
VOL_THB 2.04 6.16 3.06 11.41 77.33 22.67
TO 5.58 37.31 9.98 21.77 23.41 98.05
OWN 75.86 126.99 96.56 99.84 100.74 TSI
NET -24.14 26.99 -3.44 -0.16 0.74 19.61
C. Robustness Analysis
For the robustness analysis, in this section of analysis, we extend the number of currencies by adding one of the Asia’s leading exchange rates, namely the CNY vis-à-vis the US Dollar to check the volatility spillover amongst the 6 currencies.
We replicate Tables 3-6 with CNY and the corresponding results are reported in Table 7-10. With the new addition of CNY, still we find the directional spillover from other five currencies to the IDR to be the largest over the full sample period (44.36%). This is flowed by CNY, at 38.35%. The total spillover index is 29.59%. We then divide the full sample into two sub-samples, pre-COVID-19 and COVID-19 samples, and results are shown in Panels B and C, respectively. In the pre- COVID-19 sample, CNY receives the largest spillover from others (45.07%). We notice that regardless of the sub-sample type, directional spillover to the MYR is the largest in all cases and the total spillover indexes are similar too.