Wastewater Electrolysis Cell
for Environmental Pollutants Degradation and Molecular Hydrogen Generation
Thesis by
Kangwoo Cho
In Partial Fulfillment of the Requirements for the degree of
Doctor of Philosophy
CALIFORNIA INSTITUTE OF TECHNOLOGY Pasadena, California
2015
(Defended August 28, 2014)
ii
2015
Kangwoo Cho
All Rights Reserved
Dedicated to…
my lovely wife Soojeon
iv ACKNOWLEDGEMENTS
When I took some coffee breaks with friendly squirrels on campus, I used to imagine the moment I write this section, and that moment is now in front of me. Over the last four years of my graduate study in Caltech, I feel myself getting solid both in theory and experiments with respect to environmental chemistry and energy science. I was sincerely happy and watched my enthusiasm soar as I plowed through these fields. My experience of Caltech deeply encouraged me to devote my entire carrier to enhancing the science and technology for environments. I would like to express my gratitude to a number of people who have helped me to get through the Environmental Science and Engineering PhD program at Caltech
First of all, my foremost gratitude should be given to my academic advisor, Professor Michael R. Hoffmann. Without a doubt, he would be the world’s best advisor if the Times Higher Education compiled a ranking for advisors. Professor Hoffmann has given me a lot of freedom and inspiration to discover my own path of research. He has been always supportive and encouraged me with excessive compliments which were often more than I deserved. Among many other virtues as a mentor, I have to point out his valuable comments stemming from his boundless knowledge on a variety of topics in environmental science, as well as his friendship and kind consideration for my personal life in Pasadena.
Prof. Hoffmann allowed me numerous opportunities to teach graduate level classes and to participate in conferences, which definitely cultivated my academic abilities. I also wish to thank the committee members for my qualification exam, candidacy exam, and thesis defense, which include Prof. William A. Goddard III, Prof. John H. Seinfeld, Prof. Mitchio Okumura, Prof. Jess F. Adkins, Prof. Paul O. Wennberg, and Prof. Jared Renton Leadbetter.
It was my great honor to make team efforts with the former, current, and future Hoffmann Group members. I enjoyed collaborating with the ‘Gates Team’, specifically Daejung Kwon, Dr. Yan Qu, Dr. Pei Xiong, Dr. Su Young Ryu, Clement Cid, Cody Finke, Asghar Aryanfar, Dr. Penvipha Satsanarukkit, and many others. The field experience in India will be especially unforgettable. I believe they will continue to devote their efforts to enhance livability in developing worlds. I was lucky to get helpful advice from visiting professors Prof. Wonyong Choi, Dr. Kyung-Guen Song, Prof. Kwhang-Ho Choo, Prof.
Hyunwoong Park, and Prof. Jungwon Kim. It was my pleasure to work with visiting students Jieun Shin, Joycie Jiao, Hanspeter Zöllig, and many others. Novel and penetrating comments by Dr. A. J. Colussi were always impressive during the group meeting. Many thanks are due to Dr. Nathan Dalleska for technical support at the Environmental Analysis Center and Dr. Tae-Kyu Lee in Nano-Pac for the collaboration in preparation of electrodes and reactor systems. My thanks to office mates Rifka Kameel, Francesca Riboni, Dr.
Himanshu Mishra, and colleagues Dr. Yi Zhang, Dr. Dr. Yubao Zhao, and many others.
I also want to acknowledge the Bill and Melinda Gates Foundation for the financial support for this study and DOW Chemicals for recognizing my work with the 2012 SISCA award. I owed my graduate study to many people in the Korea Institute of Science and Technology, including Dr. Kyu-Hong Ahn, Dr. Seockheon Lee, Dr. Kyung-Guen Song, and Dr. Seok Won Hong.
Finally, I would like to thank my wife Soojeon Yoo for always being next to me. My parents and parents-in-law gave us constant support and bore the long-distance trip to visit us. None of my academic progress and happy life in Pasadena would have been possible without my family.
vi ABSTRACT
This study proposes a wastewater electrolysis cell (WEC) for on-site treatment of human waste coupled with decentralized molecular H2 production. The core of the WEC includes mixed metal oxides anodes functionalized with bismuth doped TiO2 (BiOx/TiO2). The BiOx/TiO2 anode shows reliable electro-catalytic activity to oxidize Cl- to reactive chlorine species (RCS), which degrades environmental pollutants including chemical oxygen demand (COD), protein, NH4+, urea, and total coliforms. The WEC experiments for treatment of various kinds of synthetic and real wastewater demonstrate sufficient water quality of effluent for reuse for toilet flushing and environmental purposes. Cathodic reduction of water and proton on stainless steel cathodes produced molecular H2 with moderate levels of current and energy efficiency. This thesis presents a comprehensive environmental analysis together with kinetic models to provide an in-depth understanding of reaction pathways mediated by the RCS and the effects of key operating parameters. The latter part of this thesis is dedicated to bilayer hetero-junction anodes which show enhanced generation efficiency of RCS and long-term stability.
Chapter 2 describes the reaction pathway and kinetics of urea degradation mediated by electrochemically generated RCS. The urea oxidation involves chloramines and chlorinated urea as reaction intermediates, for which the mass/charge balance analysis reveals that N2
and CO2 are the primary products. Chapter 3 investigates direct-current and photovoltaic powered WEC for domestic wastewater treatment, while Chapter 4 demonstrates the feasibility of the WEC to treat model septic tank effluents. The results in Chapter 2 and 3 corroborate the active roles of chlorine radicals (Cl·/Cl2-·) based on iR-compensated anodic
potential (thermodynamic basis) and enhanced pseudo-first-order rate constants (kinetic basis). The effects of operating parameters (anodic potential and [Cl-] in Chapter 3; influent dilution and anaerobic pretreatment in Chapter 4) on the rate and current/energy efficiency of pollutants degradation and H2 production are thoroughly discussed based on robust kinetic models. Chapter 5 reports the generation of RCS on Ir0.7Ta0.3Oy/BixTi1-xOz hetero- junction anodes with enhanced rate, current efficiency, and long-term stability compared to the Ir0.7Ta0.3Oy anode. The effects of surficial Bi concentration are interrogated, focusing on relative distributions between surface-bound hydroxyl radical and higher oxide.
viii TABLE OF CONTENTS
Dedication ... iii
Acknowledgements ... iv
Abstract ... vi
Table of Contents ... viii
List of Figures ... xi
List of Tables ... xv
Chapter 1: Introduction ... 1
1.1. Human Needs ... 2
1.2. Technological Background ... 3
1.2.1. Wastewater Electrolysis Cell ... 3
1.2.2. Electrochemical Degradation of Environmental Pollutants ... 4
1.2.3. Molecular H2 Production from (PV-Powered) Electrolysis of Wastewater .... 6
1.2.4. Mixed Metal Oxides Anodes ... 7
1.2.5. Hetero-junction Anodes with BiOx/TiO2 Functionalities ... 9
1.3. Objectives and Potential Contribution of the Thesis ... 12
1.4. Thesis Overview ... 13
1.5. References ... 14
Chapter 2: Urea Degradation by Electrochemically Generated Reactive Chlorine Species: Products and Reaction Pathways ... 17
2.1. Introduction ... 19
2.2. Experimental Section ... 21
2.2.1. Preparation of BiOx/TiO2 Anode and Electrolysis Cell ... 21
2.2.2. Potentiostatic Electrolysis of NaCl Solutions with or without Urea ... 22
2.2.3. Analytical Methods ... 24
2.3. Results and Discussion ... 25
2.3.1. RCS Generation on BiOx/TiO2 Anode ... 25
2.3.2. Aqueous and Gaseous Products Formed During Urea Degradation ... 26
2.3.3. Urea Degradation Kinetics in a Divided Cell ... 31
2.3.4. Urea Transformation Characteristics in Single Compartment Cell ... 35
2.3.5. Byproducts Formation ... 39
2.3.6. Urea Degradation Pathways ... 42
2.4. Supporting Information ... 43
2.4.1. Quantification of Molar Flow Rates of Gas Products ... 43
2.4.2. Measurement of Urea Concentration ... 44
2.5. References ... 45
Chapter 3: Effects of Anodic Potential and Chloride Ion On Overall Reactivity In Electrochemical Reactors Designed for Solar-Powered Wastewater Treatment ... 49
3.1. Introduction ... 51
3.2. Experimental Section ... 52
3.2.1. Electrode Module ... 52
3.2.2. Characterization of the BiOx/TiO2 Anode ... 53
3.2.3. DC Powered Wastewater Electrolysis ... 53
3.2.4. Prototype PV Powered Wastewater Electrolysis ... 54
3.2.5. Analysis ... 55
3.3. Results and Discussion ... 55
3.3.1. Characteristics of the BiOx/TiO2 Anodes ... 55
3.3.2. Impact of Ea and [Cl–]ext. on COD Removal ... 58
3.3.3. Impact of Cl· and Cl2–· on COD Removal ... 61
3.3.4. Nitrogen Species ... 65
3.3.5. CE and Energy Consumption for Anodic Reactions ... 67
3.3.6. Hydrogen Production ... 70
3.3.7. Prototype (20 L) PV Powered Wastewater Electrolysis ... 71
3.4. Supporting Information ... 74
3.4.1. Electrochemical Methods ... 74
3.4.2. Prototype PV-powered Wastewater Electrolysis ... 74
3.4.3. Analysis of Total and Fecal Coliform Concentration ... 76
3.5. References ... 76
Chapter 4: Electrochemical Treatment of Human Waste Coupled with Molecular Hydrogen Production ... 81
4.1. Introduction ... 83
4.2. Experimental Section ... 86
4.2.1. BiOx/TiO2 Electrode Preparation ... 86
4.2.2. Electrochemical Setup ... 86
4.2.3. Electrode Characterization ... 87
4.2.4. Wastewater Sample Preparation ... 88
4.2.5. WEC Experiments ... 89
4.2.6. Chemical Analyses ... 89
4.3. Results and Discussion ... 90
4.3.1. Voltammetric Characteristics of the WEC ... 90
4.3.2. Electrochemistry of the BiOx/TiO2 Anode in Dilute Chloride Solutions ... 92
4.3.3. Electrochemical Kinetics in Dilute Chloride Solutions ... 97
4.3.4. Electrochemical Treatment of Fresh Urine ... 101
4.3.5. Chlorine Transformation in the WEC with Model STEs ... 104
4.3.6. COD Removal Characteristics in WEC with Model STEs ... 109
4.3.7. Nitrogen Removal Characteristics in the WEC with Model STEs ... 113
4.3.8. Current Efficiency and Energy Consumption of the WEC ... 115
4.3.9. Hydrogen Production in WEC with Model STEs ... 120
4.4. Outlook for the Future ... 123
4.5. Supporting Information ... 125
4.5.1. Materials ... 125
4.5.2. BiOx/TiO2 Electrode Preparation ... 126
x
4.5.3. Electrochemical Methods ... 127
4.5.4. Model Septic Tank Effluent Preparation ... 127
4.5.5. Analyses ... 127
4.5.6. Kinetic Equations in the Absence of Oxidizable Pollutants ... 129
4.5.7. Instantaneous Current Efficiency (ICE) for Free Chlorine (FC) and Chlorate without the Presence of Pollutants ... 130
4.5.8. Kinetic Equations in the Presence of Pollutants ... 130
4.5.9. Instantaneous Current Efficiency (ICE) for COD degradation ... 131
4.6. References ... 132
Chapter 5: BixTi1-xOz Functionalized Hetero-junction Anode with an Enhanced Reactive Chlorine Generation Efficiency in Dilute Aqueous Solutions ... 139
5.1. Introduction ... 141
5.2. Experimental Section ... 144
5.2.1. Ir0.7Ti0.3Oy/BixTi1-xOz Hetero-junction Anode Preparation ... 144
5.2.2. Electroanalysis... 145
5.2.3. Potentiostatic RCS Generation and Formate Ion Degradation ... 146
5.2.4. Surface Characterization ... 147
5.2.5. Accelerated Life Test ... 147
5.3. Results ... 147
5.3.1. Physico-chemical Properties ... 147
5.3.2. Voltammetric Characteristics ... 154
5.3.3. Reactive Chlorine Species Generation ... 158
5.3.4. Formate Ion Degradation ... 161
5.3.5. Stability ... 165
5.4. Discussion ... 167
5.5. References ... 173
Chapter 6: Outlook for the Future ... 178
6.1. Reaction Network in Wastewater Electrolysis Cell ... 179
6.2. Application Scenarios of the WEC ... 181
6.2.1. Toilet Wastewater Treatment ... 181
6.2.2. Treatment of Other High Salinity Wastewater ... 182
6.3. References ... 185
LIST OF FIGURES
Number Page
Figure 1.1. Schematic diagram of photovoltaic-powered wastewater electrolysis cell for on-site waste treatment for reuse with simultaneous solar energy storage by hydrogen production ... 4 Figure 1.2. A schematic diagram of direct oxidation of organics (R) and indirect
oxidation mediated by reactive chlorine species (RCS) on metal oxide (MOx) electrodes ... 8 Figure 1.3. Volcano plot of the overpotential of oxygen evolution reaction (OER) for
various types of metal oxide electrode as a function of enthalpy change for lower to higher oxide ... 9 Figure 1.4. Detailed fabrication procedure for slurry coat and overcoat described in
Table 1.1 ... 11 Figure 1.5. Overall composition of this thesis ... 13 Figure 2.1. Schematic diagram of electrolysis cells (working volume: 60 mL) used in
this study ... 22 Figure 2.2. Current efficiency (circle) and rate (square) of reactive chlorine generation
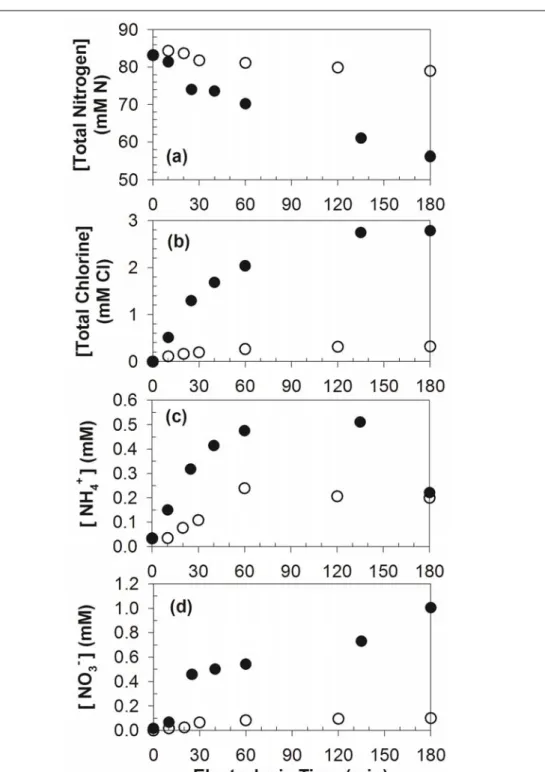
together with current density (triangle) on average as functions of applied anodic potential during potentiostatic electrolysis of 50 mM NaCl solutions in single compartment cell ... 26 Figure 2.3. Time profiles of (a) total nitrogen, (b) total chlorine (ClDPD), (c) NH4+, and
(d) NO3- concentration during potentiostatic electrolysis of 41.6 mM urea solutions with 50 mM Cl- (60 mL) in divided cell ... 27 Figure 2.4. Time profiles of urea concentration during control electrolysis of 41.6 mM
urea solutions in a divided cell ... 28 Figure 2.5. Relative intensities of ion fragments in quadrupole mass spectrometer
analysis of gaseous products during potentiostatic electrolysis of 41.6 mM urea solutions with 50 mM Cl- (60 mL) in single compartment cell ... 30 Figure 2.6. Time profiles of relative intensities for ion fragments m/z 2 and 28 in
quadrupole mass spectrometer analysis during potentiostatic electrolysis of 41.6 mM urea solutions with 50 mM Cl- (60 mL) in divided cell ... 32 Figure 2.7. Time profiles of total nitrogen (circle), total chlorine (triangle), ammonium
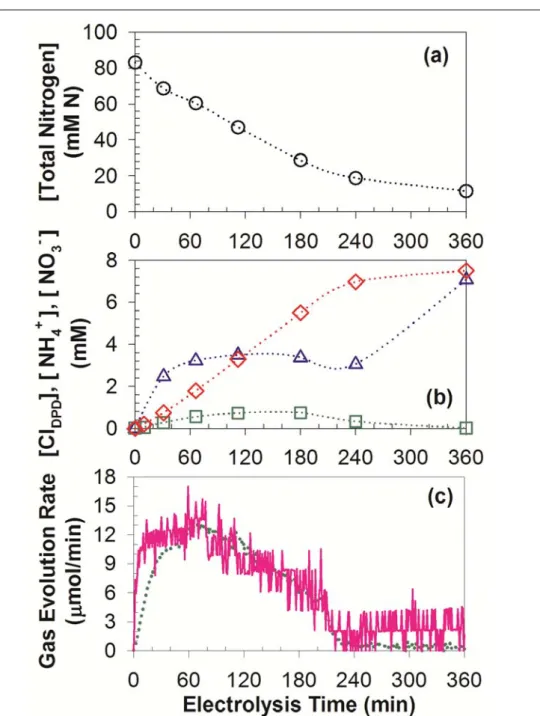
(square), and nitrate (diamond) concentration together with molar flow rate of N2 (solid line) and CO2 (dotted line) during potentiostatic electrolysis of 41.6 mM urea with 50 mM Cl- (60 mL) in single compartment cell ... 36 Figure 2.8. Total Nitrogen (TN) concentrations as functions of specific passed charges
during potentiostatic electrolysis of 41.6 mM urea solutions with 50 mM Cl- (60 mL) in a divided (triangle) and single compartment (square) cell ... 39 Figure 2.9. Evolutions of ClO3- concentration as functions of electrolysis times and
(inset) specific passed charges during potentiostatic electrolysis of 41.6 mM urea solutions with 50 mM Cl- (60 mL) in a divided (triangle) and single compartment (square) cell ... 40 Figure 2.10. Proposed reaction pathways of urea degradation by electrochemically
generated reactive chlorine species (RCS) ... 42
xii Figure 2.11. Time profiles of urea concentration during potentiostatic electrolysis of 41.6
mM urea solutions with 50 mM Cl- (60 mL) as control ... 45 Figure 3.1. Cyclic voltammetry of the BiOx/TiO2 anode in 30 mM NaCl solution with
three repetitive scans at a scan rate of 5 mV sec–1 ... 56 Figure 3.2. Evolution of current densities along with variations in Cl– concentration
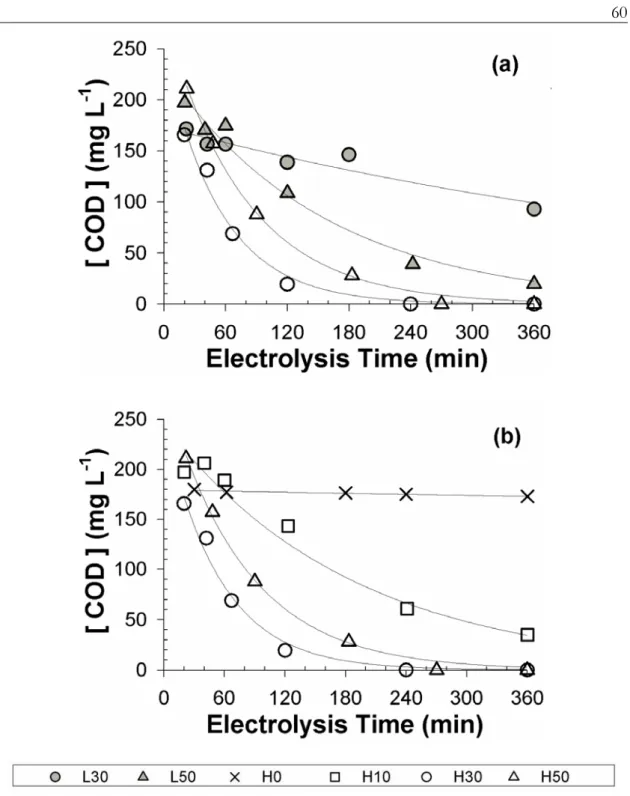
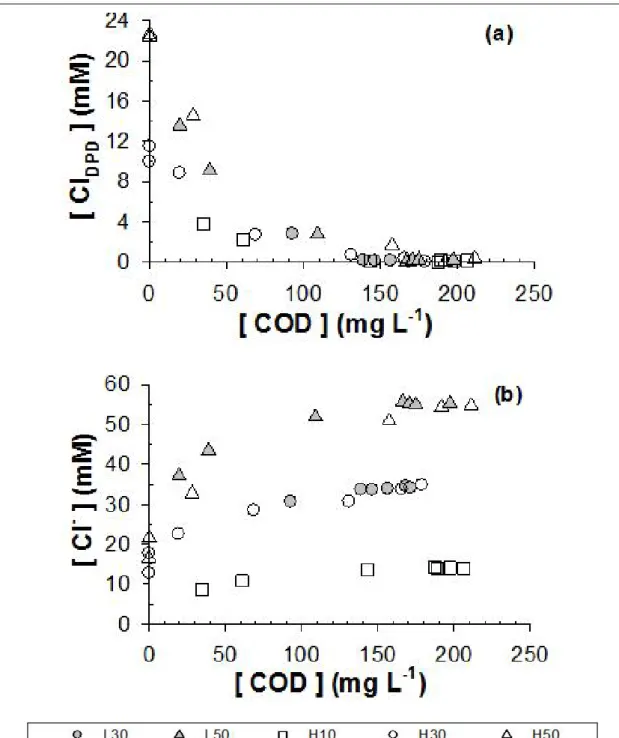
under variable applied anodic potential (L: 2.2 V, H: 3.0 V NHE) and added Cl– concentration (0, 10, 30, 50 mM) in electrolysis experiments using domestic wastewater samples ... 59 Figure 3.3. Time profiles of COD concentration under variable applied anodic potential
(L: 2.2 V, H: 3.0 V NHE) and added Cl– concentration (0, 10, 30, 50 mM) in electrolysis experiments using domestic wastewater samples ... 60 Figure 3.4. Evolutions of (a) total chlorine (ClDPD) and (b) Cl– concentration as
functions of variations in COD concentration under variable applied anodic potential (L: 2.2 V, H: 3.0 V NHE) and added Cl– concentration (10, 30, 50 mM) in electrolysis experiments using domestic wastewater samples ... 63 Figure 3.5. Time profiles of ClO3–
concentration in electrolysis experiments using domestic wastewater samples under variable applied anodic potential (L:
2.2 V, H: 3.0 V NHE) and added Cl– concentration (0, 10, 30, 50 mM) ... 65 Figure 3.6. Time profiles of (a) NH4+ and (b) NO3– concentration under variable applied
anodic potential (L: 2.2 V, H: 3.0 V NHE) and added Cl– concentration (0, 10, 30, 50 mM) in electrolysis experiments using domestic wastewater samples ... 66 Figure 3.7. General current efficiencies for anodic reactions including COD oxidation,
formation of N2, NO3–, ClO3–, and free chlorine under variable applied anodic potential (L: 2.2 V, H: 3.0 V NHE) and added Cl– concentration (10, 30, 50 mM) in electrolysis experiments using domestic wastewater samples ... 67 Figure 3.8. Time profiles for normalized concentration of total and fecal coliform
during the photovoltaic-powered wastewater electrolysis cell (PWEC, 20 L) experiment using domestic wastewater (cell voltage: 4.9 V, added Cl– concentration: 50 mM) ... 73 Figure 3.9. Ohmic resistance between anode and reference electrode (R) and electric
conductivity of bulk electrolyte as functions of added Cl– concentration ([Cl–]ext.) in bench-top electrolysis experiments using domestic wastewater samples ... 75 Figure 4.1. Dependence of (a) iR compensated anodic potential (Ea – iR) on applied
anodic potential (Ea), (b) cell potential (Ea – Ec) on Ea, and (c) logarithmic current density (J) on the Ea – iR during chronoamperometric experiment in a single compartment electrolysis cell with 10 mM (square, R: 21.9 Ω), 30 mM (triangle, R: 6.8 Ω), and 50 mM (circle, R: 4.8 Ω) NaCl solution (275 mL) ... 91 Figure 4.2. Cyclic voltammetry (CV) of a single compartment electrolysis cell with 50
mM NaCl (σ: 5.5 mS cm–1, R: 4.5 Ω, pH: 6.6) or 50 mM NaClO4 (inset, σ:
5.1 mS cm–1, R: 4.6 Ω, pH: 6.6) solution (275 mL) ... 93 Figure 4.3. (a) Evolution of the formate concentration and (b) current variation under
sequential substitution (2 mL, arrows) with 10 mM NaCOOH (σ: 0.92 mS/cm) in a potentiostatic (Ea: 3 V), single compartment electrolysis cell ... 95
Figure 4.4. The variation of chloride (circle), free chlorine (triangle), and chlorate (square) concentration as a function of (a) electrolysis time and (b) specific charge passed during potentiostatic (Ea : 3 V) electrolysis in 30 mM (filled, R: 7.0 Ω) and 50 mM (empty, R: 5.0 Ω) NaCl solution (55 mL) ... 99 Figure 4.5. Evolution of (a) chlorine species, (b) organic species, (c) nitrogen species,
and (b inlet) cations (Ca2+, Mg2+) concentration in a potentiostatic (Ea: 3 V) WEC experiment (J: 247 ± 6 A m–2, Ea – iR: 2.15 ± 0.02 V, Ea – Ec: 5.41 ± 0.04 V) with diluted human urine (pH: 6.6, σ: 6.05 mS cm–1, 55 mL) ... 103 Figure 4.6. Evolution of (a) current density (J), (b) iR-compensated anodic potential
(Ea – iR), and (c) cell voltage (Ea – Ec) in potentiostatic (Ea: 3 V) WEC experiment with model septic tank effluents ... 105 Figure 4.7. Time profiles of (a) chloride, (b) chlorate, and (c) ClDPD concentration
together with (b, inset) scatter plots of increase of chlorate versus decrease of chloride concentration, (d) COD versus chloride concentration, and (e) ammonium ion versus chloride concentration in potentiostatic (Ea: 3 V) WEC experiments with model septic tank effluents ... 107 Figure 4.8. Time profiles of COD concentration in potentiostatic (Ea: 3 V) WEC
experiments with model septic tank effluents ... 110 Figure 4.9. Scatter plot for (a) protein, (b) carbohydrate, and (c) carboxylates
concentration versus COD concentration together with (a, inlet) pseudo- first-order rate constants for protein degradation in potentiostatic (Ea: 3 V) WEC experiments with model septic tank effluents ... 112 Figure 4.10. Time profiles of (a) TN, (b) NH4+, and (c) NO3– concentration together
with scatter plots for (a, inlet) TN versus NH4+ concentration and (c, inlet) NO3–
versus removed NH4+
concentration in potentiostatic (Ea: 3 V) WEC experiments with model septic tank effluents ... 114 Figure 4.11. Variations in (a) COD concentration, (b) TN concentration, (c) nitrate
concentration, and (d) chlorate concentration as a function of specific passed charge in potentiostatic (Ea: 3 V) WEC experiments with model septic tank effluents ... 117 Figure 4.12. Average current efficiency for COD, nitrogen, and chlorine conversion,
and (b) specific energy consumption for COD and total nitrogen on average in potentiostatic (Ea: 3 V) WEC experiments with model septic tank effluents ... 118 Figure 4.13. Dependency of (a) generation rate of total gaseous products (Q, solid
circle), (b) volumetric fraction of hydrogen (XH2, void circle), (c) molar generation rate of hydrogen (FH2, square), (d) current and energy efficiency (CE in triangle and EE in diamond) for hydrogen generation on average current density (J) during gas collection (80 – 110 min and 300 – 330 min) in potentiostatic (Ea: 3 V) WEC experiments with model septic tank effluents ... 121 Figure 4.14. (a) Variation in absorbance spectra (270 – 500 nm) along with the
electrolysis time and (b) absorbance at 425 nm as a function of electrolysis time in potentiostatic (Ea: 3 V) WEC experiments with STE4 ... 124 Figure 5.1. Scanning Electron Microscopy (SEM) images of horizontal view for
Ir0.7Ta0.3Oy/BixTi1-xOz hetero-junction anode with variable molar fraction of Bi with magnification of ×5000 (a – e) or ×1000 (f) ... 148
xiv Figure 5.2. Scanning Electron Microscopy (SEM) image (a) of cross-section view for
Ir0.7Ta0.3Oy /Bi0.3Ti0.7Oz hetero-junction anode with Energy Dispersive Spectroscopy (EDS) mapping of Ti (b), Bi (c), Ir (d), and Ta (e) ... 149 Figure 5.3. X-ray diffraction patterns of hetero-junction anodes Ir0.7Ta0.3Oy / BixTi1-
xOz with variable molar fraction (x) of Bi (a) referenced with a library for metal oxides of interests (b) ... 151 Figure 5.4. Fourier transform infrared spectroscopy with attenuated total reflectance
(FTIR-ATR) analysis of Ir0.73Ta0.27Oy/BixTi1-xOz hetero-junction anodes with variable molar fraction (x) ... 153 Figure 5.5. (a) Current generation during linear sweep voltammetry (scan rate: 5 mV
sec-1) together with (a, inset) ohmic resistance measured by current interruption and (b) integrated charge (Q*) during cyclic voltammetry (scan range: 0.2 ~ 1.0 V NHE, scan rate: 20 mV sec-1) with Ir0.73Ta0.27Oy
/BixTi1-xOz hetero-junction anodes with variable molar fraction (x) ... 156 Figure 5.6. Cyclic voltammogram of Ir0.7Ta0.3Oy/BixTi1-xOz hetero-junction anode
with variable molar fraction of Bi (x) referenced with Ir0.7Ta0.3Oy anode ... 158 Figure 5.7. (a) Mean current density together with (b) specific rate and (c) current
efficiency of reactive chlorine species generation during the course of potentiostatic electrolysis with Ir0.7Ta0.3Oy/BixTi1-xOz hetero-junction anodes with variable molar fraction (x) ... 160 Figure 5.8. Time profiles of formate ion oxidation during the course of potentiostatic
electrolysis with Ir0.7Ta0.3Oy/BixTi1-xOz hetero-junction anodes with variable molar fraction (x) ... 163 Figure 5.9. Observed pseudo-first-order rate constant of formate ion oxidation with
corresponding surface hydroxyl radical concentration during the course of potentiostatic electrolysis with Ir0.7Ta0.3Oy/BixTi1-xOz hetero-junction anodes with variable molar fraction (x) ... 164 Figure 5.10. Variations of cell voltage (a) together with cumulative molar amounts of
dissociated Ti (b) and Bi (c) during the course of galvanostatic electrolysis with Ir0.7Ta0.3Oy/BixTi1-xOz hetero-junction anodes with variable molar fraction (x) ... 166 Figure 5.11. Relationship between Q* as a parameter of electrochemically active
surface area and crystalline dimension estimated from XRD intensity by Scherer equation ... 168 Figure 5.12. Estimated rate constant for transition from surface bound hydroxyl
radical to higher oxide in 50 mM NaCOOH solutions ... 171 Figure 6.1. Reaction network in wastewater electrolysis cell ... 179 Figure 6.2. Application scenario of wastewater electrolysis cell for treatment of
wastewater from a 30 capita public toilet ... 181
LIST OF TABLES
Number Page
Table 1.1. Fabrication procedure of BiOx/TiO2 hetero-junction electrodes used in this study (Chapter 2 – 4) ... 10 Table 2.1. The ohmic drop compensated anodic potential (Ea – iR) and current density
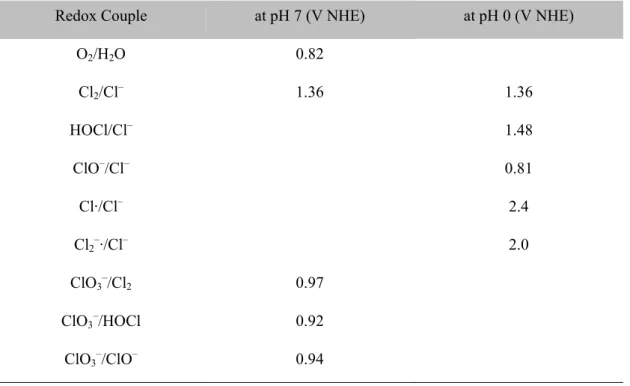
(J) on average during the electrolysis of 41.6 mM urea solutions with 50 mM chloride (60 mM) under variable cell types and applied potentials (Ea) .... 34 Table 3.1. Composition of residential-strength wastewater used in this study ... 54 Table 3.2. Reduction potential (E) at pH 7 and standard reduction potential (E0) at pH
0 for several redox couples involved in the electrochemical reactions ... 56 Table 3.3. The iR-compensated anodic potential (Ea – IR), cell voltage (Ea – Ec),
current density (J), and power consumption (P) on average under variable applied anodic potential (Ea; L: 2.2 V, H: 3.0 V NHE) and added Cl– concentration ([Cl–]ext.; 0, 10, 30, 50 mM) in electrolysis experiments using domestic wastewater samples ... 58 Table 3.4. Sampling time when COD below 30 mg L–1 was observed (tCOD30),
concentration of COD, NO3–, ClO3– and total chlorine at tCOD30, and specific energy consumption (SEC) for unit COD removal at tCOD30 under variable applied anodic potential (L: 2.2 V, H: 3.0 V NHE) and added Cl– concentration (10, 30, 50 mM) in electrolysis experiments using domestic wastewater samples ... 69 Table 3.5. Hydrogen evolution for a given duration (200 – 230 min) under variable
applied anodic potential (L: 2.2 V, H: 3.0 V NHE) and added Cl– concentration (10, 30, 50 mM) in electrolysis experiments using domestic wastewater samples ... 70 Table 4.1. Composition of the as-received domestic wastewater (DWW), urine, and
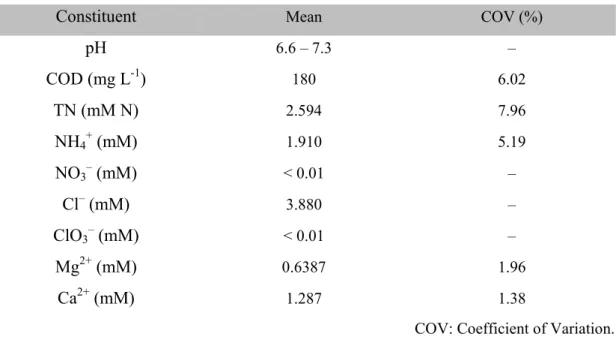
model septic tank effluent ... 88
1 C h a p t e r 1
INTRODUCTION
1.1. HUMAN NEEDS
Current world water crisis manifests that more than 2.5 billion people worldwide lack access to improved sanitation and waste disposal facilities, most often in developing areas such as South Asia, Indonesia and Africa.1 In these emerging countries, human waste and open defecation are major sources of waterborne diseases. The biochemical oxygen demand (BOD) from human waste discharge into receiving waters is becoming a threat to biodiversity.2 Consequently, there have been growing demands for research and development to find breakthroughs in on-site wastewater treatment and water reuse technologies. When considering the deficiency of underground infrastructures, water treatment and reuse practices suitable to use in the developing world should be self- contained with reduced consumptions of water, energy, and capital costs.3,4 Even in the developed world, a growing need for sustainability and water treatment capacity along with an increase in population density has forced water treatment criteria more stringent in order to enhance livability and water use efficiency.5 Corresponding demands for reduction in the total maximum daily loads of pollutants also drive towards on-site wastewater treatment practices due to difficulties in building or retrofitting a centralized wastewater treatment plant.4
On the other hand, extensive efforts are underway to develop renewable energy sources with negligible carbon footprints. Electrochemical water splitting is often used for the production of molecular hydrogen via alkaline and solid oxide electrolysis that have current efficiencies for a hydrogen production up to 67%.6 The dominant fraction of the hydrogen production cost is coming from the electricity consumption and partially the
3 operational costs for chemicals including potassium hydroxide or other solid electrolytes.
The US department of energy7 established a goal to reduce the total hydrogen production cost by virtually 50% in within the next 10 years. Therefore, a different strategy to finding an alternative electrolyte is required to reduce the electricity and chemical reagents consumption for molecular hydrogen production.
1.2. TECHNOLOGYCAL BACKGROUND
1.2.1. Wastewater Electrolysis Cell. A well-designed wastewater electrolysis cell (WEC, Figure 1.1) can provide a feasible approach for self-sustainable on-site wastewater treatment with simultaneous decentralized H2 production. Chloride ion is a ubiquitous, naturally occurring anion providing electric conductivity and, when employing saline wastewater as a background electrolyte for electrochemical water splitting, the chloride ion is oxidized to reactive chlorine species (RCS, Cl·, Cl2, and conjugate species) to remove environmental pollutants including organics, ammonium ion, and coliform bacteria.8 This green chemistry that acts without external chemicals can be totally driven by photovoltaic (PV) panels,9 which makes the PV-powered WEC (PWEC) a traditional infrastructure-free approach.10 Simultaneously with the wastewater treatment, solar energy storage is possible by cathodic production of H2, which can be utilized as a secondary energy source for the PWEC or for other domestic living purposes.11 By this dual-functioning approach, one can reduce the cost of electrolytic H2 production, particularly the cost for electrolyte and electricity, by saving energy for water treatment. Recent statistics suggest that handling water and wastewater occupied up to 4% of total electricity consumption in
Figure 1.1. Schematic diagram of photovoltaic-powered wastewater electrolysis cell for on-site waste treatment for reuse with simultaneous solar energy storage by hydrogen production.
the US and the collection and treatment of wastewater consume up to 5 Wh of electricity per gallon of wastewater in California.12
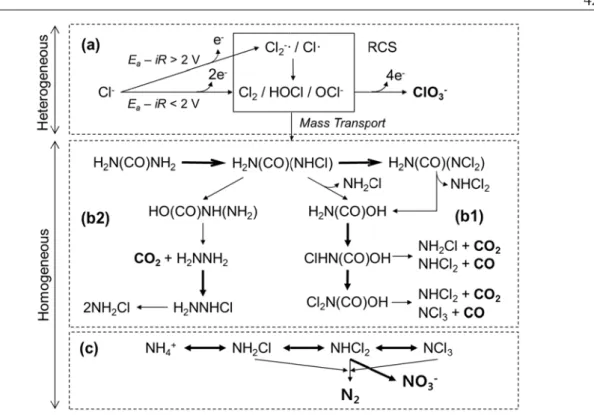
1.2.2. Electrochemical Degradation of Environmental Pollutants. The electrochemical system has often been used for treatment of high-salinity wastewater such as dye (textile) wastewater, landfill leachate, olive mill wastewater, tannery wastewater, livestock industry wastewater, and reverse osmosis concentrates, among many other usages. In addition, degradations (mostly oxidative) of non-biodegradable or recalcitrant environmental pollutants (pesticides, pharmaceuticals and personal care products, polycyclic aromatic hydrocarbons, and other aliphatic/phenolic compounds) have been widely investigated in electrochemical cells, usually employing laboratory-generated electrolyte (substrates of interest in background electrolyte). More thorough reviews on the electrochemical wastewater treatment can be found in recent reports by Panizza and Cerisola,13 Martinez- Huitle and Ferro,14 and Chaplin.15
5 Electrochemical wastewater treatment systems with a wide array of electrodes have conventionally categorized the electro-catalytic anodes into the following two groups:
active electrodes and non-active anodes. Since the non-active anodes actually do catalyze heterogeneous oxidation of environmental pollutants, these terminologies should be interpreted in terms of electro-catalytic activity for oxygen evolution reaction (OER). In other words, the most common non-active anodes include SnO2, PbO2, and boron-doped diamond (BDD), which show relatively high over-potential for OER. In contrast, mixed metal oxides electrodes based on IrO2 or RuO2 have the lowest OER over-potential and are referred to as active anodes in the field of electrochemical wastewater treatment.
Based on the mechanistic point of view, on the other hand, electrochemical pollutants oxidation is referred to either as direct oxidation or indirect oxidation. Despite some discrepancy among researchers, direct oxidation generally corresponds to heterogeneous oxidation of target pollutants on the anode surface, while indirect oxidation accounts for homogeneous oxidation of pollutants often mediated by reactive oxygen species (ROS) and the RCS. In spite of a possibility of direct electron transfer from the target pollutants to the anode, the heterogeneous direct oxidation has been almost exclusively ascribed to the surface bound ROS, particularly hydroxyl radical (·OH). When the anode surface under a potential bias is able to liberate free ROS, as reaction intermediates or byproducts of OER, the indirect oxidation can take place via mediation of homogeneous ·OH, H2O2, and O3. However, it is difficult to distinguish the direct oxidation by surface-bound ROS from the indirect oxidation by free ROS, due to the short life and low yield of free ROS. Therefore, the RCS generated in the presence of a chloride ion (usually in 10 mM to 100 mM range) in the electrolyte has been appreciated as the primary mediator of indirect oxidation.
1.2.3. Molecular H2 Production from (PV-Powered) Electrolysis of Wastewater. A wastewater electrolysis cell may prove to be a promising approach for decentralized H2
production with simultaneous on-site wastewater treatment. Hoffmann and co-workers8,9,16-
18 have investigated the electrolytic H2 production from model organics containing solutions or real wastewater (domestic or industrial wastewater) in circum-neutral pH. In these reports, inexpensive stainless steel was employed as a cathode. The cathodic current efficiency and energy efficiency of H2 production have been reported to vary widely depending on the electrolyte composition (NaCl or Na2SO4 background, electrical conductivity, concentration of electron donating substrates other than water), cell configuration (distance between anode and cathode, geometric area), and operating condition (applied cell voltage). The reported values ranged from 40 to 80% for current efficiency and from 15 to 60% for energy efficiency. The major scavenging reactions for H2 production include reduction of RCS (to chloride ion) in NaCl background and reduction of oxygen (to superoxide radical and its dissociation products). The current efficiency for H2 production was usually higher in the NaSO4 background than in the NaCl background. In the NaCl background solution, a presence of electron donating substrates enhances the current and energy efficiency of H2 production. For example, batch injections of small amounts of organics including urea, phenol, and other oxidizable organics sharply enhanced the production of H2. The RCS competing with water and proton to accept electrons can be readily quenched by the organics to enhance the H2 production. The energy efficiency of H2 production decreased as the electrical conductivity decreased or applied cell voltage (or current) increased, primarily owing to the increase in ohmic energy loss. Park et al.9,17 would be the first to attempt electrolytic H2 production from dilute
7 aqueous solutions, which was solely powered by photovoltaic panels. In these reports, the sequential energy losses in the PV panel and the electrolysis cell resulted in net energy conversion efficiency about 1% (2.5% energy efficiency for solar light to direct current and 30~60% energy efficiency for the direct current to H2).
1.2.4. Mixed Metal Oxides Anodes. Electrochemical water oxidation on metal oxides (MOx) anodes has long been believed to initiate from a formation of surface bound hydroxyl radical (MOx(·OH)).19 The oxygen evolution activity is largely coming from the transition of the surface bound hydroxyl radicals to the chemisorbed active oxygen (MOx+1).19 The MOx(·OH) is a strong oxidant (standard redox potential of free ·OH is 2.8 V versus Normal Hydrogen Electrode) and, as a rule of thumb, prefers oxidation of pollutants or chloride ion to the OER. Boron doped diamond, SnO2, and PbO2 are well known anode materials which can provide both the direct pollutants oxidation and indirect oxidation with a presence of chloride ions. Owing to the high OER overpotential for these non-active anodes, the resulting current efficiency of pollutants oxidation sometimes approached unity, which could be mitigated by mass transport limitation. However, a concomitant large kinetic barrier for the initial water discharge (MOx(·OH) formation) requires relative large energy consumption and limits their application for H2 production and energy storage purposes. On the contrary, the higher oxides favor liberation of the lattice active oxygen to molecular O2 and a direct oxidation of pollutants is relatively sluggish. Therefore, indirect oxidation mediated by RCS plays more important roles for the anode materials undergoing facile redox oxide transition. RuO2 or IrO2 based metal oxides anodes have been widely employed as active anodes with relatively low OER overpotentials. Compared to the non-active anodes, the current efficiencies for the
pollutants oxidation are mostly lower on the active anodes, but more pronounced energy efficiency can be achieved owing to the low kinetic barrier to the formations of MOx+1. However, the high material cost for these precious metals is a major barrier for commercialization. A pictorial illustration of the direct and indirect oxidation of pollutants on metal oxide anodes is given in Figure 1.2.
Current discussion can be more elaborated on the volcano plot suggested by Trasatti20 which describes a relation between the OER overpotential and the enthalpy change in redox transition from lower to higher oxides (Figure 1.3). It has been reported that the enthalpy change in the oxides transition is well correlated with the bond strength between the oxide ion and the central metal ion.21 The electrodes for direct oxidation would be located in the
Figure 1.2. A schematic diagram of direct oxidation of organics (R) and indirect oxidation mediated by reactive chlorine species (RCS) on metal oxide (MOx) electrodes.19 MOx(·OH) and MOx+1 stand for surface-bound hydroxyl radical and higher oxide, respectively.
9
Figure 1.3. Volcano plot of the overpotential of oxygen evolution reaction (OER) for various types of metal oxide electrode as a function of enthalpy change for lower to higher oxide.
Reproduced from Trasatti.20
left-hand side of the apex (e.g., PbO2) and the formation of the higher oxides requires large energy input. Therefore, the initial water discharge is rate determining and weakly coordinated hydroxyl radicals are subject to reactions with aqueous solutes (R or Cl-) with relatively high current efficiencies.22 The summit of the volcano is occupied by active anode materials (RuO2 and IrO2) whose nearly optimal M-O bond strengths allow for facile OER. On the other hand, the metal oxides in the right-hand side of the apex (e.g., Co3O4
and Fe3O4) undergo the oxide transition too easily and the liberation of active oxygen is the rate determining step.
1.2.5. Hetero-junction Anodes with BiOx/TiO2 Functionalities. The core components of the wastewater electrolysis cells investigated in this study include hetero-junction anodes sequentially coated with a series of mixed metal oxides. The electrodes were prepared by sequential thermal decomposition of mixed oxides of Ti and Bi on Ti base plates pretreated
with IrO2, Ta2O5, SnO2, and Bi2O3, as shown in Table 1.1.23 Based on an electron probe microanalysis, the outer surface of the electrode is dominantly composed of bismuth, titanium, and oxygen, to be designated as BiOx/TiO2 electrode.24 The hetero-junction electrode fabrication is expected to bring about a shift in heterogeneous kinetics. In particular, the surface BiOx/TiO2 functionality can provide active sites for hydroxyl radical formation while the underlying precoat layer based on IrO2 would reduce the kinetic barrier for water discharge. Also, the hetero-junction design should minimize losses of precious IrO2, while the seal-coat layer based on SnO2 is believed to enhance the conductivity of the electrode.23
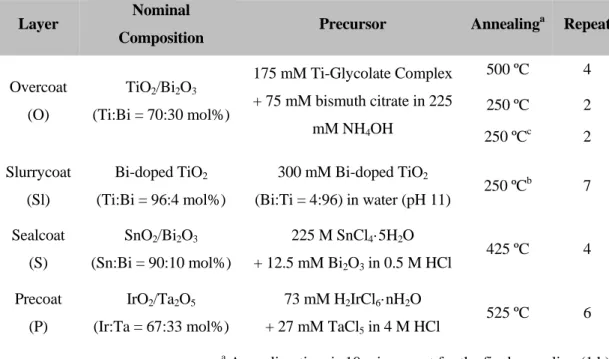
Table 1.1. Fabrication procedure of BiOx/TiO2 hetero-junction electrodes used in this study (Chapter 2 – 4).23
Layer Nominal
Composition Precursor Annealinga Repeat
Overcoat (O)
TiO2/Bi2O3 (Ti:Bi = 70:30 mol%)
175 mM Ti-Glycolate Complex + 75 mM bismuth citrate in 225
mM NH4OH
500 ºC 4
250 ºC 2
250 ºCc 2
Slurrycoat (Sl)
Bi-doped TiO2 (Ti:Bi = 96:4 mol%)
300 mM Bi-doped TiO2
(Bi:Ti = 4:96) in water (pH 11) 250 ºCb 7 Sealcoat
(S)
SnO2/Bi2O3 (Sn:Bi = 90:10 mol%)
225 M SnCl4·5H2O
+ 12.5 mM Bi2O3 in 0.5 M HCl 425 ºC 4 Precoat
(P)
IrO2/Ta2O5 (Ir:Ta = 67:33 mol%)
73 mM H2IrCl6·nH2O
+ 27 mM TaCl5 in 4 M HCl 525 ºC 6
a Annealing time is 10 min except for the final annealing (1 h).
b Brush of Sl precursor and 4 V% O precursor before annealing.
c Brush 50 V& O precursor before annealing.
11 A series of investigations on the BiOx/TiO2 anodes noted reliable indirect oxidation of various types of environmental pollutants (model phenol compounds,8,9,17,18 urea,25 arsenite,26 industrial wastewater,18 and domestic wastewater16) and stability during a long- term electrolysis in circum-neutral pH. Nevertheless, the preparation procedure is actually the outcome of technical trial-and-error, and somewhat complicated, as shown in Figure 1.4.
Therefore, it needs further modification to be a simplified preparation method. In addition, the core nature of each layer relevant to the activity and stability is not fully understood.
Figure 1.4. Detailed fabrication procedure for slurry coat and overcoat described in Table 1.1.23
1.3. OBJECTIVES AND POTENTIAL CONTRIBUTIONS OF THE THESIS
The objectives of this study are to develop a wastewater electrolysis cell which includes hetero-junction anodes as core components for potential application to toilet wastewater treatment, and to provide an underlying scientific background particularly for the redox transformation of environmental pollutants and molecular hydrogen production.
This study can be distinguished from the previous works by using bismuth doped titanium dioxide (BiOx/TiO2) anode, which shows reliable electrocatalytic activity and stability in long-term operation. In addition, simultaneous molecular hydrogen production along with waste treatment is another unique feature of this study, and the multi-functional approach of the electrochemical system can be denoted as wastewater electrolysis cell. In the electrochemical wastewater treatment system, the complex reaction networks involve heterogeneous and homogeneous ROS and RCS depending on the operating condition.
Therefore, there has been a controversy on the primary oxidants which account for the mineralization of environmental pollutants. While the previous reports generally infer the existence of various reactive oxidants based on the cell voltage, this study employs potentiostatic electrolysis with precise monitoring of anodic potential and ohmic loss. The experimental approach of this study allows more plausible explanations for the role of various oxidants in comparison with their thermodynamic redox potentials. Comprehensive environmental analyses coupled together with kinetic models are expected to provide in- depth knowledge related with various redox reactions mediated by the chloride ion present in human waste.
13 1.4. THESIS OVERVIEW
This thesis consists of the following six chapters. The overall composition of the thesis is illustrated in Figure 1.5.
Chapter 1 – Introduction
Chapter 2 – Urea degradation by electrochemically generated reactive chlorine species:
Products and reaction pathways
Chapter 3 – Effects of anodic potential and chloride ion on overall reactivity in electrochemical reactors designed for solar-powered wastewater treatment
Chapter 4 – Electrochemical treatment of human waste coupled with molecular hydrogen production
Chapter 5 – BixTi1-xOz functionalized hetero-junction anode with an enhanced reactive chlorine generation efficiency in dilute aqueous solutions
Chapter 6 – Outlook for the future
Figure 1.5. Overall composition of this thesis
1.5. REFERENCES
(1) UN-water global annual assessment of sanitation and drinking-water (GLAAS) 2012 report: the challenge of extending and sustaining services; World Health Organization:
Switzerland, 2012.; http://www.un.org/waterforlifedecade/pdf/glaas_report_2012_eng.
pdf.
(2) Grant, S. B.; Saphores, J. D.; Feldman, D. L.; Hamilton, A. J.; Fletcher, T. D.; Cook, P.
L. M.; Stewardson, M.; Sanders, B. F.; Levin, L. A.; Ambrose, R. F.; Deletic, A.;
Brown, R.; Jiang, S. C.; Rosso, D.; Cooper, W. J.; Marusic, I. Taking the "Waste" out of "Wastewater" for human water security and ecosystem sustainability. Science 2012, 337 (6095), 681-686.
(3) Onsite wastewater treatment systems manual; EPA/625/R-00/008; United States Environmental Protection Agency: Washington, D.C., 2002.;
nepis.epa.gov/Adobe/PDF/P100FS7K.pdf.
(4) Guidelines for water reuse; EPA/600/R-12/618; United States Environmental Protection Agency: Washington, D.C., 2012.; nepis.epa.gov/Adobe/PDF/P100FS7K.pdf.
(5) Clean Watersheds Needs Survey: Report to Congress; EPA-832-R-10-002; United States Environmental Protection Agency: Washington, DC., 2008.;
water.epa.gov/scitech/datait/databases/cwns/upload/cwns2008rtc.pdf.
(6) The Fuel Cell Technologies Program Multi-Year Research, Development, and Demonstration Plan; United States Department of Energy: Washington, D.C., 2012.;
http://energy.gov/eere/fuelcells/fuel-cell-technologies-office-multi-year-research- development-and-demonstration-plan.
(7) 2013 Annual Progress Report: DOE Hydrogen and Fuel Cells Program; DOE/CO- 102013-4260; United States Department of Energy: Washington, D.C., 2013.;
http://www.hydrogen.energy.gov/annual_progress13.html.
(8) Park, H.; Vecitis, C. D.; Hoffmann, M. R. Electrochemical water splitting coupled with organic compound oxidation: The role of active chlorine species. J Phys Chem C 2009, 113 (18), 7935-7945.
15 (9) Park, H.; Vecitis, C. D.; Hoffmann, M. R. Solar-powered electrochemical oxidation of organic compounds coupled with the cathodic production of molecular hydrogen. J Phys Chem A 2008, 112 (33), 7616-7626.
(10) Cho, K.; Qu, Y.; Kwon, D.; Zhang, H.; Cid, C. A.; Aryanfar, A.; Hoffmann, M. R.
Effects of anodic potential and chloride ion on overall reactivity in electrochemical reactors designed for solar-powered wastewater treatment. Environ Sci Technol 2014, 48 (4), 2377-2384.
(11) Cho, K.; Kwon, D.; Hoffmann, M. R. Electrochemical treatment of human waste coupled with molecular hydrogen production. Rsc Adv 2014, 4 (9), 4596-4608.
(12) Energy Demands on Water Resources: Report to Congress on the Interdependency of Energy and Water; United States Department of Energy: Washington D.C., 2006.
(13) Panizza, M.; Cerisola, G. Direct and mediated anodic oxidation of organic pollutants.
Chem Rev 2009, 109 (12), 6541-6569.
(14) Martinez-Huitle, C. A.; Ferro, S. Electrochemical oxidation of organic pollutants for the wastewater treatment: direct and indirect processes. Chem Soc Rev 2006, 35 (12), 1324-1340.
(15) Chaplin, B. P. Critical review of electrochemical advanced oxidation processes for water treatment applications. Environ Sci-Proc Imp 2014, 16 (6), 1182-1203.
(16) Park, H.; Choo, K.; Park, H.; Choi, J.; Hoffmann, M. R. Electrochemical oxidation and microfiltration of municipal wastewater with simultaneous hydrogen production:
Influence of organic and particulate matter. Chemical Engineering Journal 2013, 215- 216 (15), 802-810.
(17) Park, H.; Vecitis, C. D.; Choi, W.; Weres, O.; Hoffmann, M. R. Solar-powered production of molecular hydrogen from water. J Phys Chem C 2008, 112 (4), 885-889.
(18) Choi, J.; Qu, Y.; Hoffmann, M. R. SnO2, IrO2, Ta2O5, Bi2O3, and TiO2 nanoparticle anodes: electrochemical oxidation coupled with the cathodic reduction of water to yield molecular H2. J Nanopart Res 2012, 14 (8).
(19) Comninellis, C. Electrocatalysis in the electrochemical conversion/combustion of organic pollutants for waste-water treatment. Electrochim Acta 1994, 39 (11-12), 1857-1862.
(20) Trasatti, S. Electrocatalysis in the anodic evolution of oxygen and chlorine.
Electrochim Acta 1984, 29 (11), 1503-1512.
(21) Rossmeisl, J.; Qu, Z. W.; Zhu, H.; Kroes, G. J.; Norskov, J. K. Electrolysis of water on oxide surfaces. J Electroanal Chem 2007, 607 (1-2), 83-89.
(22) Walter, M. G.; Warren, E. L.; McKone, J. R.; Boettcher, S. W.; Mi, Q. X.; Santori, E.
A.; Lewis, N. S. Solar water splitting cells. Chem Rev 2010, 110 (11), 6446-6473.
(23) Weres, O. Electrode with surface comprising oxides of titanium and bismuth and water purification process using this electrode. U.S. Patent 7,494,583 B2, Feb. 24, 2009.
(24) Park, H.; Bak, A.; Ahn, Y. Y.; Choi, J.; Hoffmannn, M. R. Photoelectrochemical performance of multi-layered BiOx-TiO2/Ti electrodes for degradation of phenol and production of molecular hydrogen in water. J Hazard Mater 2012, 211, 47-54.
(25) Kim, J.; Choi, W. J. K.; Choi, J.; Hoffmann, M. R.; Park, H. Electrolysis of urea and urine for solar hydrogen. Catal Today 2013, 199, 2-7.
(26) Kim, J.; Kwon, D.; Kim, K.; Hoffmann, M. R. Electrochemical production of hydrogen coupled with the oxidation of arsenite. Environ Sci Technol 2014, 48 (3), 2059-2066.
ELECTTROCHEMI PR
URE ICALLY G RODUCTS
C h a p t
EA DEGRA GENERATE AND REA
t e r 2
ADATION B ED REACTI ACTION PA
BY
IVE CHLO ATHWAYS
ORINE SPEC S
17
CIES:
ABSTRACT
This study investigated the transformation of urea by electrochemically-generated reactive chlorine species (RCS). Solutions of urea with chloride ions were electrolyzed using a bismuth doped TiO2 (BiOx/TiO2) anode coupled with a stainless steel cathode at applied anodic potentials (Ea) of either +2.2 V or +3.0 V versus the normal hydrogen electrode. In NaCl solutions, the current efficiency of RCS generation was near 30% at both potentials. In divided cell experiments, the pseudo-first-order rate of total nitrogen decay was an order of magnitude higher at Ea of +3.0 V than at +2.2 V due to the generation of dichlorine radical (Cl2
-·) ions. Quadrupole mass spectrometer analysis of the reactor head-space revealed that N2 and CO2 are the primary gaseous products of the oxidation of urea, whose urea-N was completely transformed into N2 (91%) and NO3-
(9%). The higher reaction selectivity with respect to N2 production can be ascribed to a low operational ratio of RCS to N. The mass-balance analysis recovered urea-C as CO2 at 77%, while CO generation most likely accounts for the residual carbon. In light of these results, we propose a reaction mechanism involving chloramines and chloramides as reaction intermediates, where the initial chlorination is the rate-determining step in the overall sequence of reactions.
19 2.1. INTRODUCTION
Urea is the most abundant nitrogen (N) carrier in human excreta,1-3 and therefore is the dominant source of N in domestic wastewater. In spite of the relatively low toxicity of urea, there is a growing concern that excessive N loading from toilet wastewater is leading to the eutrophication of surface waters. Major cities located in sensitive coastal areas are experiencing algal blooms in estuary waters that appear to be correlated to nutrient loading from household septic systems.4 During transport through sanitary sewer systems, urea-N is readily converted to NH4+
-N via enzymatic hydrolysis by urease. In septic systems, the pH can rise to 9 due to the protonation of ammonia released during the enzymatic hydrolysis.5 Due to the heavy loading of N in human waste, various groups are exploring source separation in order to harvest the urine at a reduced volume before discharge into a large volume disposal system.2 In this respect, one can envision an on- site method for removing the N loading due to urea and thus avoiding problems resulting from the extended storage of toilet wastewater. Current demands on total maximum daily load reductions may require decentralized wastewater treatment methods, due to limited options for expanding the capacity of centralized wastewater treatment plants. The Bosch-Meiser process used to produce urea also discharges wastewater loaded with residual urea (< 30% of products1) and thus requires a direct urea treatment technology other than the methods of adsorption or biological treatment that are currently employed.6 When compared to biological nitrogen removal processes (nitrification or Anammox) for urine treatment whose hydraulic retention times range up to a few days,2 electrochemical treatment can be an efficient way to accomplish urea degradation at
relatively fast reaction rates (retention time within a few hours6,7). Operational flexibility and energy sustainability can also be achieved when using a renewable energy source (e.g., photovoltaic-panel8). Botte and co-workers9-11 investigated nickel (II) hydroxide based electro-catalysts to facilitate a direct electron transfer from urea-N to anodes operating in a strong alkaline solution (e.g., 1 to 5 M of KOH). Other electrochemical systems have explored mixed metal oxide anodes based on RuO2, IrO2, and PtO2, to treat urea (< 0.2 M) with near equi-molar amount of chloride ion.6,7,12,13 In these systems, free reactive chlorine (HOCl or OCl-) appeared to be the primary oxidant leading to urea degradation, while chloramines were often observed as reaction intermediates.12
There appears to be a reasonable consensus that N2 and CO2 are the eventual products during chlorination of urea,7,13 although there are reports of N2O (nitrous oxide) as a final N-containing product.14 However, little data can be found on the exact speciation of the potential array of gaseous products. On the other hand, we recently demonstrated that electrochemically generated chlorine radicals can rapidly reduce the chemical oxygen demand in domestic wastewater.15 In this case, the reactive chlorine species (RCS) is used as a collective term for the sum of free chlorines and chlorine radicals such as the chlorine atom (Cl·) and chlorine radical anion (Cl2-
·).
With these considerations in mind, we now report on the details of N transformation during urea degradations via RCS generated on hetero-junction anodes functionalized with bismuth-doped titanium dioxide (BiOx/TiO2). Parallel analyses of products generated in the aqueous phase and gas phase allowed for mass and charge balance determinations of the nitrogenous and carbonaceous species. The effects of applied
21 anodic potential (Ea) on the rates of total nitrogen (TN) decay and products formation were also explored in order to assess the detailed roles of chlorine radicals during urea oxidation. The degradation of urea by electrochemically generated RCS seems to resemble the ‘chemical (most often using NaOCl)’ chlorination mechanisms14 (the process used to investigate the formation of chlorinated byproducts in swimming pools).
However, we note that the differences in operational molar ratios of RCS to N as well as the chlorine radical generation rates change the kinetic parameters and the selectivity towards the final products in the electrolytic urea degradation.
2.2. EXPERIMENTAL SECTION
2.2.1. Preparation of BiOx/TiO2 Anode and Electrolysis Cell. In a typical preparation,15,16 Ti metal sheets (0.5 mm thick, pretreated by sand-blasting, degreasing, and etching) were doubly coated sequentially with mixed metal oxide layers by repetitive thermal decomposition of Ir/Ta solution (73 mM H2IrCl6 and 27 mM TaCl5 in 4 M HCl;
anneal at 525 °C), Sn/Bi solution (225 mM SnCl4 and 12.5 mM Bi2O3 in 0.5 M HCl; at 425 °C), Ti/Bi slurry (ca. 300 mM Bi-doped TiO2; at 250 °C), and Ti/Bi solution (225 mM Ti-Glycolate complex and 25 mM bismuth citrate in 75 mM NH4OH; at 425°C).
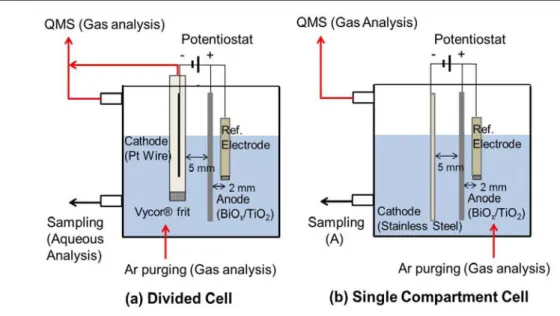
Single compartment electrolysis cells (working volume of 60 mL) were prepared using a BiOx/TiO2 anode and stainless steel cathode pair (3 × 2 cm2, 5 mm gap) with a Ag/AgCl/Sat. KCl reference electrode (BaSi Inc., USA) whose Vycor® glass tip was 2 mm apart from the anode center. For divided cell configuration, a Pt wire encapsulated in a tube with Vycor® glass frit separator was used as a cathode. A schematic diagram of
Figure 2.1. Schematic diagram of electrolysis cells (working volume: 60 mL) used in this study.
each electrolysis cell is shown in Figure 2.1. The frit separator reduces interferences of cathodic reactions to estimate more reliable kinetic parameters, while an increased electrical resistance of the divided cell decreases the response current density (J) at a given Ea. All electrochemical experiments were performed under potentiostatic conditions driven by a SP-50 potentiostat (Bio-Logics, USA).
2.2.2. Potentiostatic Electrolysis of NaCl Solutions with or without Urea. The rate and current efficiency of RCS generation were estimated in the single compartment cell with 50 mM NaCl solutions. The RCS evolution rates were measured in terms of total chlorine (ClDPD) concentrations at a fixed time interval (2 min) three times. The relatively short reaction duration (6 min) was intended to minimize the oxidation or reduction of RCS, which would cause a non-linear increase of [RCS] with time.16,17 These experiments were repeated with Ea varying from 1.5 to 3.0 V versus the normal hydrogen electrode (NHE).
23 The current efficiency for the RCS generation (ηRCS) was estimated by the following equation:
dt I
Cl d
VF [ DPD] 2
RCS
(2.1)
where, V is electrolyte volume (0.06 L), F is Faraday constant (96485.3 C mol-1), [ClDPD] is the concentration of RCS (M), I is current (A), and t is electrolysis time (sec).
The electrochemical urea degradation experiments were performed in a divided cell (Ea: 2.2 V or 3.0 V NHE, 3 h) or in a single compartment cell (Ea: 3.0 V NHE, 6 h). The reaction solution contained 41.6 mM (2.5 g L-1) of urea in the presence of 50 mM NaCl (electrical conductivity: 5.6 ± 0.1 mS cm-1). The initial [urea] was in accordance with a recipe for synthetic urine18 assuming 10-fold dilution by flushing. The molar ratio of urea-N to Cl- (close to 1.7) was compatible with operational ranges in analogous literature,6,12 while it was less than half of the observed ratios for fresh urine.2 We rationalize the low urea-N/Cl- ratio by the scenario either of moderate storage before treatment (decreasing [urea]) or reuse of treated effluent as flushing water (increasing [Cl- ]). Urea solutions with 50 mM Na2HPO4 (7.4 ± 0.1 mS cm-1) were also tested in the divided cell as control experiments, to evaluate urea oxidation by a direct electron transfer from urea to the semiconductor anode. Small aliquots of electrolyte were sampled periodically to monitor the speciation of aqueous-phase N. Gaseous products in the reactor headspace were analyzed by HPR-20 gas analysis system (Hiden Analytical, USA) with a heated quartz inert capillary inlet under continuous purging of Ar gas (ca. 7 mL min-1).
2.2.3. Analytical Methods. The pH, conductivity and electrical resistance of solutions before and after the electrolysis were determined using a pH meter (Mettler Toledo, USA), a conductivity meter (VWR International, USA), and the current interruption function of the potentiostat with a current bias of 200 mA, respectively. The [urea] was determined using a hydrolysis method employing Jack Bean Urease as described previously.16 However, the measured values of [urea] were reliable only for the control experiments due to interferences of RCS with urease activity.20 The principal ions of interest (Cl–, ClO3–
, NO2–
, NO3–
, NH4+
) were quantified by DX-500 ion chromatography system (Dionex, USA), equipped with the anion-exchange column Ionpac AS 19 and the cation-exchange column Ionpac CS 16. [TN] were determined using low range (0.5 to 25 mg N L–1) TN reagent kits (Hach, USA) according to absorbance at 420 nm in the UV- VIS spectrophotometer (Agilent, USA) after digestion. The [ClDPD] was measured with DPD (N,N-diethyl-p-phenylenediamine)/KI reagents (Hach, USA) based on the absorbance at 530 nm. It has been reported that, in urea chlorination, the ClDPD accounts for chlorinated urea species as well as inorganic chloramines.21 Analogous measurements with DPD reagents (Hach, USA) were performed to quantify the fraction of free chlorine in the ClDPD. The gaseous products underwent 70 eV electron impact ionization, and fragments (m/z 1 to 300) were analyzed using a quadrupole mass spectrometer (QMS) in a vacuum (< 5.0 × 10⁻⁶ Torr) generated by a turbo pump. The volume percent in the headspace gas was assumed to be directly proportional to the ion current measured by the QMS. Quantification of the gases of interest was based on the relative ion current intensities of characteristic m/z (14 for N2, 44 for CO2) and the volumetric flow rate of total gaseous products measured with a mass flow-meter (Bronkhorst, USA). The limit of