The second (37, p) gave applications of the first article to the spectroscopic determination of the water vapor above Mount Wilson. They then proceeded to investigate the transmission of energy from a laboratory source through 40 cm.
THE WATER VAPOR
The differences of the observed intensities of the spectrum energy after it passed over the different paths served to measure the energy absorbed in the water vapor. Unfortunately, there was a serious vibration of the image of the lamp formed on the slit due to the large magnification of the small tremors of the mirrors.
12 SMITHSONIAN MISCELLANEOUS COLLECTIONS VOL. 68
SOURCE OF RADIATION
14 SMITHSONIAN MISCELLANEOUS COLLECTIONS VOL. 68
THE SLIT
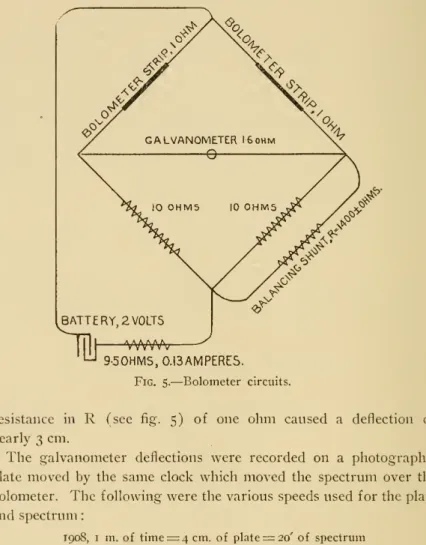
NO. 8 WATER-VAPOR TRANSPARENCY FOWLE I5 by deflections of the galvanometer before and after the insertion of
THE BOLOMETER AND GALVANOMETER
8 TRANSPARENCY OF WATER VAPOR I5rom the deflections of the galvanometer before and after the introduction of.
BATTERY,2V0LTS
ROCK-SALT PRISMS
SMITHSONIAN MISCELLANEOUS COLLECTIONS VOL. 68
The spectroscope collimator and diaphragm were then adjusted so that the beam was centered on them as well as on the prism. The spectrometer circle was then rotated to bring the A or D line central to the bolometer strip and the position was read.
OBSERVATIONS
The bolometer was set up to look centrally at the projection of the beam onto the image-forming mirror, the latter set up so that the image of the spectrum was perpendicular to the bolometer. A Bunsen flame colored with sodium was used instead of sunlight to illuminate the slit, and adjustments were made with D lines.
20 SMITHSONIAN MISCELLANEOUS COLLECTIONS VOL. 68
NO. 8 WATER-VAPOR TRANSPARENCY FOWLE 21 CORRECTION FOR SLIT AND BOLOMETER WIDTHS
The solid dots with dashed lines connecting the mean values belong to class\ and show the absorption produced by water vapor and carbon dioxide on the way through the spectroscope only. HoO, carbon dioxide, at about 7.4 grams^ in a column of path length (11.5 meters) and square meter in section. The curve drawn with open circles, squares and diamonds with the solid connecting line corresponds to class b.
Probably the increase in absorption indicated by the increase in the area of the absorption bands for the two observed curves is more accurate than the absolute values of absorption for these involve the assumption that the blackbody curve at 2,200° K. Also reproduced in the dashed curve extending from 5 to about /'.y jx The work of Rubens and Aschkinass (1. c.) taken with a steam column 30 cm.
NO. WATKR-VAPOR TRANSPARENCY FOWLE 23
NO. 8 WATER-VAPOR TRANSPARENCY FOWLE 25
The record consists of three sets of curves: the first lower, dotted, single-line record indicating the zero of the galvanometer needle when the shutter was inserted between the lamp and the gap at a temperature of about 300 °K; second, the upper, five-pronged curve. These slit widths were obtained either by using brass slits of fixed widths inserted in front of the conventional spectroscopic slit, or by closing the latter until its jaws just touched the measured cylindrical template. The next step was the reduction of all spectroscope branches. both upper curves to the same scale.
The cause of this change, as mentioned in the description of the fissure, remained unclear for some time until it was discovered by dr. Abbot came up that it was probably due to the spread of the beam by diffraction when the narrower slit was used around the lower branch of the curve. This disorder therefore made the determination of aperture values for reducing the different parts of the curve to the same scale difficult.

28 SMITHSONIAN MISCELLANEOUS COLLECTIONS VOL. 68
NO. 8 WATER-VAPOR TRANSPARENCY FOWLE 29
DIFFRACTION EFFECT
STRAY LIGHT
30 SMITHSONIAN MISCELLANEOUS COLLECTIONS VOL. 68
Finally, each beam on the other side is exhausted by sending scattered light to all parts of the spectrum. The increase in scattered energy, 2y, above 1.18 times that observed by the insertion of the quartz plate, varies from 2 to ii percent according to the angular deviation. The entire absence of appreciably strong light in that part of the research done with the 60° prism unfortunately led to a false sense of security in the first work with the 15° prism, and in much of the earlier work with it no field light experiments.
Therefore, all the significant deflection observed there could be considered stray light. The stray light foi shorter wavelengths was assumed to have the same relationship to this as the ordinates of the corresponding deviations of the stray light curve in figure 18 do to each other. But fortunately, the larger in absolute quantity it becomes, the less important it becomes, for it becomes a smaller fraction of the total observed deflection.
32 SMITHSONIAN MISCELLANEOUS COLLECTIONS VOL. 68 DESCRIPTION OF FIGURE 9
NO. 8 WATER-VAPOR TRANSPARENCY FOWLE 33
34 SMITHSONIAN MISCELLANEOUS COLLECTIONS VOL. 68 Taule 6
When different slit widths occur, this would serve to ensure that when different slit widths occur, it would serve to ensure the absence of errors due to diffraction in the tube observations. An excellent set of observations was obtained, and the average result of the day, if that.
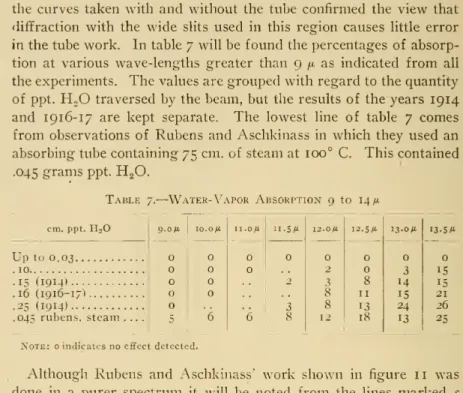
36 SMITHSONIAN MISCELLANEOUS COLLECTIONS VOL. 68 the curves taken with and without the tube confirmed the view that
NO. 8 WATER-VAPOR TRANSPARENCY FOWLE
38 SMITHSONIAN MISCELLANEOUS COLLECTIONS VOL, 68 by Rubens/ In view of these figures it seems possible that the diver-
ATMOSPHERIC TRANSMISSION OF SOLAR ENERGY BETWEEN
This has resulted in a major increase in sensitivity and accuracy of current spectrobolometric equipment. The scattered light, which was annoying in the spectrum of the Nernst lamp, becomes absolutely unaffordable here in a direct form. At 10/x with the large galvanometer deflection of 20 cm, virtually all of this deflection remained, and was therefore field light, upon insertion of the quartz plate.
In the case of the Nernst lamp spectrum at this wavelength, only 16 percent of the deflection turned out to be spurious. Dr. Abbot proposed the use of a solid iodine screen, which Coblentz's work showed was opaque to the visible radiation and increasingly transparent to the longer wave radiation. These were heated evenly, iodine flakes placed on one, the other plate quickly placed on top and the two plates pressed together.
TRANSPARENCY OF IODINE
Iodine screen: EnergyofXxXtransmission/ for A^+scattered (b) Iodine screen: EnergyofXxXtransmission/ for A^+scattered. energy of A<4/x, greatly reduced by the opacity of / for A<4/a. scattered energy of A>4fiXabsorption for it of /. c) Iodine and quartz: scattered energy of A<4/x, greatly reduced by the opacity of / for A<4/a, and reduced by reflection. The deflections with the iodine screen in, after subtracting the Hght field, were obviously very small for wavelengths smaller than 9fx, partly due to the opacity of the iodine screen. the iodine itself and partly because of the large water vapor band preceding 9/^.
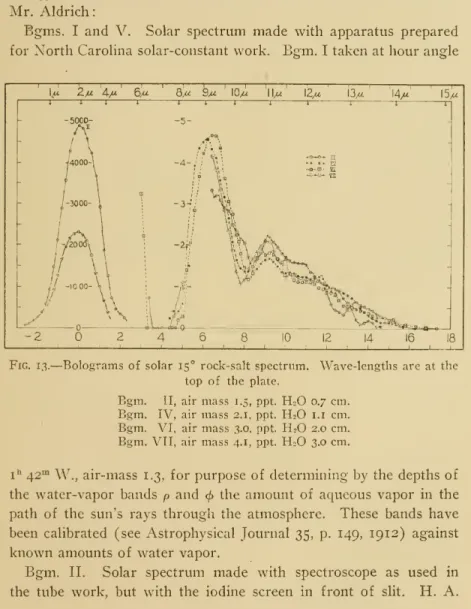
SOLAR OBSERVATIONS
NO. 8 WATER-VAPOR TRANSPARENCY FOWLE 43
44 SMITHSONIAN MISCELLANEOUS COLLECTIONS VOL. 68
46 SMITHSONIAN MISCELLANEOUS COLLECTIONS VOL. 68
AND BEYOND
RESULTS FOR STEAM. WAVE-LENGTHS GREATER THAN 20 fx
ABSORPTION BY LIQUID WATER
NO. 8 WATER-VAPOR TRANSPARENCY FOWLE 49 Table 12
50 SMITHSONIAN MISCELLANEOUS COLLECTIONS VOL. 68
COLLECTED RESULTS ON ATMOSPHERIC ABSORPTION FOR LONG-WAVE RADIATION
SUBSIDIARY INVESTIGATIONS
NOTE
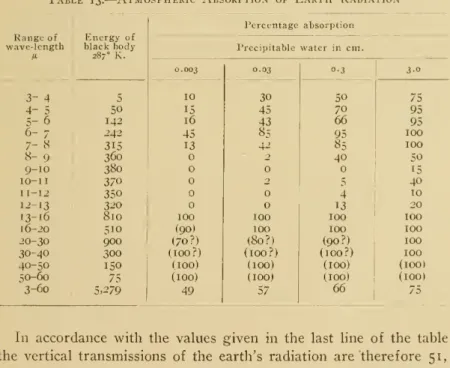
8 TRANSPARENCY OF WATER VAPOR — FOWLE 53in the range of 9 to 15 /ain, however, additional amounts of vapor in the range of 9 to 15 /ain, however, additional amounts of vapor there cause no further absorption. 2d, In dealing with the outward radiation of the earth, complete absorption has been assumed for atmospheric quantities of vapor for wave-lengths greater than 20 fi. The first point could only be resolved by observing radiation through a path that does not contain water vapor.
If all the absorption were produced in the region between 9 and 15/x, the dark absorption in this region should be 12 per cent.
54 SMITHSONIAN MISCELLANEOUS COLLECTIONS VOL. 68 be of finite width, an intensity is observed which corresponds to the
NO. 8 WATER-VAPOR TRANSPARENCY FOWLE 55 The intensity of the spectrum at x may be defined as the energy over
8 FOWLE WATER VAPOR TRANSPARENCY 55 The intensity of the atx spectrum can be defined as the energy over. whence using the undetermined coefficients C-^, Q,. Now letting2ca be the part of the energy curve covered by the slit .. plus the bolometer, c is equal to i+ w and hence 2ca to 2{^a+b), then. When w=i, or the slit and the bolometer have the same angular width in the spectrum, which is the Runge case, the second half of the above equation reduces to.
58 SMITHSONIAN MISCELLANEOUS COLLECTIONS VOL. 68
NO. 8 WATER-VAPOR TRANSPARENCY FOWLE 59 LIMITATIONS
STRAY LIGHT AND ITS DETERMINATION
Part of the energy scattered to the other region (namely the value corresponding to the difference in energy between the aanda' regions) must be reflected from the quartz surfaces. As a close approximation, the first curve can be considered as the energy curve of the scattering region shown in the second. The first term of this equation should represent, for any deviation, the energy due to the normal dispersion of the prism, the second term that is lost from the region by scattering, and the third that is gained by scattering.
The first term in the equation for Ef^(O) is obviously E(6), the energy inherent in the deviation. The height of the region is taken such that the height of the corresponding maximum, S(On), is equal to the actual height of the energy curve at deviation from which. 8 TRANSPARENCY OF WATER VAPOR FOWLE 63 We will see the integrals of the second and third term for both.
NO. 8 WATER-VAPOR TRANSPARENCY FOWLE 63 The integrals of the second and third terms will be seen to both
8 WATER-VAPOR TRANSPARENCY FOWLE 63The integrals of the second and third terms will be seen for both .. 68Consider next the numbers in the other vertical columns. The sum, excluding the "step" value and therefore equal to the amount scattered and lost from the corresponding wavelength, is expressed at the foot of the zero-deviation column. It constitutes about 3 percent of the observed intensity at the deviation to which the energy belongs.
The numbers added in this direction, including the "step" value, give the values of the term containing the second integral. value, they give the amount of light scattered in the region indicated by the "step" value of the line from the regions, the deviations of which are shown at the tops of the columns of the individual terms of the sum. Remembering that the first integral term does not affect the shape of the desired energy curve since it can be set in the form of a constant factor that multiplies the observed energy of each deflection, the values associated with the second integral are those in which interest will of the current center. These values give the energy dissipated by wavelengths between -4 and +2 cm deviations. i. e., the wavelengths transmitted by the quartz) to the corresponding deviations of the horizontal lines.
66 SMITHSONIAN MISCELLANEOUS COLLECTIONS VOL
SUMMARY
8 TRANSPARENCY OF WATER VAPOR —FOVVLE 67and the reflections in the rock salt prism and plate according to table i. Line 8 corrected intensities in the Nernst lamp spectrum approximating the conditions of line 7, but differs at longer wavelengths probably due to reduced energy absorption by the blackened surface of the bolometer strip lamp. The intensity of the scattered energy drops off very quickly on either side of the central image (see row 5).
The total energy of the field (line 6) at 10' is 5 percent of the spectrum of the lamp on which it is superimposed, at 60' it is nearly 50 percent, and at 100' more than 500 percent. As already stated, in the solar spectrum formed by the same apparatus, the scattered light at 10/x was more than 100 times more intense than that which belonged there. It should be noted that the dispersion increased relatively more due to larger deviations from the central image.
68 SMITHSONIAN MISCELLANEOUS COLLECTIONS VOL. 68 of the research involved the use of a different spectroscope using