With the development of submerged membranes, first introduced by Yamamoto et al., the number of MBRs for municipal wastewater treatment has increased, while the MBR market is currently experiencing accelerated growth. The global MBR market has doubled in the past 5 years, reaching a market value of US$217 million in 2005 with a projection of US$360 million in 2010 (Judd, 2006). The MBR process can be configured in a number of different ways depending on project-specific nutrient removal goals.
Case study: Comodepur WwTP
Introduction
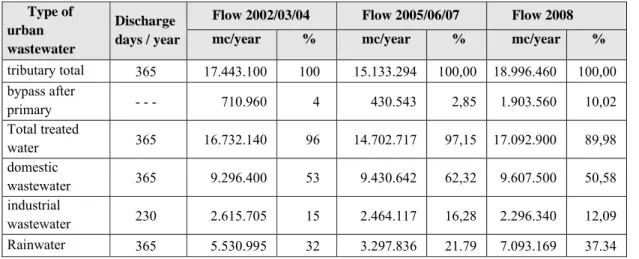
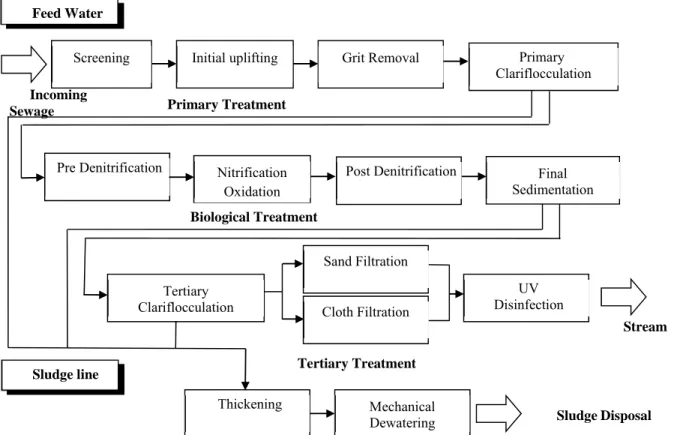
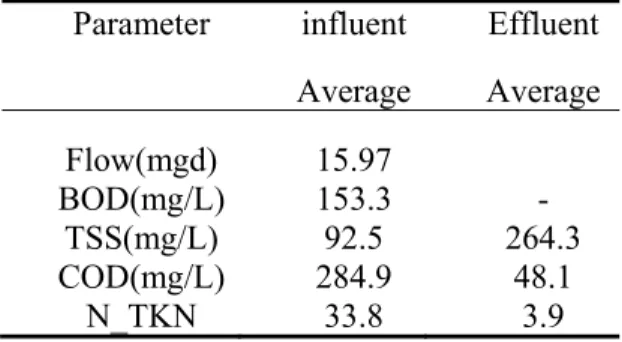
Plant Description
Excess sludge from biological and tertiary treatment is sent to sludge thickening units, while the drained water is recirculated back to the head of the biological process. Downstream of the pre-treatment, the wastewater is sent to the biological treatment phase (pre-denitrification).
MBR configurations
Historical background
Today the F/M MBR ratio is considered to be 1/3 to ½ ACS as explained here. In CAS, the level of organic loading must be as stable as possible to achieve favorable sludge settling. Since the descriptor does not exist, it was considered an obsolete concept for MBR.
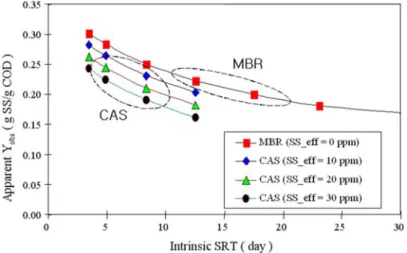
If the DO does not remain high enough during high organic loading, membrane fouling becomes even more important and must be considered. The biosolids production or sludge yield of MBR was generally considered to be much lower than that of the conventional activated sludge (CAS) process; it may have been based on some laboratory or pilot experiment conducted at the beginning of MBR technology in the early 1990s or earlier where an unrealistically high SRT such as 50-100 days was used. Furthermore, this half-truth was probably fueled by commercially motivated enthusiasm to demonstrate the benefits of MBR technology.
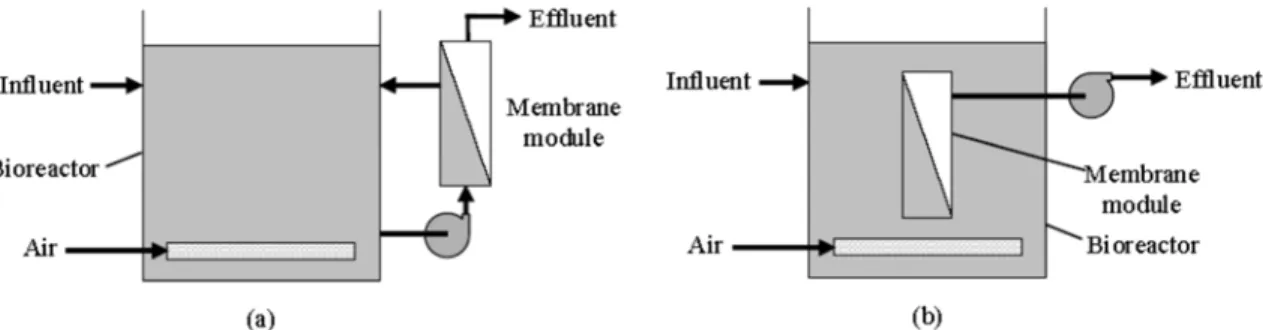
External/Sidestream
Internal/Submerged
The dominance of iMBR is indisputable, since in the period 2003-2005 more than 99% of the total area of installed membranes in Europe was represented by submerged membranes (Lesjean, 2008). Schemes of iMBR with submerged membranes and sMBR with cross-flow side-flow membranes.
Membrane Configurations
MBR Process
Although membrane bioreactor is increasingly used for wastewater treatment, it is being replaced with gravitational settling by the conventional activated sludge process (CASP) for solid-liquid separation (Delgado et al., 2011, Meng et al., 2009 and Zahid and El-Shafai, 2011). , and it has many advantages, such as smaller footprint and better product quality, their wider application requires better control of membrane fouling and permeate flux decline, as fouling removal depends on chemical or physical cleaning. Due to the complete physical containment of bacterial flocs, MBR has many advantages over conventional wastewater treatment processes, including reduced footprint, greatly improved wastewater quality, higher biomass concentration, and less sludge production (Le-Clech et al., 2006 and Zhu et al., 2011 ). Simply because of the high number of microorganisms in MBRs, the pollutant uptake rate can be increased.
Compared to the conventional activated sludge process (ASP), which typically achieves 95 percent, COD removal can be increased to 96 to 99 percent in MBRs (Kraume et al., 2005). As in the conventional ASP, the sludge yield decreases at higher SRT or biomass concentration. Some characteristics of MBR technology make EBPR in combination with postdenitrification an attractive alternative that achieves very low nutrient effluent concentrations (Drews et al., 2005).
HF/ iMBR Performance
More importantly, organic fouling gradually leads to biofouling if it provides organic nutrients for biofilm growth and maintenance. This leads to better degradation over a certain period of time or to smaller required reactor volumes. Because of the biomass concentration limitation imposed, such low loading rates would result in enormous tank sizes or long HRTs in a conventional ASP.
As in the conventional ASP, the most commonly used technology for N removal from municipal wastewater is nitrification combined with denitrification. In addition to phosphorus precipitation, enhanced biological phosphorus removal (EBPR) can be implemented, which requires an additional anaerobic process step. All in all, considering the above advantages and disadvantages, we can conclude that hollow fiber iMBR system can potentially be a good choice to achieve our purpose.
Membrane Design
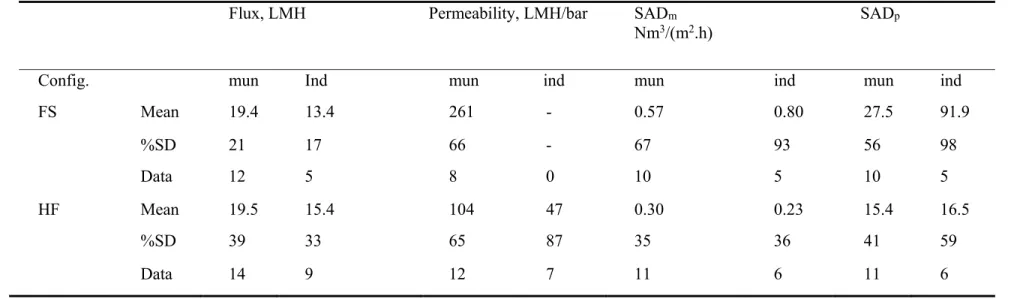
A comparison of the key flow parameters and SADp for the Kubota and Zenon average data of the entire municipal wastewater plant reveals similar average flows but with a lower aeration requirement. Therefore, air sparging is not only used for submerged membranes, but also for hollow fiber membranes installed in a pressure vessel (Bérubé, 2006). Submerged membrane bioreactors (MBRs) are often considered the best technology available for wastewater treatment, although submerged modules often suffer.
The MBR maintains higher MLSS concentrations than is possible for an AS plant, further improving treated water quality for the same feedwater concentration and HRT. This means that the water productivity is higher in the MBR system than in the AS system. Taking into account the conservative value for the density of the membrane packaging in the membrane tank (ϕtank), which is based on the data of the manufacturers ZENON and Kubota, enables the determination of the minimum volume of the membrane tank (Vm,min – Eq.(3.21)).
COST BENEFIT ANALYSIS
The methodology used for WWTP Comodepur is based on the following figure related to biokinetically activated sludge Model no. Average dissolved oxygen saturation concentration for clean water at temp, T and tank depth hx, CT,av , gO2/m3. The effect of MLSS on true oxygen transfer rate (AOTR) has been considered through the α-factor.
Capital Cost
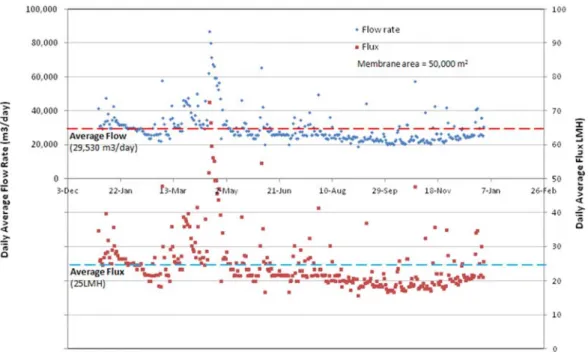
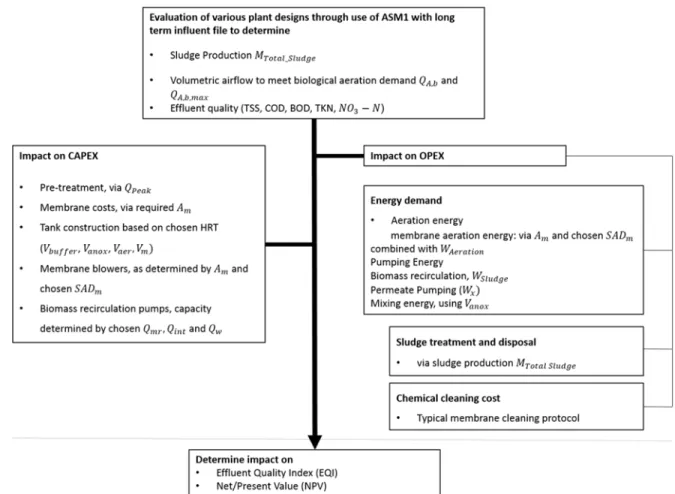
By calculating the oxygen consumption and sludge production, we can calculate the EQI and CAPEX and OPEX and NPV during the evaluation period. Since the manufacturers Kubota and Zenon are two well-known membrane suppliers that are more commonly used in Italy, we performed the cost analysis for both types of membranes (table below). Although based on the full scale plant data for wastewater treatment (table below), the mean net flux for iMBR is 19.5 LMH, but we conservatively calculated 12 and 10 LMH for Kubota and Zenon membrane, respectively.
Operational Costs
Operational costs were determined using the measurement community approach for control strategy evaluation (Copp et al., 2002), extended by Maere et al. As shown in the figure below, the primary energy needs are related to ventilation (66%), pumping is a distant second energy need. In order to provide the most cost-effective and energy-efficient system, it is important to consider opportunities related to design, operation and equipment.
Energy demand
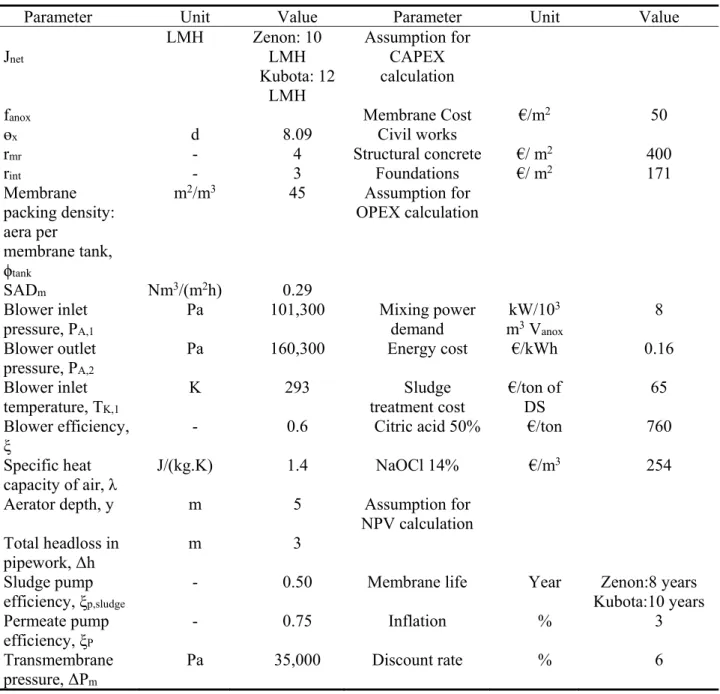
The influence of MLSS concentration (via the α-factor) and aerator type (fine and coarse bubble) on oxygen transfer was calculated using the dedicated aeration model of Maere et al. A value of 0.025 kWh.Nm-3 air was specified for the aeration energy demand taking into account commonly measured values for blower outlet pressure (106300 Pa; for a typical aerator depth of 5 m and allowing for losses subject to the piping) and a blower efficiency ξB of 0.60 which is in good agreement with literature values (Verrecht et al., 2008) and data from blower manufacturers. The average total aeration energy in kWh.d-1 was obtained by summing blower power consumption for both membrane and biology blowers and integrating over the 365 day simulation period (Maere et al., 2009).
In general, an increase in feed concentration results in a decrease in permeate flux (Vyas et al. 2000). Sludge pumping requirements, for internal recirculation (Qint, m3/d), membrane recirculation (QMR, m3/d) and waste (QW, m3/d), were determined from the expression of Maere et al. 2009), using a power requirement of 0.016 kWh.m-3 of pumped sludge, which was calculated by assuming a simple linear dependence of PSludge (Power required for sludge pumping) on sludge flow and assuming a total head loss Δh of 3m and a pump efficiency ξp of 50%. To calculate additional pumping energy for permeate pumping and backwashing, the expression given by Maere et al.
Sludge production
The effect of temperature on the permeate flux was investigated and found that at higher temperatures the permeate flux increased, indicating a lower degree of pollution. A typical constant mixing power requirement of 8 W per m3 anoxic tank volume was used (Metcalf and Eddy, 2003), with no supplementary mechanical mixing required for the aerobic, membrane and buffer tanks.
Conclusion
Based on the various results presented in this study, the following conclusions can be drawn. In Chapter 4, a new iMBR plant after biological section has been designed for the Comodepur wastewater treatment plant based on both Kubota and Zenon manufacturers' data, and the effect of both MBRs on the performance of full-scale MBR plants was analyzed. In addition, membrane selection mainly influences operational strategies (filtration protocol, membrane cleaning and flux) considering different optimal lifetimes based on previous studies mentioned in Chapter 4.
Then, both NPV, which gives an indication of overall costs based on CAPEX and OPEX and plant lifetime, and EQI, which represents the potential pollution load based on the given method, have been calculated. Membrane cost and lifetime are crucial in determining NPV: based on filterability and properties of material used in membranes, an optimal value of 8 and 10 years has been considered for Zenon and Kubota membranes respectively. Comparison of the two technologies shows that the Kubota membrane requires less membrane cleaning during operation compared to the Zenon membrane, although we designed based on net flux of 12 and 10 LMH for Kubota and Zenon membranes.
Recommendations for further research
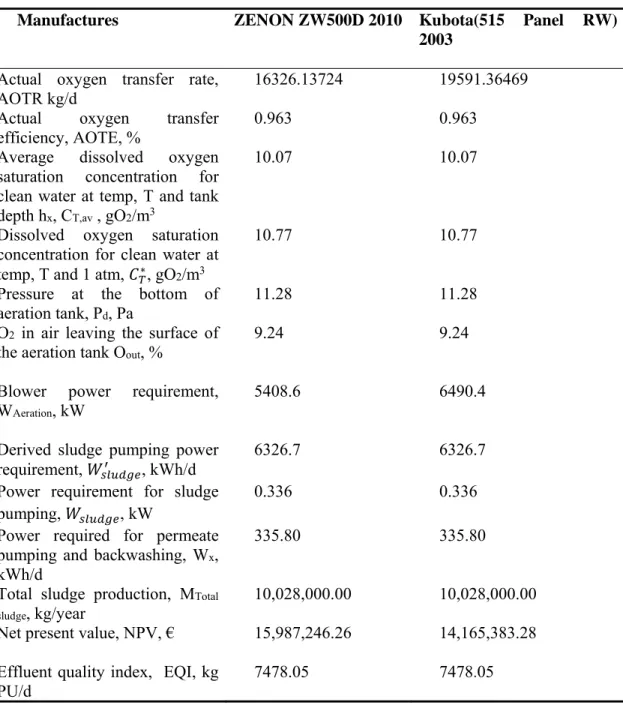
The Zenon membrane needs to be cleaned more often due to problems associated with membrane fouling and foaming. Foaming is believed to be the result of membrane cleaning because the chlorine came into direct contact with the MLSS. For MBR plants investigated in many works, the average energy consumption per unit ranged from 1.43 kWh/m3 to 4.24 kWh/m3.
In designed MBR, the aeration cost for Kubota MBR is 5408.6 kW, which is 20% less than the MBR produced by Zenon. All in all, considering the above factors, it is better to use Kubota membrane systems as it costs less and has less operational and fouling problems and also in terms of aeration cost, it consumes less aeration compared to Zenon fabrication system, although Zenon recently has introduced intermittent aeration, effectively halving the specific energy demand associated with aeration.
Guglielmi, Chiarani, Judd, Andreotolla (2007), Flux criticality and sustainability in a hollow fiber submerged membrane bioreactor for municipal wastewater treatment, Journal of Membrane Science. Jain, Alka and Jitendra Kumar, Application of Membrane-Bio-Reactor in Wastewater Treatment, an overview. 2005) Calibration of a sidestream membrane bioreactor using activated sludge Model nr. Krishna and Van Loosdrecht MCM (1999), Substrate flux into storage and growth in relation to activated sludge modelling.
Maere, Verrecht, Benedetti, Pham, Judd, Nopens (2009), Building a benchmark simulation model to compare control strategies for membrane bioreactors: BSM-MBR. Martinez, Gozálvez-Zafrilla, Mendoza-Roca, Flow simulation in a laboratory-scale submerged membrane bioreactor, Institute for Industrial, Radiological and Environmental Safety (ISIRYM), Universidad Politécnica de Valencia, Spain. Spérandio M and Espinosa MC (2008) Modeling of an aerobic submerged membrane bioreactor with ASM models on a large range of sludge retention time. 2011) The determination and origin of fiber clogging in membrane bioreactors, J.