The speech areas thus obtained can be either pure speech or speech with background music, considering the speech-specific nature of the functions. Pure speech/speech with background music classification using mean and relative spectral characteristics of the vocal system.
Introduction to Broadcast Audio Processing
Preprocessing for Phone Transcription of Broadcast Audio
In our work, therefore, only the sound segments of the anchor speakers are processed, which can be useful for multimedia applications such as the audio summary. However, the anchor speakers' data can also contain the other segments such as pure music and speech with background music.
Significance of Speech-Specific Knowledge
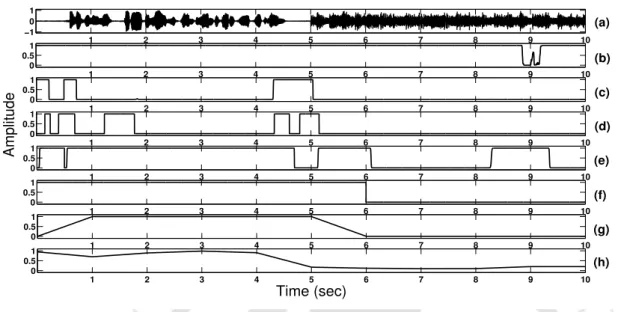
The nature of the output locates the foreground speech regions while discarding the background noise regions, as seen in Figure 1.6 (b). In other words, the foreground speech was segmented and enhanced based on the speech-specific features without caring about the nature of the noise present.
Motivation for Present Work
These functions will behave normally in speech, while they will deviate in speech with background music segments due to the presence of music in the latter. Speech-specific features can also be proposed to enhance speech with segments of background music that will highlight regions with a high signal-to-music ratio relative to other regions.
Organization of the Thesis
In most of these applications, telephone transcription of broadcast audio is an important step. Finally, the improvement will have to be done to obtain the clean speech from the speech with background music.
Tasks Involving Broadcast Audio Processing
- Spoken Document Retrieval
- Speech Summarization
- Iterative Maximum Likelihood Segmentation/Clustering Procedure
- Phone Decoding Segmentation Procedure
- Combined GMM and Phone Decoding Segmentation Procedure
- Segmentation Procedure using Distance based Methods
- Hypothesis Testing Segmentation Procedure
In most broadcast news processing applications (for example SDR, SSEG and SSU), automatic speech transcription is a necessary step. Given a segment of data, maximum likelihood class selection was used to classify the input speech.
Features for Classification of Speech and Music
Temporal Based Features
Spectral Based Features
Posterior Probability Based Features
Chroma Based Features
Features for Clean Speech/Speech with Background Music Classification
Spectral Peak Track
The characteristics of the type of sound can be revealed from the traces of peaks [31] present in the spectrogram of the sound signal. For example, traces of spectral peaks remain at the same frequency level and remain for quite some time in the case of musical instrument sounds.
Methods for Enhancement
Spectral Based Methods
- Spectral Subtraction
- MMSE Estimator
- Wavelet Denoising
This prompted the proposal of a nonlinear spectral subtraction (NSS) method based on the linear spectral subtraction method proposed in [36]. Performance degradation is seen when there is a large deviation in the noise characteristics.
Subspace Approaches for Enhancement
Temporal Based Methods
The Frobenius norm of the Toeplitz matrix, calculated from the 2 ms frame size of the LP residual, is used to exaggerate the moments of significant excitation. This method also uses the idea of changing the LP residual for the time case.
Speech Recognition for Broadcast Audio
Discussion and Direction for the Work
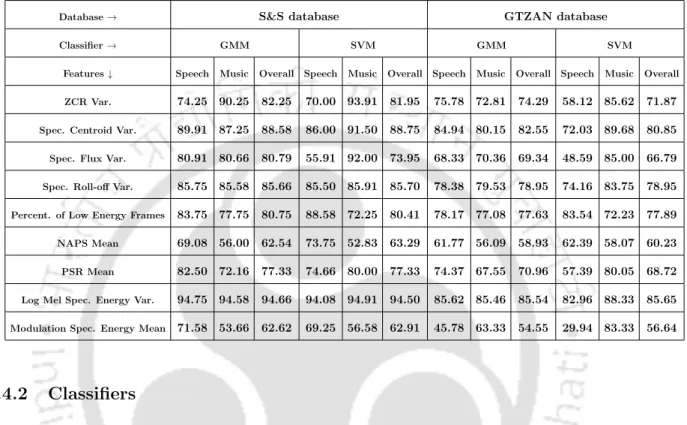
It is observed that the performance of the speech-specific features is better compared to the existing features. The main idea of the work is to use speech-specific features for the task of speech/music classification.
Speech-Specific Features for Speech/Music Classification
Speech-Specific Excitation Source Features
- Normalized Autocorrelation Peak Strength
- Peak-to-Sidelobe Ratio
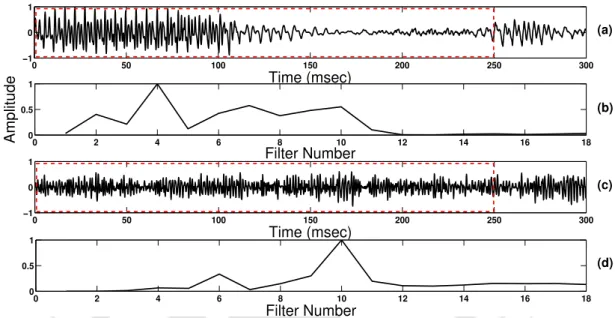
It may be noted that the nature of ZFFS for speech and music is different. The periodic nature of ZFFS is more apparent in speech compared to music and is unique to speech.

Speech-Specific Vocal Tract System Features
- Log Mel Spectrum Energy
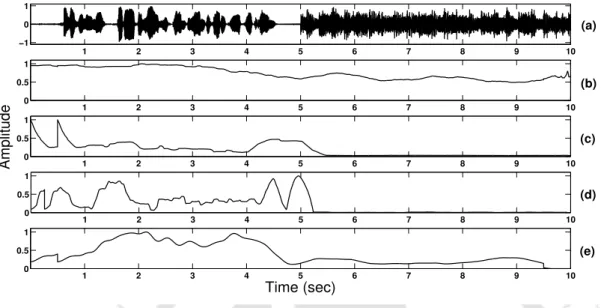
Thus, there is a large variation in the logmel spectrum energy, as shown in Figure 3.6(d). The logmel spectrum energy in the figure is normalized over the entire duration of the audio clip.
Speech-Specific Modulation Spectrum Features
- Modulation Spectrum Energy
The variation of log mel spectrum energy is higher for speech compared to music, and this variation is unique in the case of speech. The distribution of the 4 Hz modulation energy is shown in Figure 3.5 (b) and (d) for speech and music respectively, calculated for a frame of speech and music, shown as rectangles in the figure.
Overall Speech/Music Classification System
Speech/Music Classification by Non-linear Mapping and Combining
As can be seen in Figure 3.6(d), the variation of the function in the speech regions is very large compared to the music regions. This window size is chosen in most segment-based speech/music classification tasks [12,30].
Speech/Music Classification using Gaussian Mixture Models and Support Vector
Similarly, the classification based on the non-linear assigned value of this feature is performed by calculating the average of the non-linear assigned value (Θ=0.5) of the log mel spectrum energy shown in Figure 3.9(d ), compared to the average with a threshold of 0.08 as before, and the same kind of segment classification is performed. Overall accuracies of 68.46% and 74.34%, respectively, are obtained for the two cases in the Broadcast News database (described later), indicating the importance of using the nonlinear mapping technique.
Results and Discussion
- Non-linear Mapping and Combining
- Classifiers
- Canonical Correlation Analysis (CCA)
- Feature Selection
- Mismatched Training and Testing data
- Analysis on Vocal Music
Finally, CCA is performed with the overall set of features consisting of the existing and speech-specific features. An analysis of the behavior of the speech-specific features for the vocal music is briefly discussed here.
Summary
Spectral Contrast on DFT and HNGD spectrum representing Vocal Tract System Char-
Frame-wise, Utterance-wise and Histogram-wise Characterization of Vocal Tract System
Frame-wise Characteristics
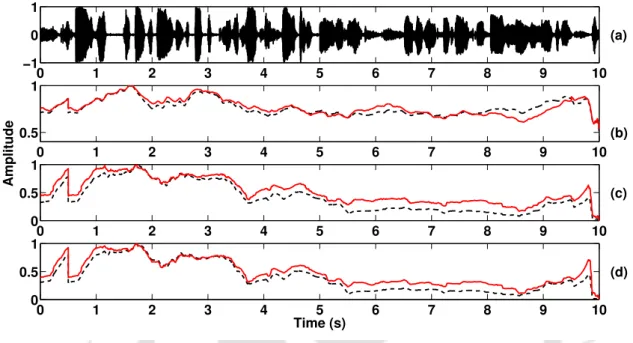
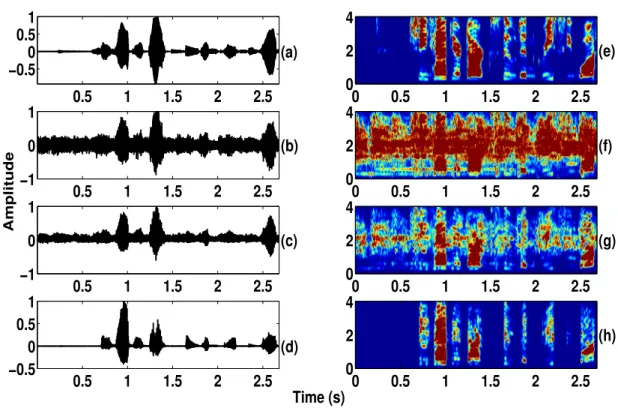
The speech with background music consists of the same pure speech segment but with the addition of music (guitar music from the GTZAN database examined with a signal-to-music ratio of 0 dB). If we consider calculating the spectral contrast (e.g. a band from 0 to 1000 Hz), its value will be lower for the HNGD compared to the DFT case.
Utterance-wise Characteristics
Similarly, the sum of the spectral contrast, peaks and troughs for the HNGD case is calculated and plotted in Figure 4.3 (e), (f) and (g). The sum of the spectral peaks in Figure 4.3(c) HNGD (solid red) is higher than DFT (dotted black) for both pure speech and speech with background music regions.
Histogram-wise Characteristics
Description of Feature Extraction and Classification of Clean Speech vs Speech with
The value of the smoothed sum of the spectral contrast for the speech segment with background music is almost the same for both the HNGD and DFT spectrums (6.5-8). This shows that the sum of the spectral contrast calculated on the HNGD spectrum has a higher level of discrimination between the pure speech and speech with background music areas.
Results and Discussion
- Database
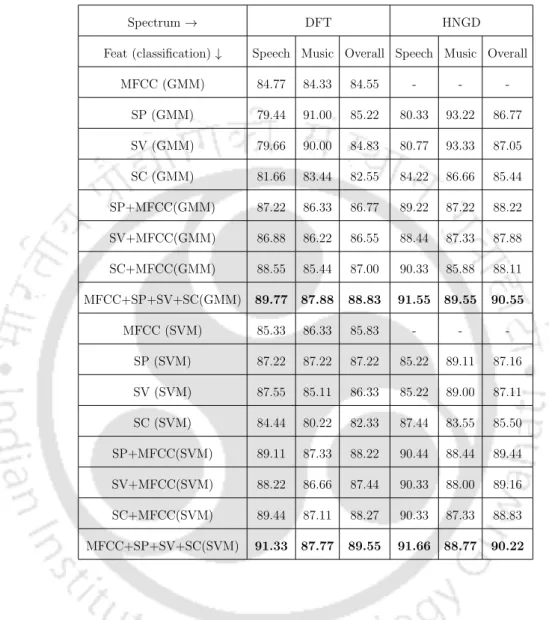
- Results using GMM and SVM
- Mismatched Training and Testing Data
- Results without Summing the Features
- Results on Speech with Background Noise of BN database
The sum of the spectral contrast function works less compared to the sum of the spectral peaks and valleys. For the BN database, the sum of the spectral contrast also performs better than the 6-dimensional spectral contrast.
Summary
Source information from clean speech is extracted in terms of epoch locations from the zero-frequency filtered signal (ZFFS), and vocal tract system information is extracted from speech with background music, in terms of MCCs obtained using the MLSA filter. The speech signal is synthesized using the excitation source signal in the form of an impulse train (consisting of impulses at the epoch location obtained from the ZFFS of pure speech and the uniform power of the epoch which means that the excitation strength ( SoE) is not taken into account) and the vocal tract system consisting of MCCs obtained using the MLSA filter from speech with background music.
Speech Enhancement
Temporal Enhancement
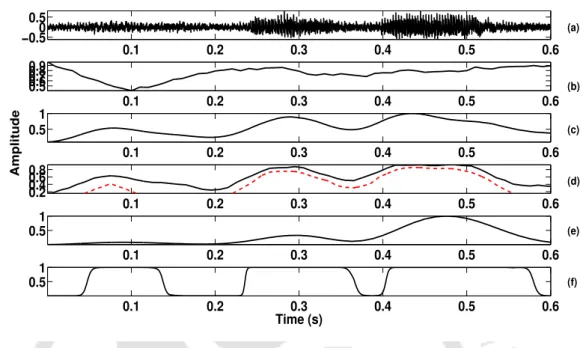
The resulting summary value of the mean and standard deviation can be observed in Figure 5.5 (b) for a segment of speech augmented with rock music at a speech-to-music ratio (SMR) of 0 dB. Finally, the epoch locations obtained from the zero negative to positive transitions of the signal in Figure 5.4(e) are shown in Figure 5.4(f).
Spectral Enhancement
The total weight function is multiplied by the LP residual shown in Figure 5.6(e) to obtain the weighted LP residual shown in Figure 5.6(f). The plot of the speech temporarily enhanced for a short segment is shown in Figure 5.6(g).
Perceptual Enhancement
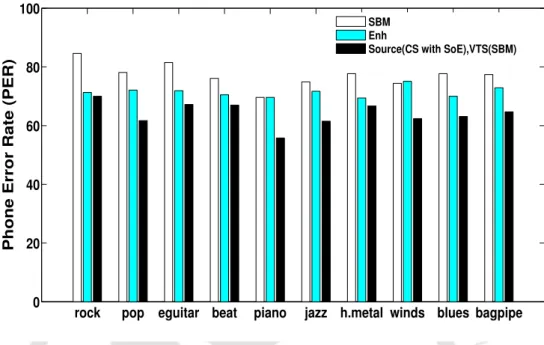
In the table, 'SBM' indicates speech with rock music added in the background, 'CS' indicates pure speech, 'VTS'. Source (SBM with SoE), VTS (CS)' indicates the speech synthesized using the source of SBM (together with SoE) and the VTS of CS.
Experimental Evaluation
- GMM-HMM
- SGMM-HMM
- DNN-HMM
- Results
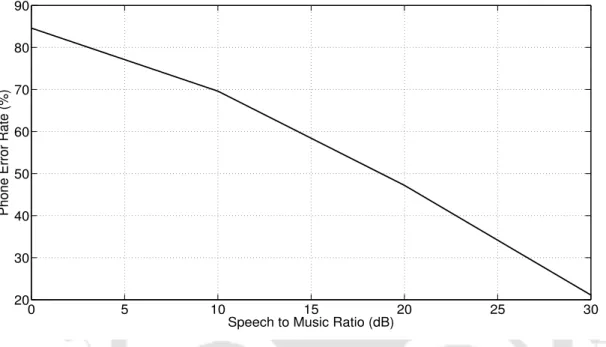
Note that there is a significant improvement in PER when the source is extracted from the clean speech. The results when the source is extracted from speech with background music and the voice system from the pure speech are shown in the last column of Table 5.1.
Summary
In this work, the complexity of the preprocessing steps is reduced by considering the telephone transcription of certain scenarios in the broadcast audio. Pure speech, as well as speech with background music segments, will be classified in the speech class due to the speech-specific nature of the features.
Modules necessary for Preprocessing
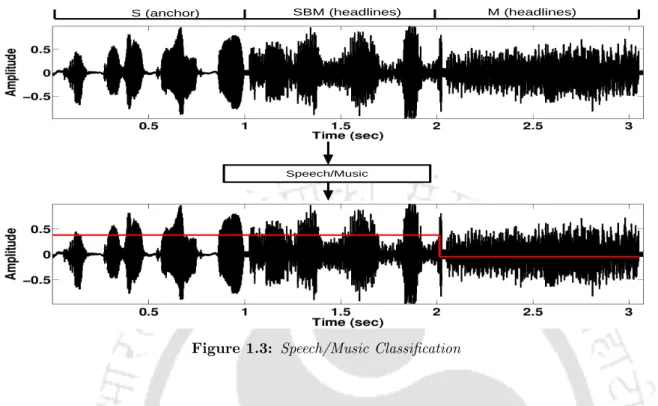
Speech/Music Classification
Therefore, it is a better idea to define the features in terms of speech, which have been well understood in terms of production characteristics, in the hope that the speech-specific features differ significantly in the music segments, thus achieving some kind of discrimination between speech and music. The speech-specific properties are the properties defined with respect to the source, the vocal tract system, and the suprasegmental information.

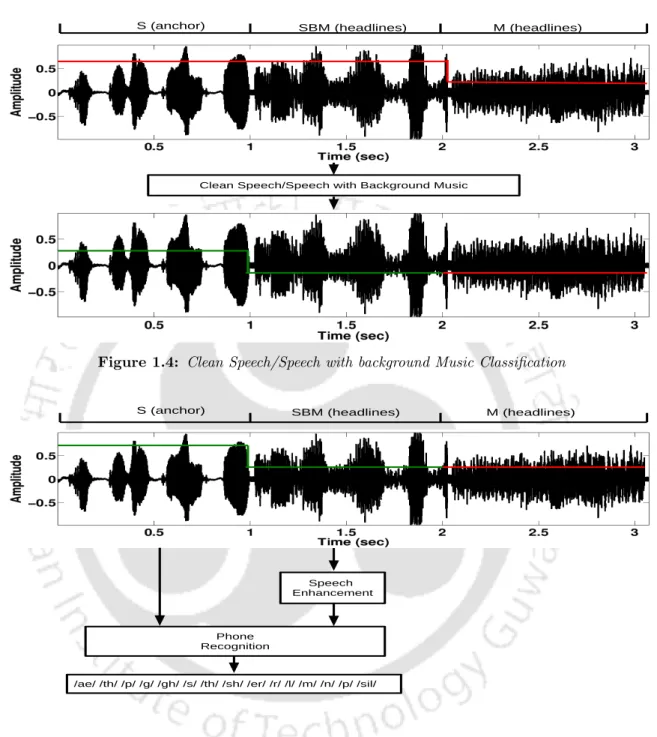
Clean Speech/Speech with Background Music Classification
These enhanced files can then be passed through the phone recognizer, to achieve better transcription accuracy than passing the speech directly with background music, which introduces acoustic mismatch.
Enhancement of Speech with Background Music Regions
Time-based enhancement involves obtaining a weight function to modify the linear prediction (LP) residual [17] of speech with background music. This weight function is a combination of the gross weight function and the fine weight function.

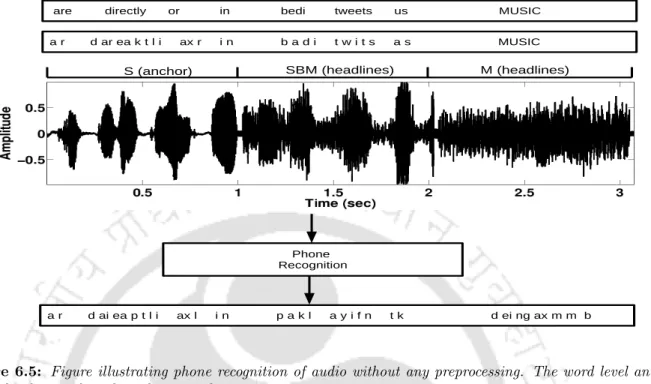
Phone Recognition
Results and Discussion
This means that only the pure speech and speech with background music parts of the audio are passed through the phone recognizer. The speech with background music portions is classified as speech due to the speech-specific nature of its features.
Summary
Future research directions enabled by the present work are also outlined. i) Speech/Music Classification with Specific Speech Features: Speech/Music classification has been investigated using speech specific features in terms of source, vocal tract system and syllabic level of speech production. By combining speech-specific features along with existing features, the best performance is achieved across all three databases. ii) Classification of pure speech/speech with background music using the HNGD spectrum: The classification system of pure speech/speech with background music has been developed based on other types of speech-specific features, mainly in terms of vocal tract characteristics.
Contributions
Directions for future work
Malpass, "Speech Enhancement Using a Sagte-Decision Noise Reduction Filter," IEEE Transactions on Acoustics, Speech, and Signal Processing, vol. Malah, "Speech Enhancement Using a Minimum-Mean Square Error-Short-Time Spectral Amplitude Imager," IEEE Transactions on Acoustics, Speech, and Signal Processing, vol.
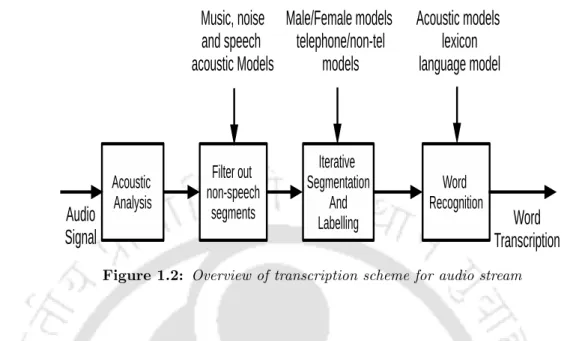
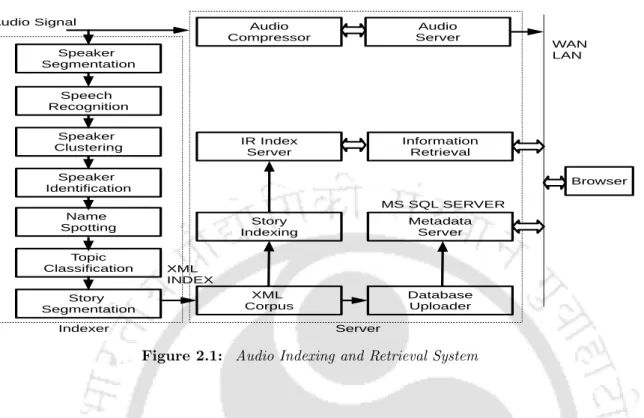
Overview of transcription scheme for audio stream
Speech/Music Classification
Clean Speech/Speech with background Music Classification
Speech Enhancement and Phone Recognition
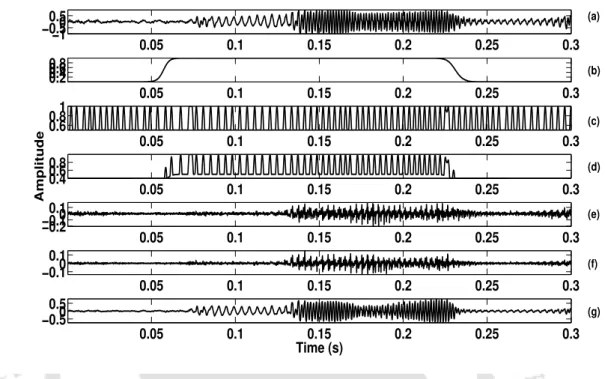
Illustration of Foreground Speech Segmentation and Enhancement (a) Noisy Speech
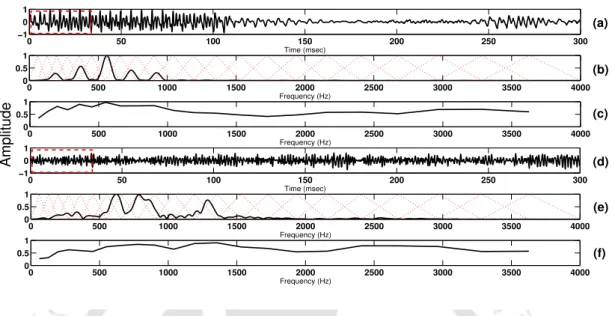
Significance of Speech-Specific Features for Classification (a) Audio Signal where the
Normalized autocorrelation plot for a selected portion of ZFFS of (a) speech and (b)