I would like to express my greatest gratitude to my parents and my siblings for their encouragement and support throughout my life. Last but not least, I would like to thank my dear friends and classmates for helping me through the depths of despair. The results are presented in terms of the gas hold-up and bubble size distribution for various gas flow rates and for different nozzles.
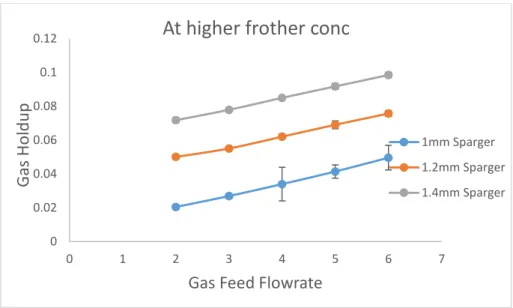
It has been confirmed by ERT that gas retention increases with increasing airflow rate. To compare the reliability of the ERT measurements, a high-speed video camera was used to obtain the bubble size distribution from which we could calculate the average gas holdup. It is observed that the bubble size distribution is more in the central region of the bubble column and the gas hold-up value increases with increasing gas feed rate.
Introduction
Many researchers tried to characterize the bubble column and the two-phase flow using ERT/EIT in the past. The gas-liquid dispersion is one of the most important properties and application of the Bubble column. While the gas phase in a bubble column with a smaller diameter flows almost without back-mixing, large units behave more like stirred tanks[1].
Gas holdup, bubble size distribution, gas/liquid superficial velocity in bubble column operation are important and they indicate the bubble column performance. Electrical resistivity tomography can be used to obtain tomographic images to characterize the gas-liquid flow in the bubble column. Study the effect of bubble column design parameters and operating conditions on gas holdup.
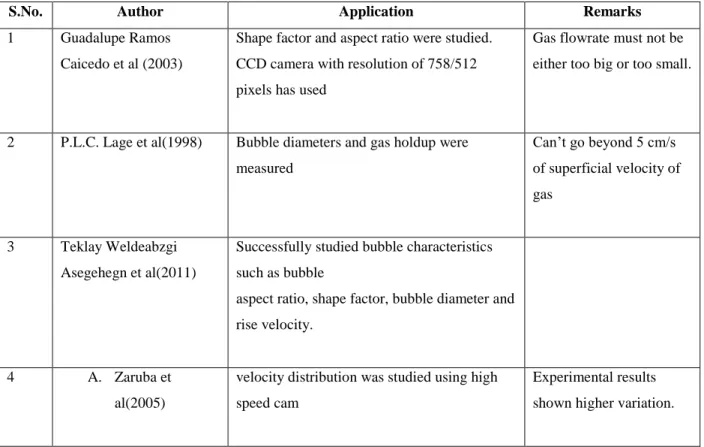
Literature Review
No. Gas Flowrate
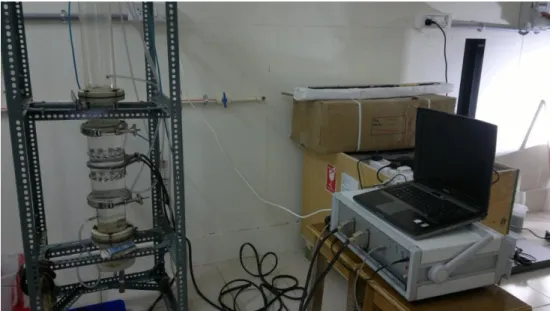
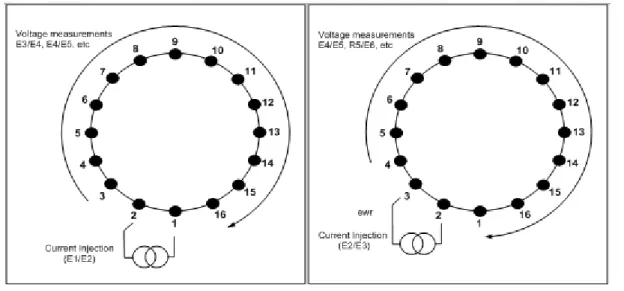
ERT technique is used in the present study to measure the gas storage profiles and the effect of different design parameters and operating conditions of the bubble column on the gas storage. Sensors are connected to cylindrical part of bubble column as shown in figure, the part on the other side of the sensors is connected to the DAS. Sixteen evenly spaced electrodes (sensors) are attached to the perimeter of the bubble column in each plane and there are two planes in the cylindrical section.
The measurement strategy is very important to know the conductivity distribution inside the column of bubbles through the electrodes that are arranged around the boundary. This host computer is used to store and collect data from the DAS system. Tests were conducted to determine the effect of air flow rate, nebulizer addition, and frother on gas retention in the bubble column.
The diameter of the bubble column is 100 mm and the hole diameter of the sparger is 1 mm. Before the electric potential within the domain is obtained from the variational form of the governing equation, it is approximated by the linear combination of piecewise polynomial interpolation functions. By the Gaussian divergence theorem to the second term of the left side of the above equation.
From the boundary condition equation [4], the first term of the right side of the equation becomes zero then the equation becomes [8]. Using this approximation for conductivity, conductivity can be taken outside the integral for the above equation. Minimization of square norm of the difference between measured boundary stresses and calculated boundary stresses using numerical methods is an important task of image reconstruction algorithm of ERT.
In Kotter's linear back-projection method, the normalized transpose of the Jacobian is applied to the voltage difference data, giving the conductivity update.
ERT data analysis
Using the adjacent ERT measurement strategy to know the conductivity distribution within the bubble column through electrodes placed around the boundary. To know the conductivity value from ERT, the data extracted from the ITS tool set was used. This excel sheet extracted from the ITS toolkit was used as an input file in the EIDORS MATLAB package to calculate the conductivity distribution.
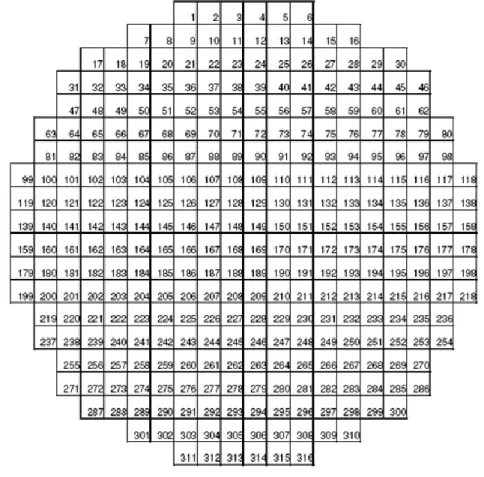
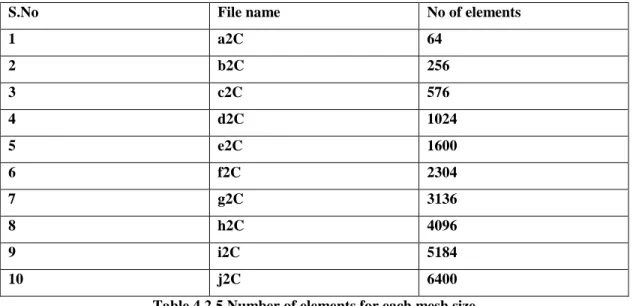
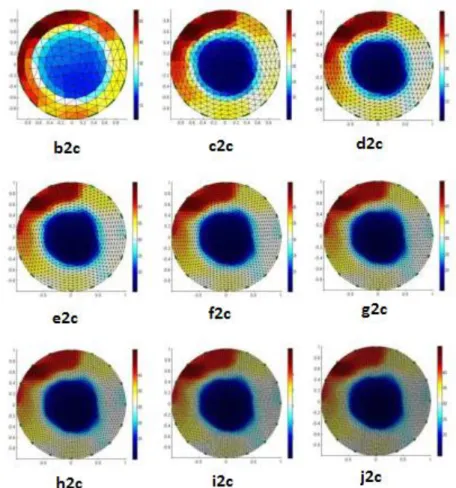
The average conductivity tomogram was extracted to know the conductivity distribution over the level-1 and level-2 of ERT system along the cylindrical portion of bubble column. Only 316 elements were therefore taken into account in such a way as shown in fig 4.2.5. The following figure represents the conductivity distribution over the bubble column over the two planes where electrodes are internal to the wall of the cylindrical portion of the bubble column. From the known surface tension measurements, the calculation of the conductivity values is known as an inverse problem.
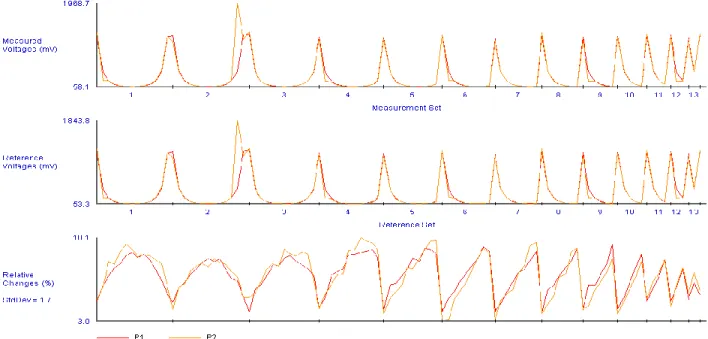
The following three image reconstruction algorithms are used to reconstruct the conductivity images. 1. Tikhonov regularization. Data analysis is performed using a data set of five different airflow rates and a sparger diameter of 1 mm. The number of frames collected using the ERT system is 2500 frames, the voltage measurement was performed by averaging the frames. The voltages generated by averaging the collected frames of the ERT system are used to obtain the conductivity distribution for different types of mesh.
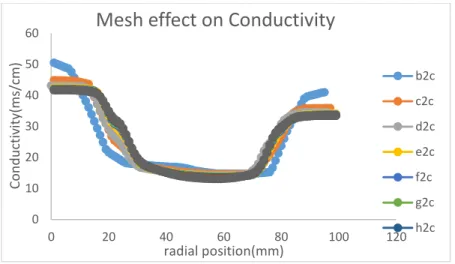
The conductivity plots over the radial position of the plane over the bubble column were plotted for different mesh sizes. In this section, we discuss the effect of the image reconstruction algorithm on the conductivity data from ERT. GN-one step, Tikhonov regularization and Total Variation image reconstruction algorithms are used to obtain the conductivity tomograms from the surface tensions.
The conductivity distribution over the radial position of the bubble column was plotted for an air flow rate of 2 lpm and a nozzle diameter of 1 mm was used.
Results & Discussions
In this section, the effect of a sprayer with different concentrations of surfactant addition to water in a bubble column is discussed. Here, the higher concentration of surfactant refers to the addition of 4 ml of methyl isobutyl carbinol (MIBC) to water, and the lower concentration of surfactant refers to the addition of 1 ml of MIBC. Here, we imaged the bubble column flow with a Photron high-speed video camera under the same experimental conditions as used for the ERT experiments.
The images of the captured bubbles were analyzed using a MATLAB program to perform a quantitative analysis of the images in order to obtain data on the sizes, shapes and orientations of the bubbles. We capture the video of the flow using the high speed camera and then the video is converted into images and then the resulting image is used to get the required data. As mentioned before, a MATLAB program was used to find the bubble size distribution by giving the recorded image as an input file to the MATLAB program which gives us the information about the size from the image based on the edge detection method.
Pixel calibration: The length of the projected surface was given in mm, as the projected surface was measured with a scale during the experiment. Six points on the edge of the bubble were performed and a best fit of 5 parameters was performed to represent the ellipse. It was assumed that the depth of the bubble is equal to the long axis, a, so the equation for the volume of the bubble can be expressed as follows, viz.
In some parts of the image, it was difficult to identify the edge of the bubble due to their rapid movement. Another disadvantage of image analysis is that only the edge of the bubbles can be captured when the bubbles are close to the column wall. The bubble size distribution curves were compared with the ERT data to determine the compatibility of the ERT experiments.
Images were taken for different gas flow rates of 2,3,4,5 and 6 lpm and bubble size distribution was obtained for different flow rates and observed that the bubbles are more in the central region of the bubble column.
2lpm
The same graph above was shown as bar graphs at each gas supply flow rate below.
3lpm
4lpm
5lpm
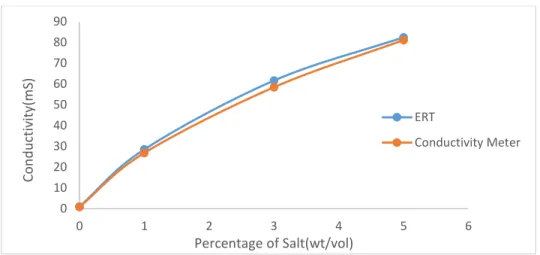
Validation of ERT data
Conclusions and Future Work
Williams, Analysis of Bubble Behaviors in Bubble Columns Using Electrical Resistivity Tomography, Chemical Engineering Journal Rajamani Krishna, Jeroen W. A. de Swart, Jurg Ellenberger, Gilbert B. Martina and Cristina. Maretto, Gas Holdup in Slurry Bubble Columns: Effect of Column Diameter and Slurry Concentrations, AIChe Journal, February 1997, Vol. 43, No. 2. Williams, Measurement of gas holdup profiles in a gas-liquid flowing bubble column using electrical resistivity tomography, Flow Measurement and Instrumentation.
Azzopardi, Characterization of a high-concentration ion bubble column using electrical impedance tomography, flow measurement and instrumentation Mohammad Ramezani, Navid Mostoufi and Mohammad Reza Mehrnia Improved modeling of bubble column reactors considering bubble size distribution , Ind. Quaiao, Ind.Q. of dual plane ERT system and interfacing technique for measurement of gas-liquid flows in vertical pipeline, Flow Measurement and Instrumentation. MannChemical, Measurements of Gas-Liquid Mixing in a Stirred Vessel Using Electrical Resistivity Tomography (ERT), Engineering Journal F.
Xu, Application of electrical resistance tomography to measurement of two-phase pipe flow parameters, flow measurement and instrumentation Nigar Kantarci, Fahir Borak, Kutlu O. Heindel, Estimation of gas entrapment via differential pressure measurements in a direct current bubble column, International Journal of Multiphase Flow Maedeh Asari, Faramarz Hormozi. Effects of surfactants on bubble size distribution and gas accumulation in a bubble column, American Journal of Chemical Engineering, Vol.
Fahd Mahboob Aloufi, An Investigation of Gas Void Fraction and Transition Conditions for Two-Phase Flow in an Annular Gap Bubble Column, Doctoral Dissertation (2011). Slurry Concentrations, 1997, Vol. 43, no. 2. 24) Timothy Matthew Long, An Online Velocity Flow Profiling System Using Electrical Resistivity Tomography, Doctoral Dissertation (2006). Alsairafi, CFD and ERT investigations on two-phase flow regimes in vertical and horizontal tubes, international communication in heat and mass transfer.
Finch, Development and application of an image analysis method for broad bubble size distributions, Minerals Engineering.
Appendix