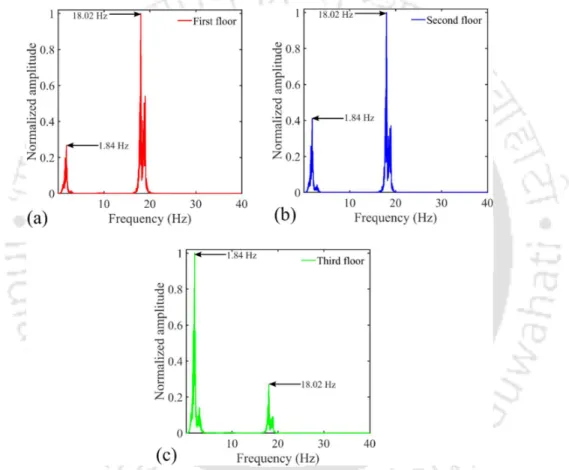
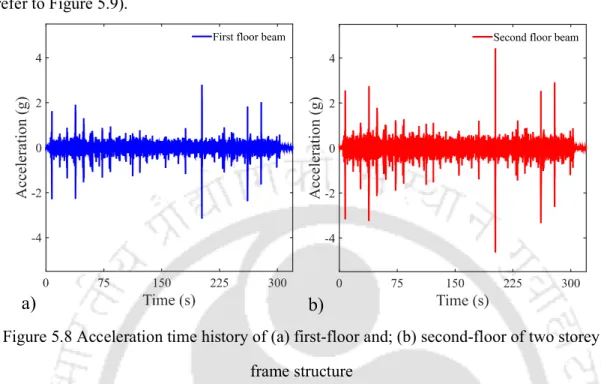
PCA”, the change in the eigenstructure is evaluated and a sensitive condition indicator (CI) is proposed. 142 Figure 5.9 Frequency spectra of dynamic response at (a) first floor beam and (b) second floor beam of the steel frame subjected to white noise excitation.
Introduction
- Background
- Motivation for structural health monitoring (SHM)
- Local and global damage detection
- Statistical damage detection in SHM
- Aim and objective of the thesis
- Organization of the thesis
Damage-sensitive indicators ideally suited for the statistical quantification of the dissimilarity of time series coefficients are explored and presented in the thesis. The main objectives of the thesis are to explore different statistical signal processing techniques to detect and quantify the severity of damage in the structure.

Literature review
Natural frequency-based methods
Natural frequency-based methods quantify damage with the help of a damage-sensitive feature based on changes in the natural frequency of the structure. 1993) presented a procedure to identify the crack location and size in a one-dimensional beam structure with the help of natural frequency measurements.
Mode shape based methods
Using experimental tests and FEM analysis, these methods establish a relationship between change in mode shape and damage. These modern methods use signal processing technique to identify the location of damage by detecting the local discontinuity of curvature of mode shape due to damage.
Mode Shape curvature/strain energy change
In this study, the curvature of the beam shape corresponding to the undamaged and damaged condition was numerically evaluated. The elementary "MSE" is defined as the product of the second power of the mode shape component and the elementary stiffness matrix.
Methods based on other modal parameters (damping, flexibility etc.)
Corresponding to largest ij, the column of the flexibility matrix indicates the degree of freedom where the variation in flexibility is maximal or the location of the damage. They also showed that the damping factor is directly proportional to the increase in the depth of the crack.
Time-domain based methods
- Time series analysis and signal decomposition based methods
- Blind source separation based methods
- Phase space-based methods
- Online recursive methods for SHM
- Brief review on damage sensitive features (DSFs)
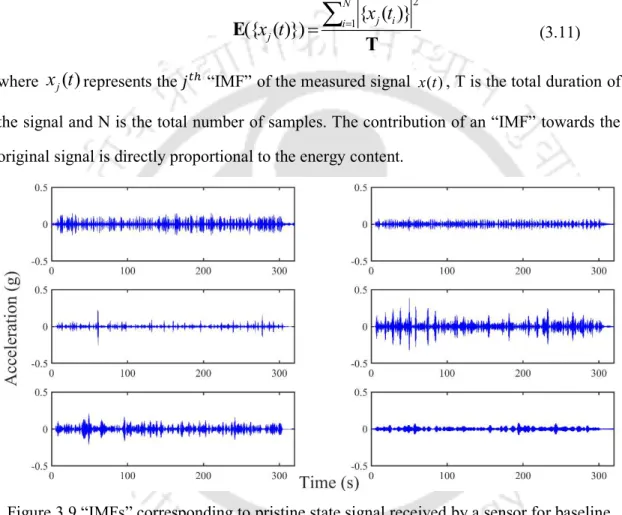
Where x(t) is original signals, "ci" refers to "IMF", the total number of "IMF" is represented by "n" and "rn" is the residual signal. An analytical model was developed to simulate the effect of tooth cracking for equipment also with the help of "EMD", the experimental data were. In the case where an immediate damage decision is required to avoid catastrophic failures such as aerospace systems, bridges, etc., online methods have great potential.
Gap Areas
To demonstrate the effectiveness of all the proposed “SHM” approaches in the present work, the experimental study is carried out on two different simplified models of a building. This assumption limits the change in orientation or position of columns for all floors of the entire building. All the assumptions mentioned above limit the type of buildings that can be idealized as a shear building.

Principal component analysis based damage quantification approach for
Introduction
These approaches assume that the structure behavior is linear and detect the damage using changes in the extracted feature or the proposed new damage index derived from these features (Worden et al., 2008). The commonly used features are a change in the natural frequencies, change in the mode shape and reduction in the damping of the system (Yang et al., 2004a). The dominant “IMFs” contain most of the important information and are free of noise and redundant information (Tang et al., 2012).
Experimental investigation
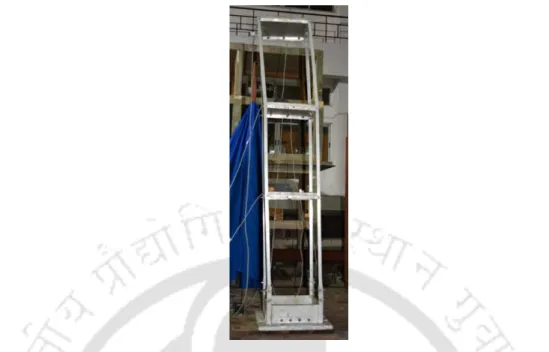
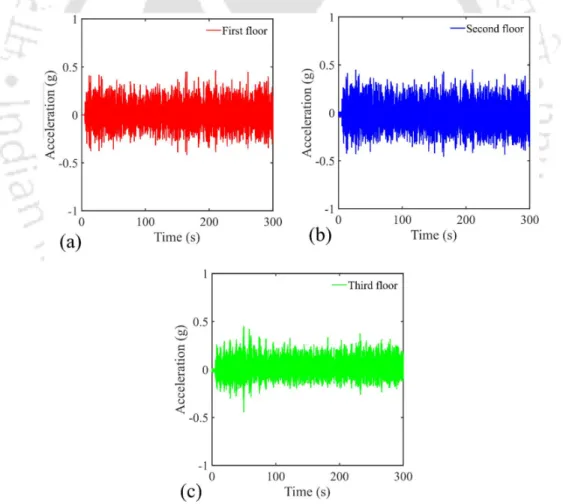
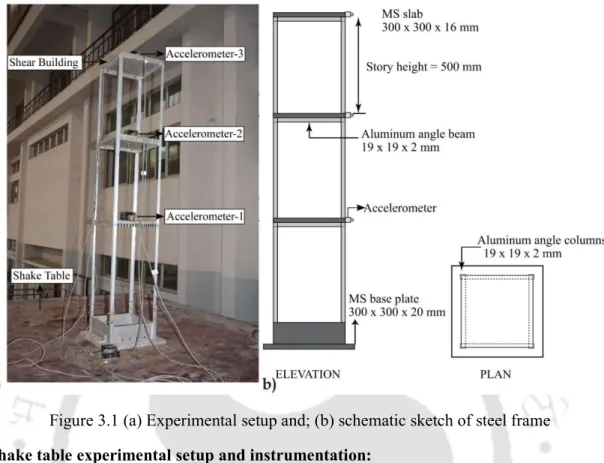
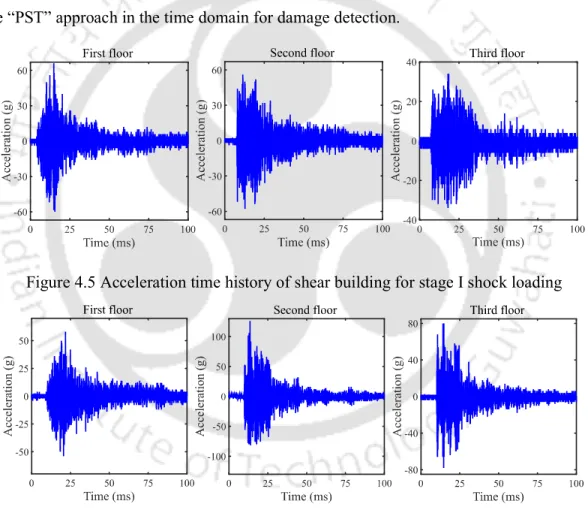
The image of the scissor building mounted on a shaking table, along with the schematic diagram, is shown in Figure 3.1. The shear building was equipped with three accelerometers on each floor to obtain the dynamic response. The time history of the acceleration response at all three floors of the shear building is shown in Figure 3.4.
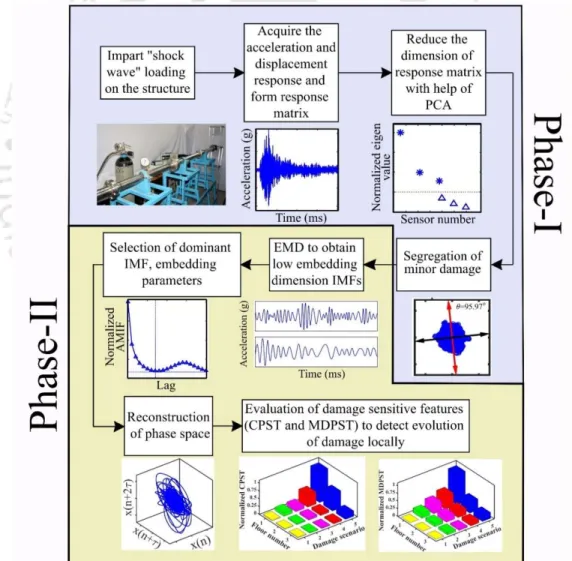
Building blocks of the proposed algorithm for damage detection
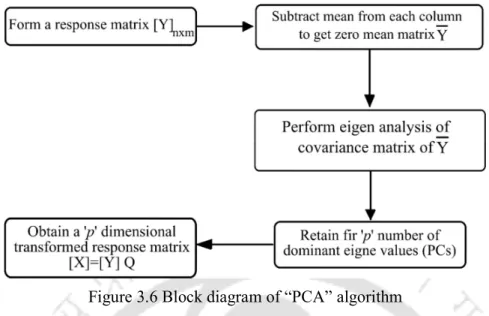
- Principal component analysis
- Empirical mode decomposition
An "IMF" has single local frequency content, no two different "IMFs" have the same frequency content at a particular time, and the "IMF" is always symmetrical. The procedure to obtain the "IMFs" is as follows: first of all, using cubic spline fitting of the entire signal over all local minima is performed to achieve a lower signal envelope; in the same way, an upper envelope is also obtained. The whole procedure of obtaining "IMFs" is repeated until Rn becomes a monotonic function from which no "IMF" can be obtained.
Algorithm for damage detection in shear building
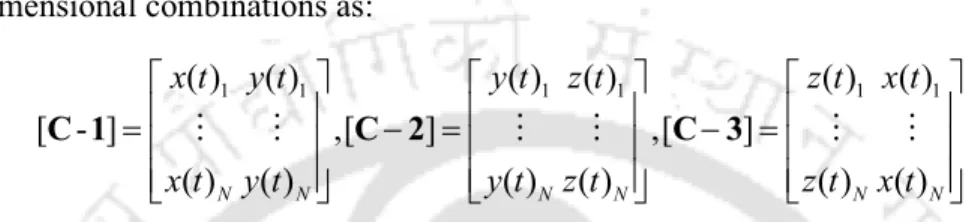
The acquired acceleration response forms a response matrix [A] of size N x 3, where the number 3 indicates the total number of accelerometers and N the total number of data points acquired. In the next step, the correlation or energy of each single-component "IMF" is estimated, and the "IMF" corresponding to the largest correlation or energy is considered the dominant "IMF". This step considers the "PCA" of all possible two-dimensional combinations of the response matrix.
Results and discussion
- Empirical mode decomposition of response signals
- Principal component analysis of dominant intrinsic mode functions
- Evaluation of CI
The columns of [XIMF] contain the dominant “IMFs” that correspond to the columns of the response matrix [X]. The PCs obtained using “PCA” are an essential indicator of the fundamental eigenstructure of the data. In the present case, the changes in the eigenstructure of the matrix [XIMF] corresponding to pristine and damaged states are investigated.
Conclusion
Instead of determining the location of damage, the extent of the damage is quantified using CI. Instead of processing raw data, "IMFs" are processed for evaluation of CI, because due to "EMD" noise and redundant information are suppressed. The noise if present can significantly change the value of CI, but "EMD" helps to avoid the false interpretation.
Damage detection using dissimilarity in phase space topology of shear-
Introduction
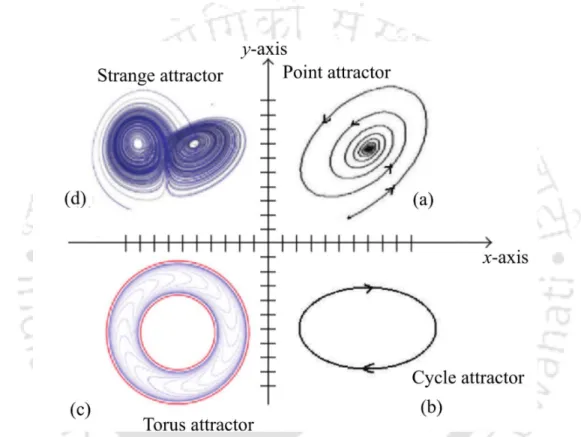
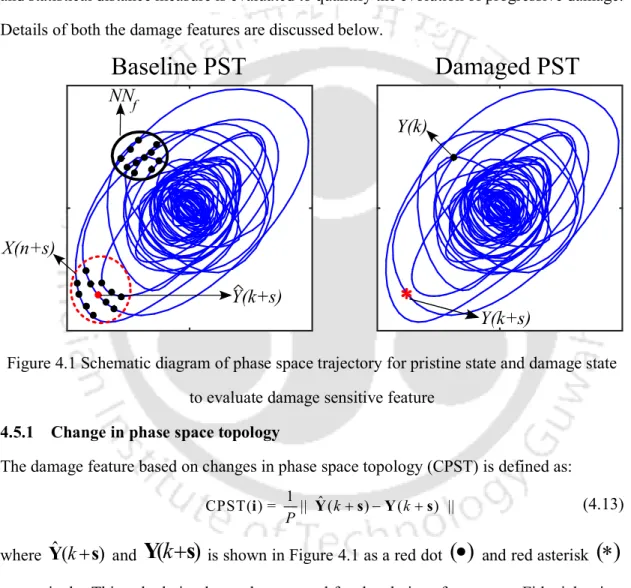
Phase space is a graphical representation of measured state variables of a system in the multidimensional orthogonal coordinate system. The phase space approach has not been explored to detect damage in the structure subjected to extreme loading. Two robust “DSFs”, namely change in phase space topology (CPST) and Mahalanobis distance between phase space topology (MDPST), are used to detect a defect in the structure damage through shock loading.
Principal component analysis
Empirical mode decomposition
Phase space reconstruction
- Average mutual information function to obtain time delay
- Singular value decomposition to obtain embedding dimension
- Stepwise procedure for development of phase-space topology
The time delay corresponding to the first minimum of "AMIF" is chosen as the reconstruction delay. Singular system analysis (SSA) and false nearest neighbor (FNN) methods are commonly used methods to obtain the optimal embedding dimension (Broomhead and King, 1986, Kennel et al., 1992). The singular values obtained by SVD are plotted as a function of their indices, and the point at which the plot reaches close to zero is chosen as the optimal embedding dimension.
Damage sensitive feature
- Change in phase space topology
- Mahalanobis distance between phase space
Therefore, the total number of neighborhood points (P) is important and is generally chosen in the range from 10-4 N to 10-3 N, where N is the total number of points in the reconstructed trajectory (Nichols, 2003). Two main “DSFs” are adapted in the present study, namely the difference in phase space topology (CPST) and the Mahalanobis distance between phase space topology (MDPST). The appropriate number of fiducial points to be selected is at least 5% of the total number of points in the reconstructed trajectory to obtain a reasonable estimate of "CPST".
Proposed damage detection algorithm
Similarly, the procedure is repeated for different choices of reference points that are approximately equal to 5% of the total number of points (n t) for time-varying steps from k 1 to ' 's. For the given reference points at a selected time, a vector of MD dmahal( ) k k1:sis is calculated. The reliable estimate of MD is evaluated for a number of selected fiducial points( ) nt given.
Experimental investigation
As shown in Figure 4.3 (a), the impact load was applied on the 'first floor' of the three-storey building. Experiment-1: Shock loading was applied 'once' to the first floor of the sound rock building. Experiment-2: Impact loading was applied 'twice' on the first floor of the healthy case building.
Results and discussion
- Structural response due to shock loading
- PCA of response data to identify non-linearity induced in the structure
- Selection of dominant IMF and embedding parameters for phase space
- Phase space reconstruction and evaluation of damage sensitive features 118
In Fig. 4.9, the induced shock permanently deformed the shape of the shear structure for both Level I and Level II loading. Proper “PST” reconstruction requires correct selection of the dominant “IMF”, embedment dimension and offset. The "PSR" of the dominant "IMF" is performed according to the procedure explained in Section 4.4.
Damage classification in steel moment resisting frame using time-varying
Introduction
These approaches assume linearity of the structural response and identify the damage by changes in the modal parameters of the system and the new damage index (Worden et al., 2008). The migration of the traction vector in hyperspace manifests the evolution of the damage. The damage induced in the structure is quantified using the statistical metric of the feature clusters.
Time-varying autoregressive (TVAR) modelling
However, in the present case it is important to note that the "AR" coefficient tk( ) evolves with time due to the non-stationary nature of the responses obtained. To estimate these time-varying "AR" coefficients, the Kalman filter (KF) an adaptive technique has been adopted, given the incremental observational data (Grenier, 1983). TVAR" can be thought of by writing the "AR" model in a discrete state-space representation for the formulation of the adaptive filter.
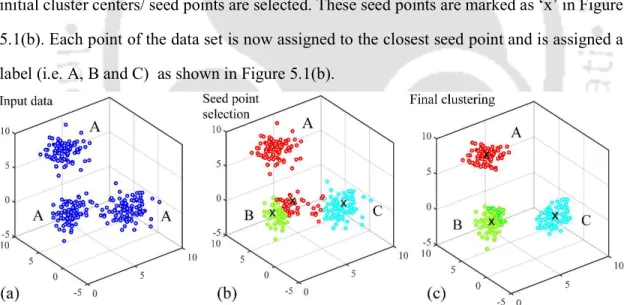
Clustering techniques and outlier detection
- K-means clustering
- K-means -- clustering
Changes in the orientation, translation and expansion of the group mean changing states. The K-means-- algorithm is used in the present work for simultaneous outlier clustering and removal. The presence of even some of the outliers may change the actual cluster centers which may lead to inefficient clustering.
Damage sensitive features (DSF)
- Mahalanobis distance (MD)
- Itakura distance (ID)
The assumption to obtain an ID is that the healthy and damage/unknown state signals consist of the same number of samples N. The sensitivity of the ID to the order of the "AR" process is quite low, as pointed out in an experimental study of performed. by Kong et al. In the present work, a low order of “AR” and “TVAR” process is adopted to avoid heavy calculations.
Proposed algorithm
Experiment investigation
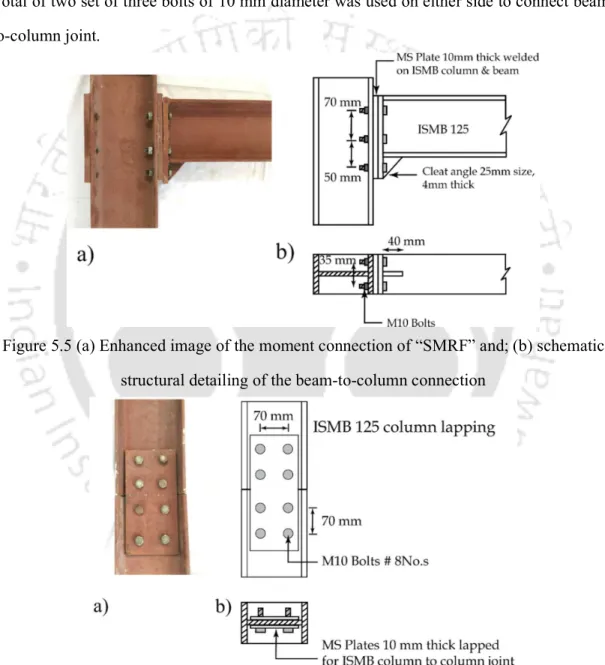
The schematic representation of the damage detection algorithm for the non-stationary response is shown in Figure 5.3. The structural detail of the moment-resistant bolted connection between beam and column is shown in Figure 5.5. In this phase, the damage was caused at the second floor level of the beam-column connection by loosening one bolt of the connection.
Results and discussion
- Acceleration response and Fourier analysis
- TVAR modelling of acceleration response
- Eigenanalysis of coefficient cluster
- K-means -- clustering of coefficient cluster
- Damage sensitive feature (DSF)
The “TVAR” coefficient for damage-1 and damage-2 status shown in Figure 5.10 (a) does not show conclusive evidence of the presence of the significant damage. This structural behavior is also reflected in the “TVAR” coefficient cluster, which indicates the sensitivity of the proposed algorithm. The “DSF” is evaluated to measure the separation of the clusters and evaluate the extent of damage.
Conclusion
The “TVARC” view clearly and spatially resolved healthy clusters and damage clusters in hyperspace. Both the “DSF” shows a larger numerical magnitude for the case of damage-2 compared to damage-1 and is successfully confirmed with the progressive evolution of damage. The “DSFs” are potential and sensitive indicators to detect the onset and progressive evolution of the damage state.
Damage quantification in moment resisting frame using phase space
- Introduction
- Independent component analysis
- Phase space representation
- Average mutual information function to obtain time delay
- Singular value decomposition to obtain embedding dimension
- Damage sensitive feature
- Mahalanobis distance between phase space trajectories (MDPST)
- Itakura distance
- Proposed algorithm
- Experimental investigations
- Results and discussion
- Dynamic response of “SMRF” subjected to white noise
- Independent component sources
- Embedded parameters for phase space reconstruction
- Reconstruction of “PST” and quantification of damage using “DSF”
- Conclusion
In the next step, the phase space topology of the modal response was reconstructed to capture the dynamic behavior of the “SMRF”. The main challenge in the generic formulation of "ICA" is neither the mixture matrix [ ]A nor the source component s t ( ) is known in advance. The sensitivity of "PST" to damage allows to quantify the damage by evaluating the geometric changes of "PST".
Summary and Conclusions
Summary and conclusions
Limitations of proposed approaches
Scope of future work