The performance of the newly developed turbine is calculated in terms of torque coefficient, power coefficient and static torque coefficient. D turbine outer diameter (m) ηTS Transmission and storage efficiency Do end plate diameter (m) θ turbine rotation angle.
Nomenclature
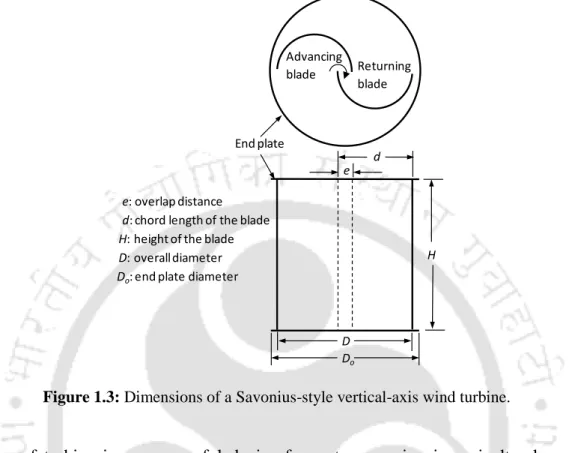
A sweeping area of the turbine (m2) α deflector angle for the advancing blade (°) CD drag coefficient β deflector angle for the returning blade. 4 1.3 Dimensions of a Savonius-style vertical axis wind turbine 5 1.4 Historic Savonius-Darrieus combined VAWT gold mine in Taiwan 6.
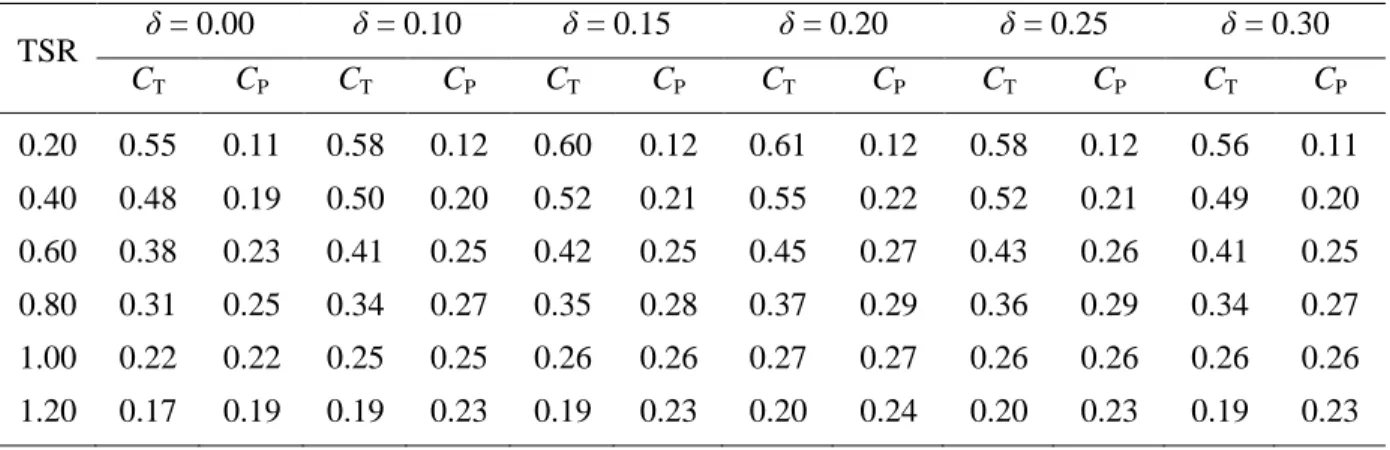
7.1 (a) 3D view, and (b) dimensions of the newly developed SSWT 86 7.2 Various Savonius-style wind turbines tested in the present study 87. 12 2.2 Power augmentation techniques used for Savonius-style wind turbines 20 3.1 Simulation results of CT and CP for conventional SSWT with variable δ 36 3.2 Simulation results of CT and CP for Bach type SSWT with variable δ at ϕ.
List of Tables
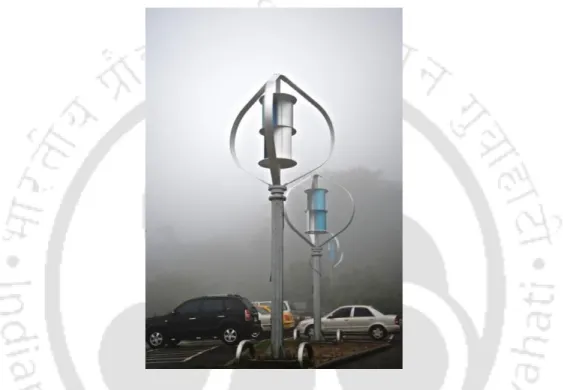
44 4.1 Area average wind speed measurement at different input voltages 55 5.1 Percentage deviations from the experimental data of Irabu and Roy (2007) 66. 92 7.2 Maximum and minimum coefficients of static torque at different wind speeds 97 8.1 Maximum CP obtained from 3D simulation and experimental investigation at V = 6.2.
Chapter Outline
Introduction
Overview
C HAPTER –1
Preface
It is noted that among the non-hydro renewable sources, wind energy can be a viable alternative to reduce the dependence on conventional energy sources. In recent years, the annual installed capacity of wind energy has therefore been significantly increased at global, national and regional levels.
Savonius-style wind turbine
In order to design a wind turbine for cases of limited space, low cost, low wind speed, easy operation and maintenance of the wind energy conversion system, Savonius style vertical axis wind turbines are among the best possible solutions. Another use of these turbines is currently seen in conjunction with Darrieus style VAWTs due to the better starting ability of Savonius style wind turbines.
Present objective and roadmap
Also, they will generate more power at high altitudes due to higher wind speeds and less obstacles. This application provides an additional benefit in reducing the requirement for the separate base and tower (Abraham et al.
Road Map
Organization of the thesis
Chapter - 4 gives a complete description of the experimental facility and instruments used in the present investigation. Chapter – 6 focuses on wind tunnel experiments of conventional and modified Bach type SSWT by varying its design parameters.
Theory and Literature Review
C HAPTER –2
- Basic concept
- Design parameters of SSWTs
- Scaling factor
- Solidity factor
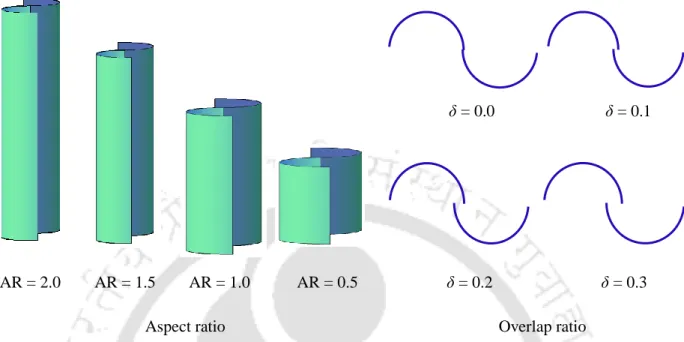
- Aspect ratio
- Overlap ratio
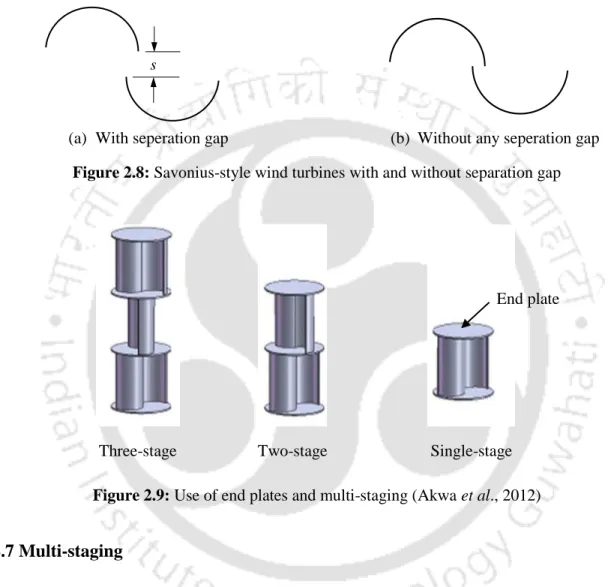
- Separation gap
- End plates
- Multi-staging
- Number of blades
- Blade profiles
- Power augmentation techniques
- Computational investigations
- Summary
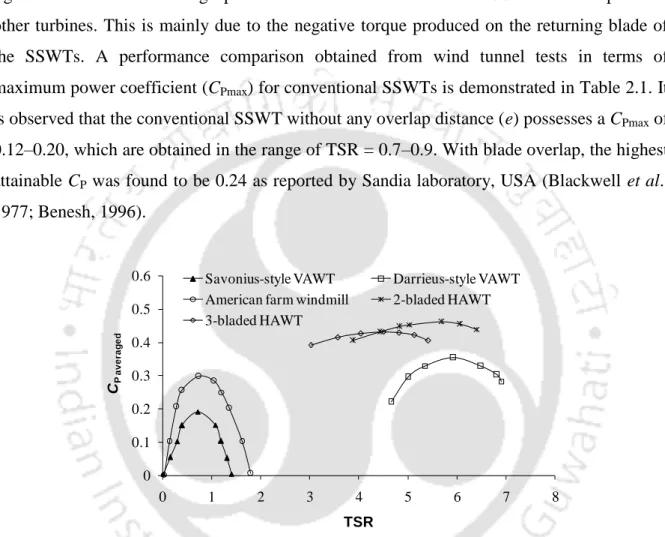
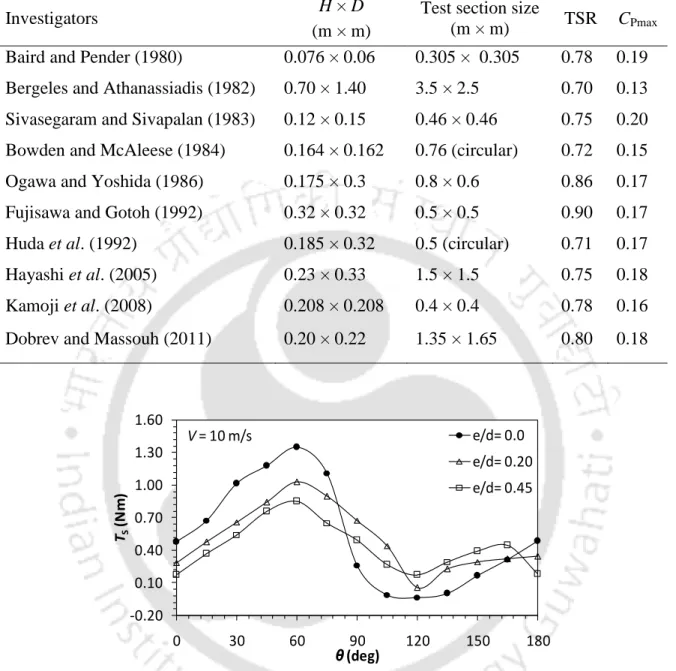
This is mainly due to the negative torque produced on the returning blade of the SSWTs. The overlap ratio of the Savonius style turbines plays a crucial role in optimizing the performance of these turbines.
2D Unsteady Simulations
C HAPTER –3
Background
The selection of calculation methodology plays an important rule in predicting the performance of these turbines (Akwa et al., 2012). The effects of steady two-dimensional studies are also found in some recent numerical studies (Altan and Atilgan, 2008; Gupta et al., 2009; Debnath et al., 2009).
Computational methodology
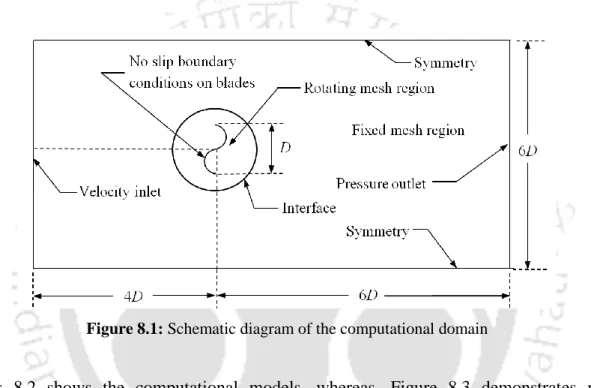
- Description of the computational domain
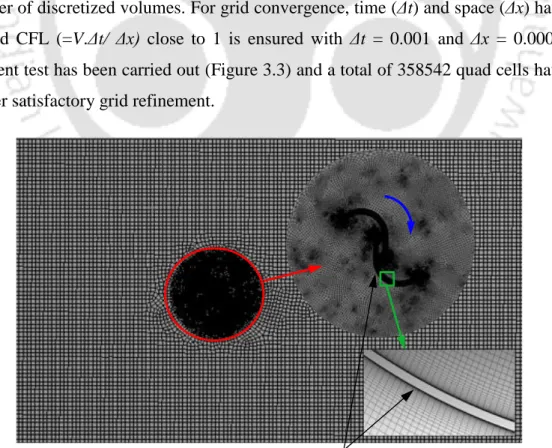
- Details of the domain discretization
- Details of the solver
- Calculation of performance coefficients
- Selection of turbulence model
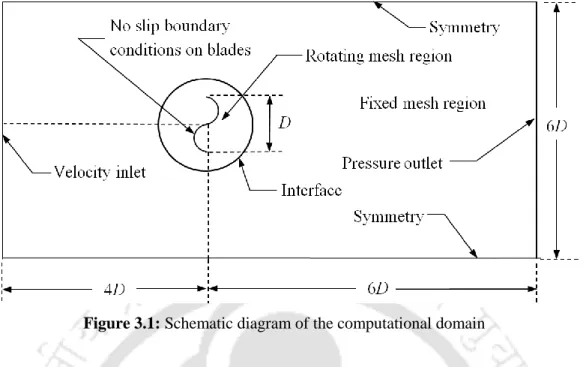
The dimensions of the computational domain, as shown in Figure 3.1, are given in multiples of the turbine diameter. The turbine models are placed at a 3D distance from the top and bottom of the domain.
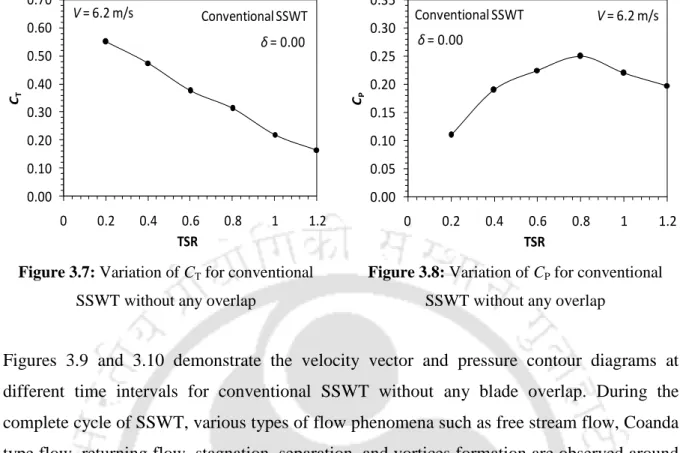
Analysis on the conventional SSWT
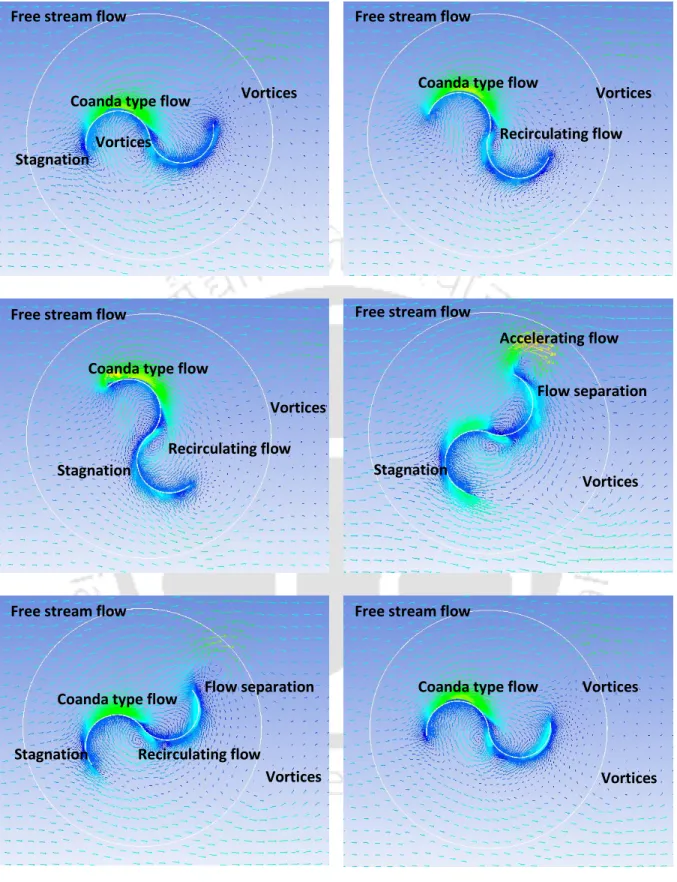
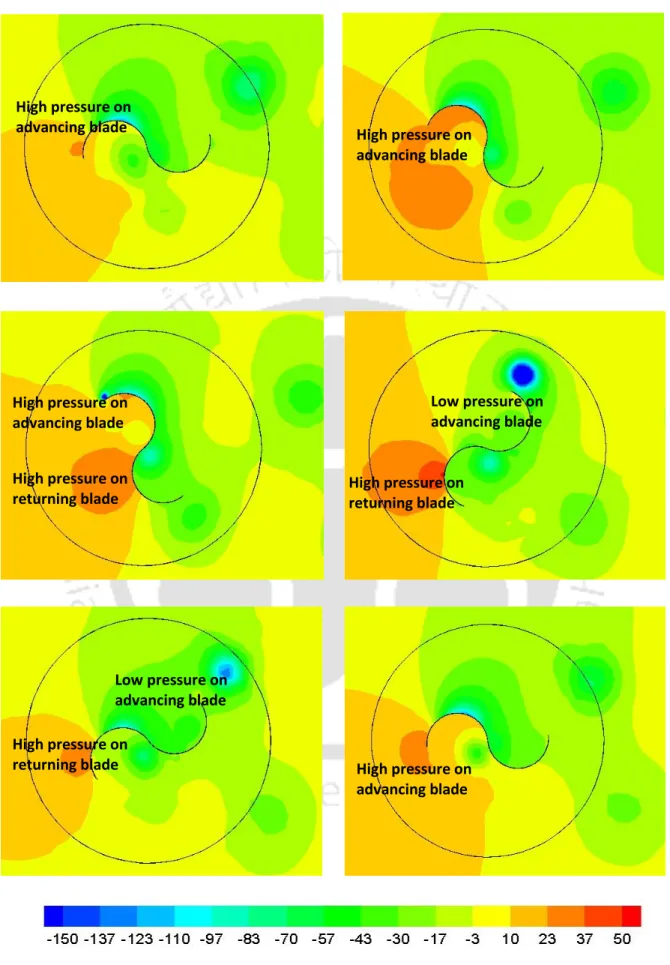
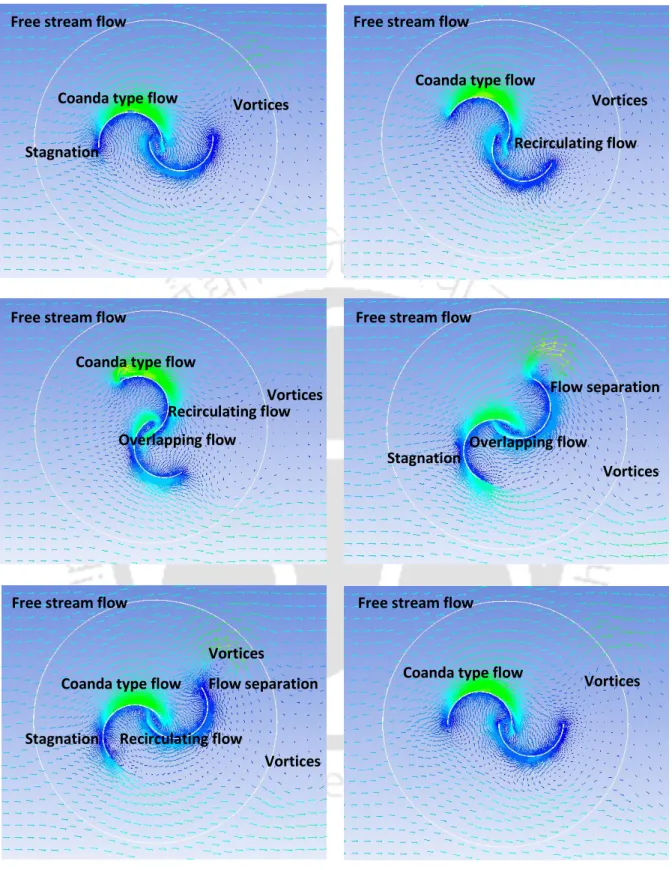
With the implementation of overlap in the conventional design, the flow accelerates near the tip of returning blade and also in the passage of the overlap (Figure 3.14). In contrast, with the increase in overlap ratio, the pressure contour plots show an increase in pressure on the returning blade (Figure 3.15). One exception, however, is the accelerating flow near the tip of the returning blade, which continues as an overlapping flow through the blade overlap region and also as the flow impinging on the advancing blade (Figure 3.16).
As a result of this overlapping flow, the pressure on the concave side of the returning blade is found to improve over δ = 0.00 (Figure 3.17).
Analysis on the Bach type SSWT
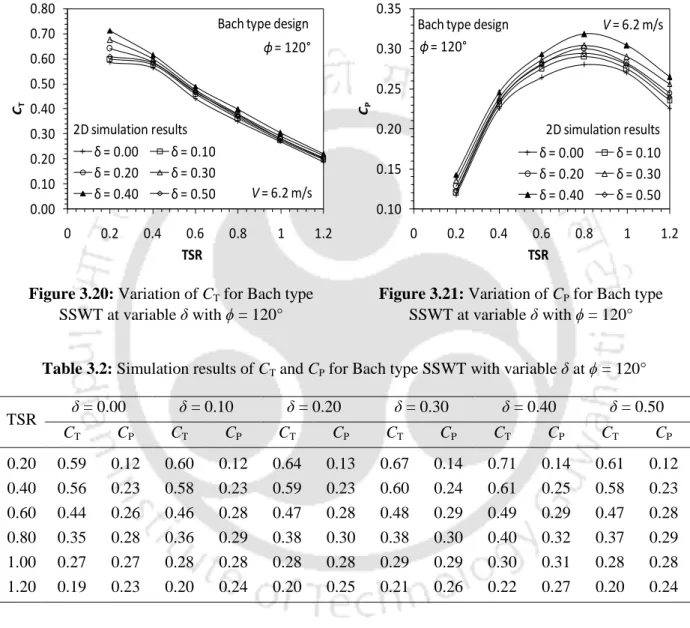
In the Bach-type designs, these negative effects are largely overcome by the return flow through the overlapping region and also by the accelerating flow over the convex side of the returning blade (Figures 3.24). Again, with the increase in the arc angle of the blade, the effective pressure on the convex side of the returning blade increases. This improvement will certainly increase the lift contribution to the turbine's net power.
These improved pressure zones certainly have a positive effect on the net power output of the turbine.
Summary
This chapter presents a detailed description of the experimental setup and instruments used in this research. Similar to the requirements of the situation, 3 types of power measuring devices are selected to measure the performance of these turbines; however, the results obtained were very poor due to high electrical losses in the generator. A mechanical dynamometer is designed and the results obtained with all measuring devices are confirmed with available experimental data obtained under the same conditions. Mechanical measurement shows a reasonable match.
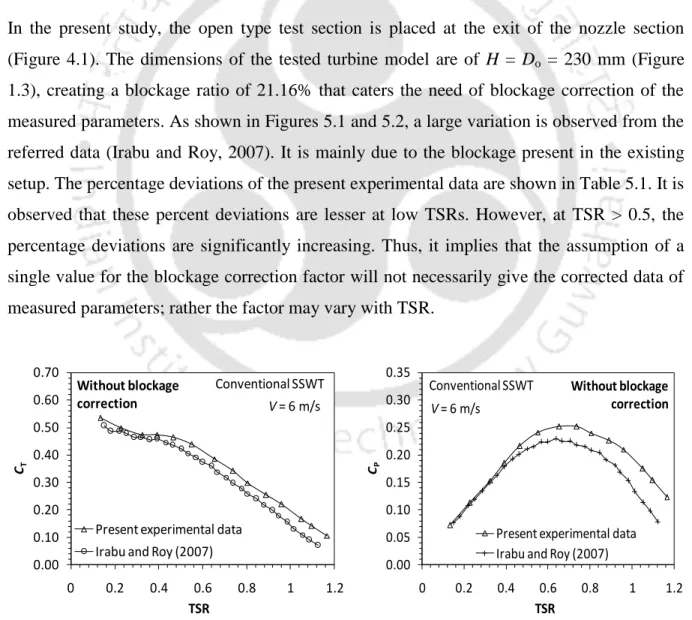
However, the validation shows the need to correct wind tunnel blocking in the current experimental setup.
C HAPTER –4
- Experimental facility
- Wind speed measurement
- Power and torque measurement
- Error analysis
- Summary
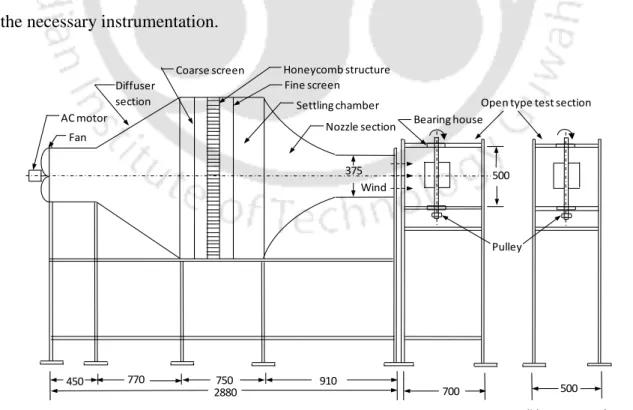
However, at the corners of the outlet section (at a distance of about 375 mm), a marginal increase in wind speed is observed. The obtained results are compared with the reference data for the conventional SSWT (δ . = 0.20) as shown in figure 4.11. A further increase in wind speed to V = 8.9 m/s, the percentage deviations are observed to be within ± 3.9.
A detailed description of the experimental facility and instruments used in this study is provided.
Wind Tunnel Blockage Correction
C HAPTER –5
- Wind tunnel blockage
- Need of blockage correction
- Methodology of blockage correction
- Results and discussion
- Summary
The blocking correction is largely dependent on the type of test section used in the wind tunnel, i.e. Conversely, the correction of wind tunnel blockage can be seen in research by Biswas et al. 1999) suggests that the plugging correction factor (f) in the open-type test section should be of opposite sign and less than that of the closed-type.
In this chapter, we attempt to account for the blocking correction factor (f) in wind tunnel experiments for a small-scale wind energy conversion system involving Savonius-type wind turbines (SSWT) in an open test section.
C HAPTER –6
Experiments on conventional SSWT
- Effect of aspect ratio
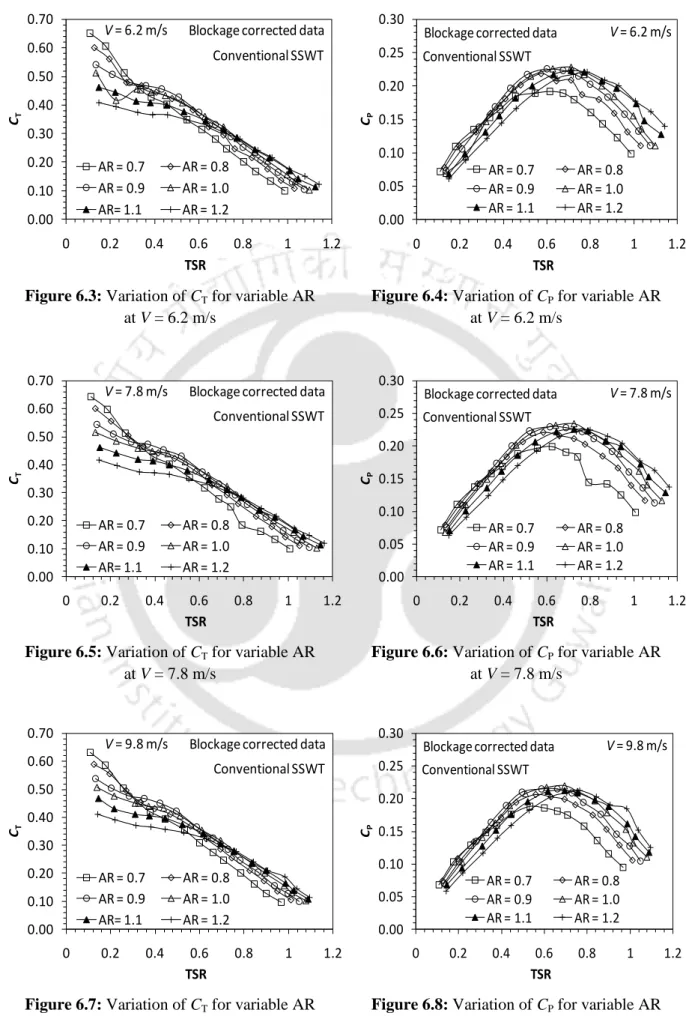
As already discussed in Chapter-2, the turbine aspect ratio, AR (H/D) plays an important role in achieving satisfactory turbine performance. This is mainly due to the fact that as AR and TSR increase, the power-to-weight ratio of the turbine increases and the effect of inertia on the rotational speed of the turbine decreases. The turbine aspect ratio AR = H/D = 1.1 is chosen based on the above experimental studies (Section 6.1.1).
This analysis shows that the maximum CP value for conventional SSWT can reach up to 0.23 with a suitable AR = 1.1 and δ = 0.20.
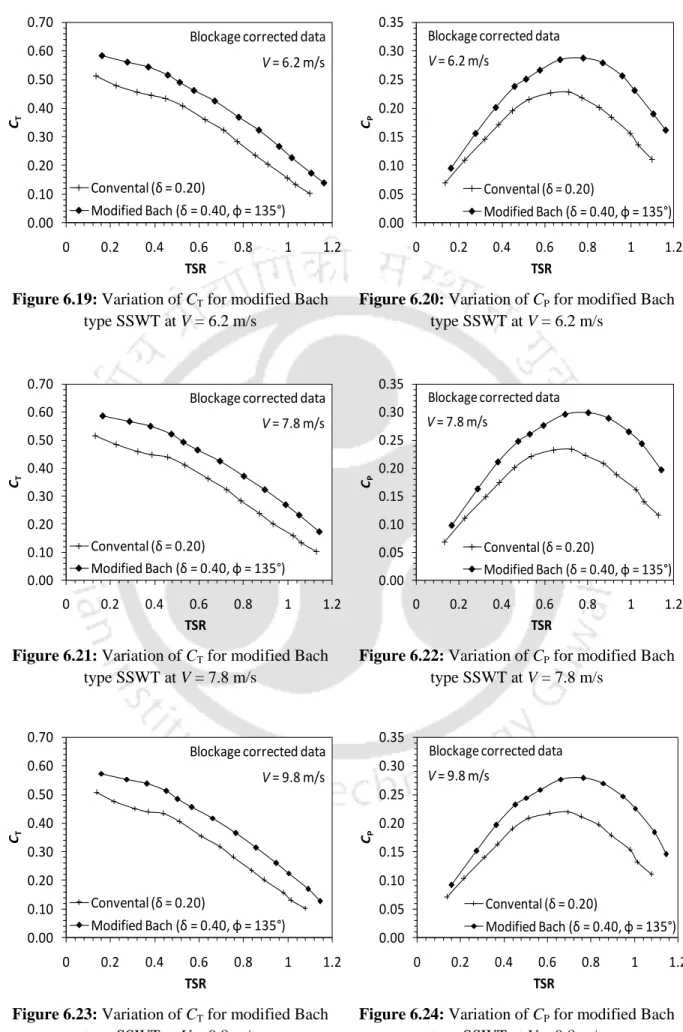
Experiments on modified Bach type SSWT
Thus a performance gain of 15.4% is obtained with the modified Bach type over the former. This is basically due to the flow acceleration through the overlap passage, which allowed an additional force to the concave side of the returning blade.
Summary
Development and Analysis of the Newly Developed SSWT
C HAPTER –7
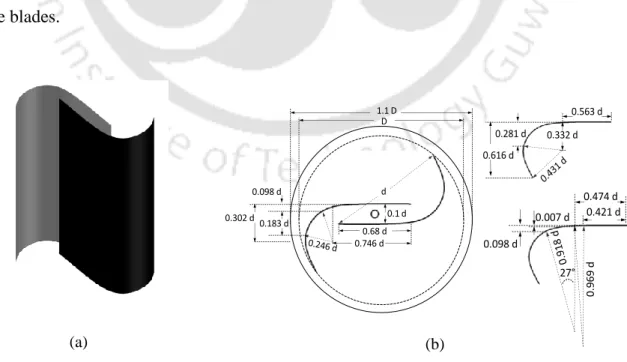
- Development of new blade profile
- Description of blade profiles
- Analysis of performance characteristics
- Analysis of starting characteristics
- Effect of oriented flows
- Orientation of the deflectors
- Newly developed SSWT under orientated flows
- Summary
The torque and power characteristics of the newly developed SSWT are shown in Figures 7.4 and 7.5. The performance gain of the newly developed SSWT over conventional, semi-elliptical and Benesh type turbines is found to be 3.8% respectively. Conventional with deflector Modified Bach with deflector Newly developed with deflector V= 6.2 m/s. Chapter 7 Development and analysis of the newly developed SSWT.
On the contrary, as the wind speed increases, the initial performance index, i.e., the static torque coefficient increases regardless of the magnitude of the wind speed.
3D Unsteady Simulations
C HAPTER –8
- Computational methodology
- Performance analysis
- Flow analysis
- Summary
The low-velocity region downstream of the newly developed SSWT is much smaller. Thus, a smaller contribution to the lift force is expected for the Benesh type and conventional SSWTs. a) Newly developed SSWT (b) Modified Bach type SSWT. However, for the newly developed and modified Bach-type SSWTs, this adverse effect is much smaller. a) Newly developed SSWT (b) Modified Bach type SSWT.
However, it is much less in newly developed and modified Bach-type SSWTs.
Economic Analysis
C HAPTER –9
- Wind energy conversion system
- Overall efficiency of a WECS
- Payback period of a WECS
- Summary
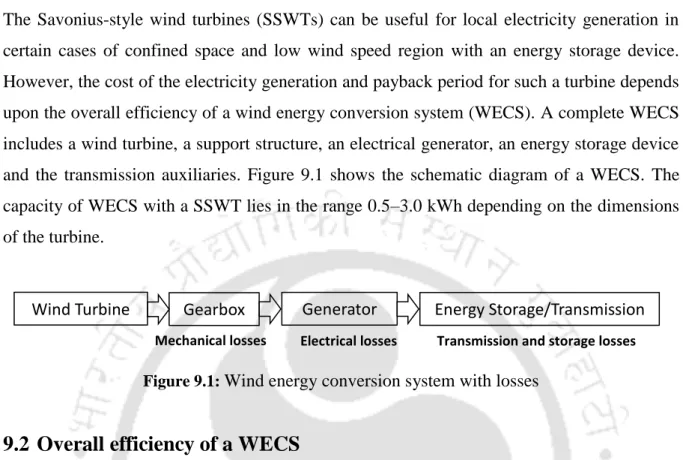
The capacity of WECS with a SSWT lies in the range 0.5–3.0 kWh, depending on the dimensions of the turbine. Now considering CPmax of SSWTs as the turbine efficiency (ηT), ηG = 80% (a more commonly found efficiency), and ηTS = 70% (considering a maximum loss), the overall efficiency is of the WECS with the newly developed blade is estimated at 17.4%. The overall efficiency and the payback periods for a wind energy conversion system (WECS) are estimated for all the tested SSWTs taking into account the mechanical, electrical and storage transfer losses.
Thus, a 34.4% improvement in payback period can be achieved with the newly developed design compared to the conventional semi-circular design.
Conclusions and Future Scopes
C HAPTER –10
Contribution of the present work
- Wind tunnel blockage correction
- Experiments on conventional and Bach type SSWTs
- Experiments on the newly developed SSWT
- Economic assessment of a wind energy conversion system
Wind tunnel tests are performed on the newly developed SSWT, followed by its comparative analysis with other existing designs. Furthermore, to analyze the flow characteristics, 3D unsteady simulations are performed on the newly developed SSWT in comparison with the other tested designs. The performance of the newly developed SSWT is summarized below in comparison with modified Bach, Benesh, semi-elliptical and conventional semi-circular blade SSWTs.
The unsteady 3D simulations are performed on the newly developed SSWT and the obtained results are compared with the modified Bach, Benesh and conventional type SSWTs.
Application potential
The overall efficiency and payback periods for a wind energy conversion system (WECS) have been evaluated for newly developed, modified Bach, Benesh, semi-elliptical and conventional SSWTs considering mechanical, electrical and transmission losses. storage.
Scopes for future work
Abraham JP, Plourde BD, Mowry GS, Minkowycz WJ and Sparrow EM, (2012), Summary of Savonius wind turbine development and future applications for small-scale power generation, Journal of Renewable and Sustainable Energy, Vol. Akwa JV, Vielmo HA and Petry AP, (2012), Performance Review of Savonius Wind Turbines, Renewable and Sustainable Energy Reviews, Vol. Altan BD and Atilgan M, (2008), Experimental and Numerical Study on Efficiency Improvement of Savonius Wind Turbine, Energy Conversion and Management, Vol.
Altan BD and Atilgan M, (2010), The use of a curtain design to increase the performance level of a Savonius wind rotor, Renewable Energy, Vol.
Modi VJ and Fernando MSUK, (1989), On the performance of the Savonius wind turbine, ASME Journal of Solar Energy Engineering, Vol. Mojola OO, (1985), On the aerodynamic design of the Savonius wind turbine rotor, Journal of Wind Engineering and Industrial Aerodynamics, Vol. Saha UK and Rajkumar MJ, (2006), On the Performance Analysis of Twisted Blade Savonius Rotor, Renewable Energy, Vol.
Saha UK, Thotla S and Maity D, (2008), Optimal design configuration of Savonius rotor through wind tunnel experiments, Journal of Wind Engineering and Industrial Aerodynamics, Vol.
Turbulence Models
Standard k-ϵ model
Appendix-A
Realizable k-ϵ model
An immediate benefit of the realizable k-ε model is that it more accurately predicts the spreading rate of planar and round jets. The feasible k-ϵ model proposed by Shish et al. 1995) was intended to address these shortcomings of traditional k-ε models. This is due to the fact that the realizable k-ε model includes the effect of mean rotation in the determination of turbulent viscosity.
The difference between the realizable k-ϵ model and the standard k-ϵ model is that C is no longer constant.
Standard k-ω model
Shear-stress transport (SST) k-ω model
These features make the SST k-ω model more accurate and reliable for a wider class of flows (e.g. adverse pressure gradients, flow over airfoils, shock waves, rotational flows, etc.) than the standard k-ω model.
1 41tanhΦ
2 22tanhΦ
Roy S and Saha UK, (2013), Review of the numerical studies on the design and development of Savonius wind rotors. Roy S and Saha UK, (2014), Performance analysis of Savonius style wind turbines under concentrated and oriented jets. Roy S, and Saha UK, (2013), Studies on the effect of aspect ratios on the performance of Savonius rotors.
Roy S and Saha UK, (2012), A comparative analysis of turbulence models for simulating the flow around a vertical axis wind turbine.
List of Publications