CHAPTER 7 EVALUATION OF DAMAGE INDICES FOR RC BEAM-COLUMN CONNECTIONS
CHAPTER 9 SUMMARY AND CONCLUSIONS 270-275
ABSTRACT
Some researchers performed tests on beam-column connections without considering the effect of the size of the tested specimens. To investigate the effect of the load characteristic on the performance of the connections, three different load types were considered in this study.
LIST OF TABLES
LIST OF SYMBOLS AND ABBREVIATIONS
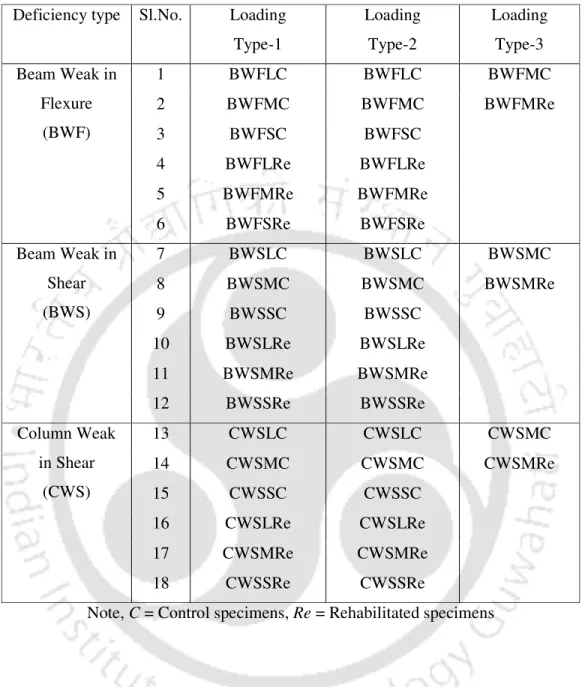
BWFLC Beam weak in flexion major control BWFMC Beam weak in flexion medium control BWFSC Beam weak in flexion minor control BWFLRe Beam weak in flexion major rehabilitated BWFMRe Beam weak in flexion medium rehabilitated BWFSRe Beam weak in flexion minor rehabilitated BWSLC Beam weak in shear major control. BWSMC Beam weak in shear medium control BWSSC Beam weak in shear small control BWSLRe Beam weak in shear large control rehabilitated BWSMRe Beam weak in shear medium rehabilitated BWSSRe Beam weak in shear small rehabilitated CWSLC Column weak in shear large control CWSMC Column weak in shear medium control CWSSC Column weak in shear small control CWSLRe Column weak in shear large rehabilitated CWSMRe Column weak in shear medium rehabilitated CWSSRe Column weak in shear small rehabilitated.
INTRODUCTION AND LITERATURE REVIEW
INTRODUCTION
- Preamble
- Beams-column joint and connection
- Forces on exterior beam-column connections
- Strong column-weak beam principle
- Ductility of RC structures
- Rehabilitation technologies
- Size effect law
- Damage indices
- Fragility functions
However, the effectiveness of the above rehabilitation/strengthening technique depends on the treatment given to the cracked concrete in the damaged region. Removal and replacement of damaged concrete in a component may be required if the earthquake loading on the joint is severe.
LITERATURE REVIEW
- Experimental studies on RC beam-column joints and connections
- Rehabilitation / strengthening of damaged RC beam-column joints and connections
- Concrete Jacketing
- Steel Jacketing
- Epoxy Repairing
- Fiber reinforced polymer (FRP)
- Size effect of concrete structural element
- Seismic damage indices for RC structures
- Local damage indices
- Global damage indices
- Development of fragility functions
The authors found that the joints of the specimens were not sufficiently strengthened against large shear stresses at inelastic load conditions. The authors concluded that the increased axial load leads to major deterioration of the joints. The author concluded that the performance of specimens repaired with epoxy injection is dependent on the quality of the injection job.
Finally, this led to improved damage type compared to the damage modes of the original specimens. The figure shows that the compressive strength decreases as the diameter of the test specimen increases, supporting the size effect. It is defined as the ratio of the maximum displacement (Δu ) carried by the structures and its yield displacement (Δy).
SCOPE AND OBJECTIVE OF THE PRESENT STUDY
A study of the size effect of RC beam-to-column connections with and without retrofitting was carried out. To carry out experimental studies on different types of defective RC connections of external beams and columns under cyclic loading. Rehabilitate damaged AB beam-column connections using different remediation strategies depending on the extent of damage.
To develop fragility functions for both control and rehabilitated external RC beam-column connections using different probabilistic distribution models.
ORGANIZATION OF THE THESIS
Evaluate damage indices of RC beam-column connections using the damage index model of Park and Ang (1985) and then use it to determine the effectiveness of the applied rehabilitation techniques. This chapter also presents guidance for identifying an appropriate rehabilitation strategy during the post-disaster period. Furthermore, comparisons are also made with the developed fragility functions to quantify the vulnerability of rehabilitated RC beam-column connections.
Further, some identified issues are also recommended as goals for future research on the current topic.
CONCLUDING REMARKS
For convenience, the literature has been classified into five different classes, namely (i) Experimental studies on AB beam-column joints and connections (ii) Rehabilitation/strengthening of damaged AB beam-column joints and connections with concrete jacket, steel jacket, epoxy repair and FRP wrap (iii) Size effect of concrete structural elements (iv) Damage indices on AB structures (v) Development of fragility functions. Based on detailed literature studies and identification of various shortcomings and inadequacies of previous studies, the scope and objectives of this study were finally listed.
MATERIAL CHARACTERIZATION, TEST ARRANGEMENT AND LOADING CHARACTERISTICS
INTRODUCTION
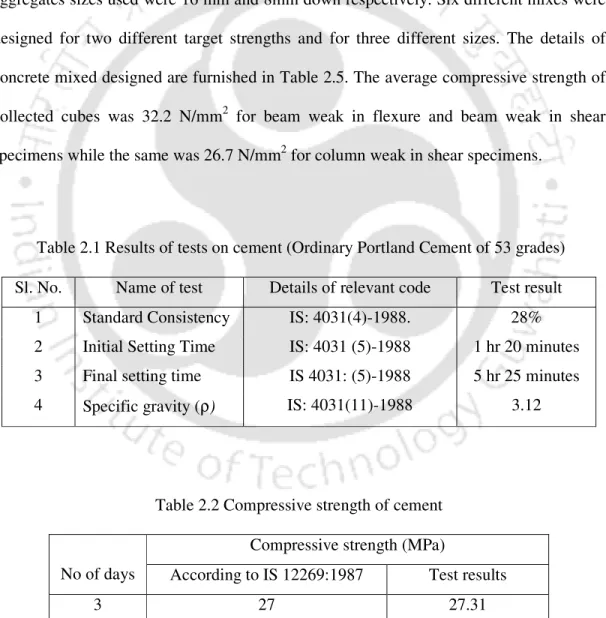
MATERIAL CHARACTERIZATIONS
- Materials for casting of control specimens
- Materials / equipment for rehabilitation of damaged specimens
The materials used to repair the damaged control specimens are low-viscosity epoxy resin (Conbextra EP10), microconcrete (Renderoc RG), concrete binder (Nitobond EP) and sealing material (Nitocote VF). Additionally, an injection pump (hand operated) and injection packs manufactured by WEBAC Chemie GmbH (Germany) were used to inject epoxy resin into the cracked zone. The properties of materials, their uses and equipment specifications are listed here. a) High strength epoxy resin (Conbextra EP10).
High Strength Epoxy Resin is a solvent-free resin mortar designed for grouting crack widths from 0.25 to 10 mm.
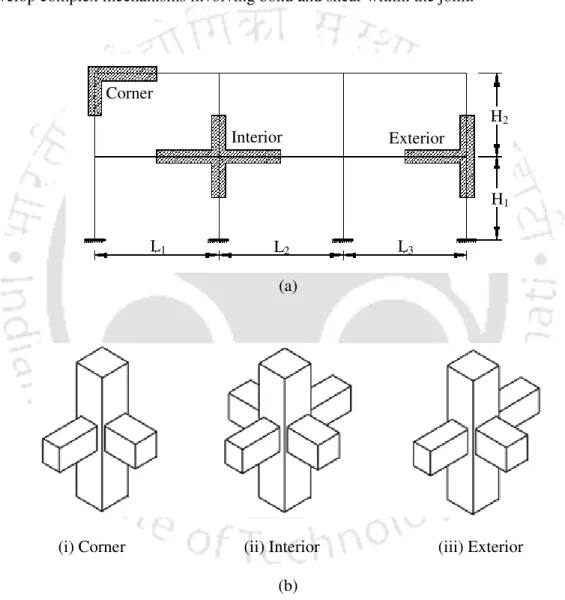
SELECTION OF FULL SCALE SPECIMEN
The pump used in the repair work was a manually operated pump suitable for injecting low-viscosity resins up to an injection pressure of 100 bar. Injection packers are filler holes used as connectors between the injection device and the building component when repairing cracks. Zerkhead fittings at the top of the injection packer provide the connection to the injection device.
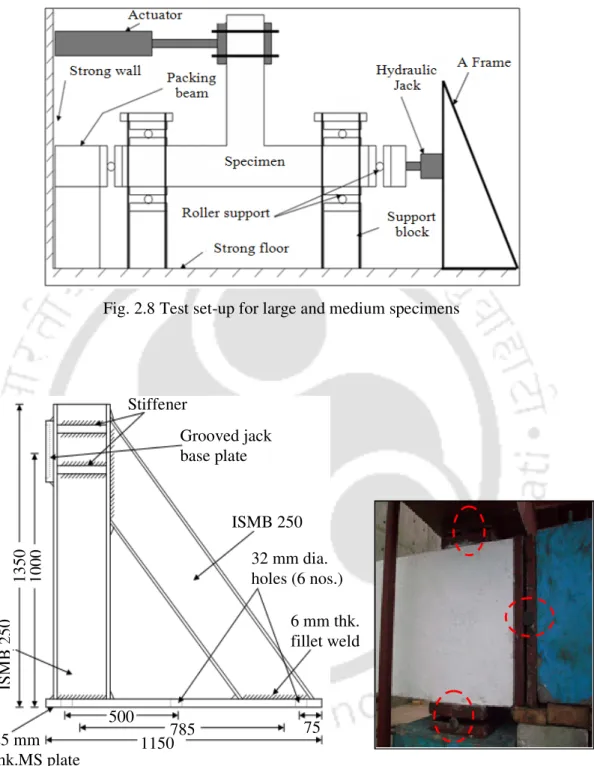
In this figure, hc is the floor height, lb is the half span of the beam, corresponding to the length of the beam connected to the selected connection, N is the internal axial force of the column, P is the load on the end of the beam , Vcol is the column shear force and ∆ is the vertical displacement of the beam tip.
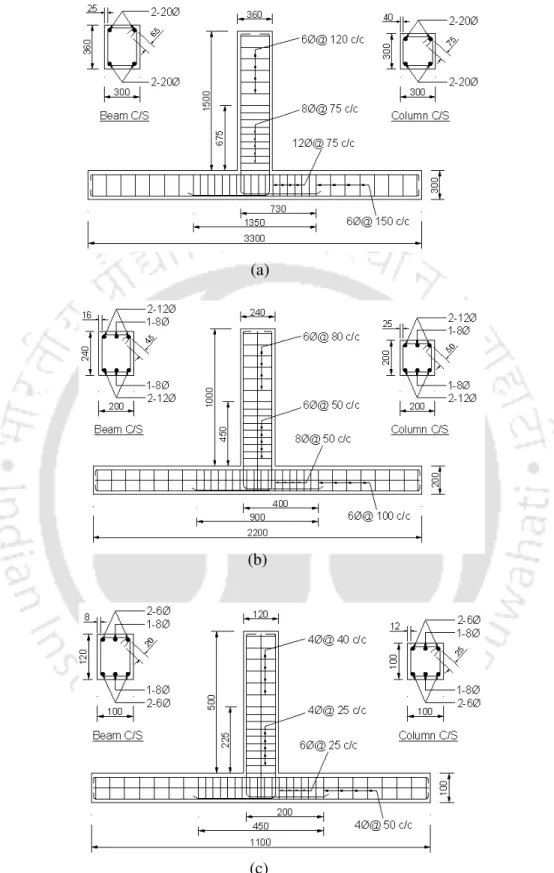
DESCRIPTION OF SPECIMENS
- Beam Weak in Flexure: Control Specimen
- Beam Weak in Shear: Control Specimen
- Column Weak in Shear: Control Specimen
In this category, the specimens were completely similar in all respects to the specimens with weak beam bending: control specimens, except for the shear reinforcement in the beams. In this category, specimens with a relatively lower level of concrete than those used in the previous cases were cast to weaken the shear column. The column cross-section was reduced as in previous cases, while the beam cross-section was increased to make the beam-column connections strong beam-weak column.
Beam weak in shear specimens have the same dimensions and longitudinal reinforcement as that of beam weak in flexural specimens except the shear reinforcement provided in beam.

TEST SET-UP AND LOADING CHARACTERISTICS
- Test set-up and instrumentations
- Loading characteristics
The displacement amplitudes were increased after completion of three cycles in each of the amplitudes. The majority of tests performed for RC beam-column connections are of a quasi-static nature. The amplitudes of the displacement histories reported by Choudhury [2010] were adopted in this study.
Amplitude of the displacement history was scaled for two-thirds and one-third models, respectively.
REHABILITATIONS METHODOLOGY
All rehabilitated specimens were retested with the same loading sequence as applied to the control specimens. However, the control specimens were subjected to a slightly lower rate of ultimate drift, as failure occurred earlier compared to that of the repaired specimens. The repair method was adopted to rehabilitate all damaged specimens under Type 2 loading, BWFM and CWSM specimens under Type 3 loading.
All samples under loading type-1 and BWSM sample under loading type-3 were rehabilitated by this recovery method.
CRACKS MEASUREMENT AND ASSESSMENT OF SPECIMENS USING ULTRASONIC PULSE VELOCITY TESTING
Guidelines regarding qualitative assessment of concrete quality based on UPV test were adopted as per IS: 13311 (Part I)-1992.
CONCLUDING REMARKS
STUDY ON REHABILITATED RC BEAM-COLUMN CONNECTIONS WITH BEAM WEAK IN FLEXURE
INTRODUCTION
TESTING OF LARGE SIZE CONNECTIONS
- Behaviour of connections under loading type-1
- Behaviour of connections under loading type -2
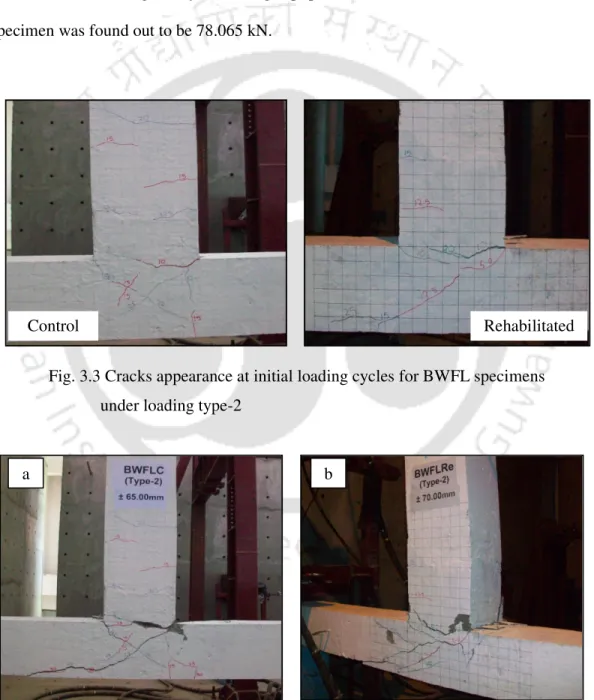
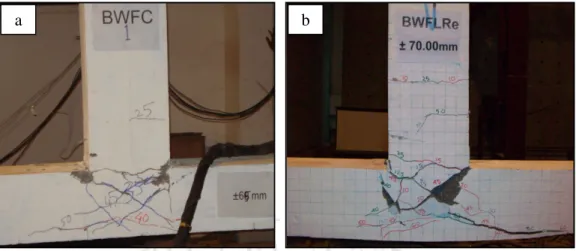
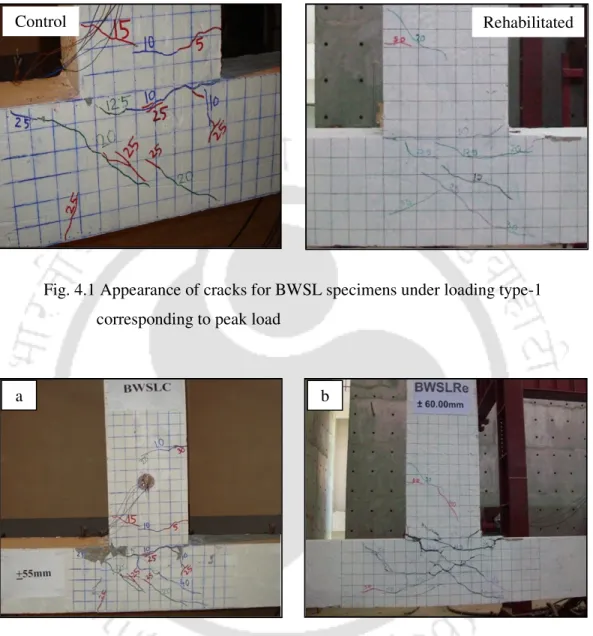
However, there was no spatter of concrete at the joint area even at a displacement of ±55 mm for the control specimen. However, at a displacement of ±55 mm, slight crushing of concrete was observed at the joint area for the rehabilitated specimen. The experiment on control specimen was stopped at the same displacement level of ±65 mm as in the case of loading type-1 for the control specimen.
At this displacement amplitude, crack width of approximately 5 mm was observed at the joint region for the control specimen.
TESTING OF MEDIUM SIZE CONNECTIONS
- Behaviour of connections under loading type-1
- Behaviour of connections under loading type -2
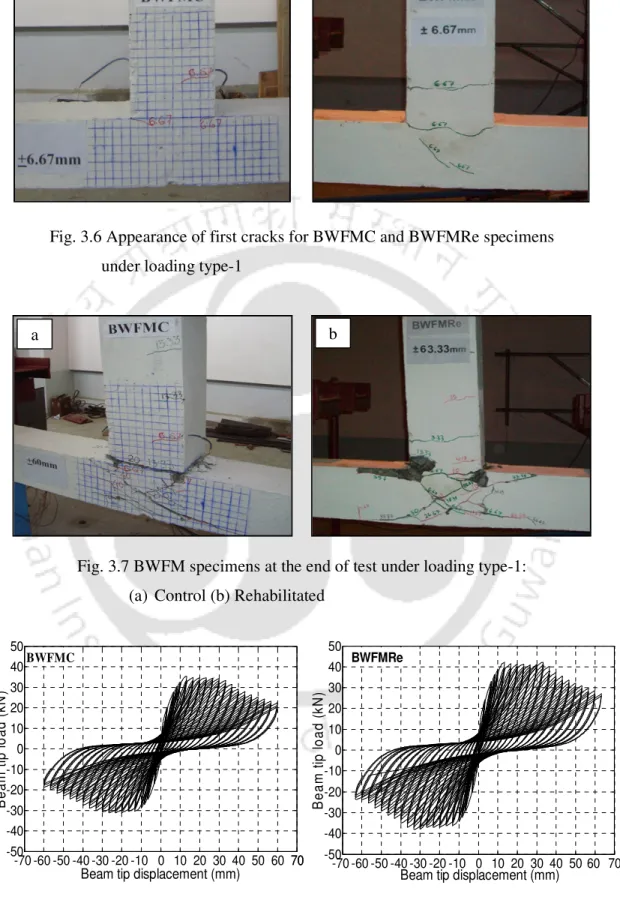
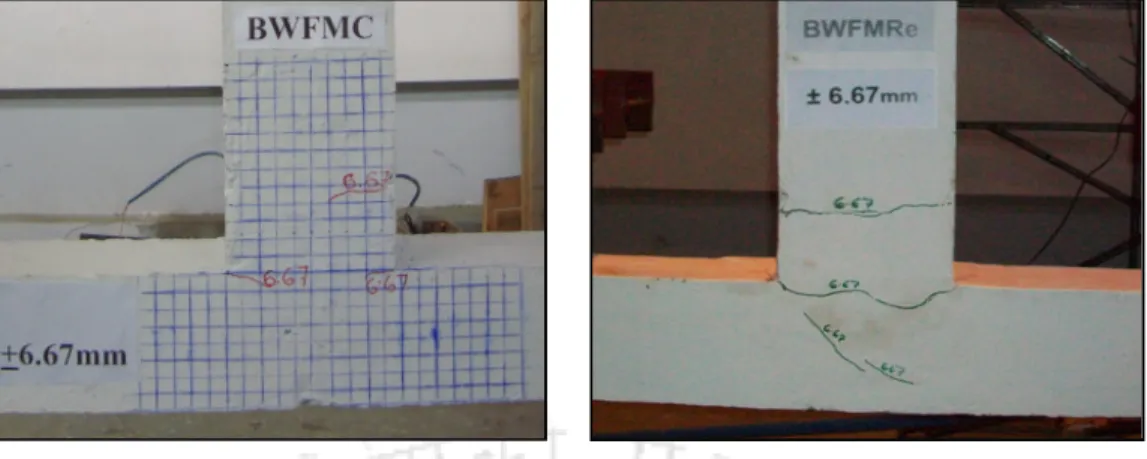
The crack patterns in the joint region were generally similar in both samples at the end of the experiment. At a displacement of ±30 mm, a wide crack was observed in the joint area and the joint face of the control sample, and a certain crack from the joint area started to propagate to the column section. However, in the rehabilitated specimen, the cracks were mainly concentrated at the beam-column interface and on the beam portion.
The experiment was stopped at the same displacement level of ±60 mm for BWFMC and ±63.33 mm for BWFMRe.
TESTING OF SMALL SIZE CONNECTIONS
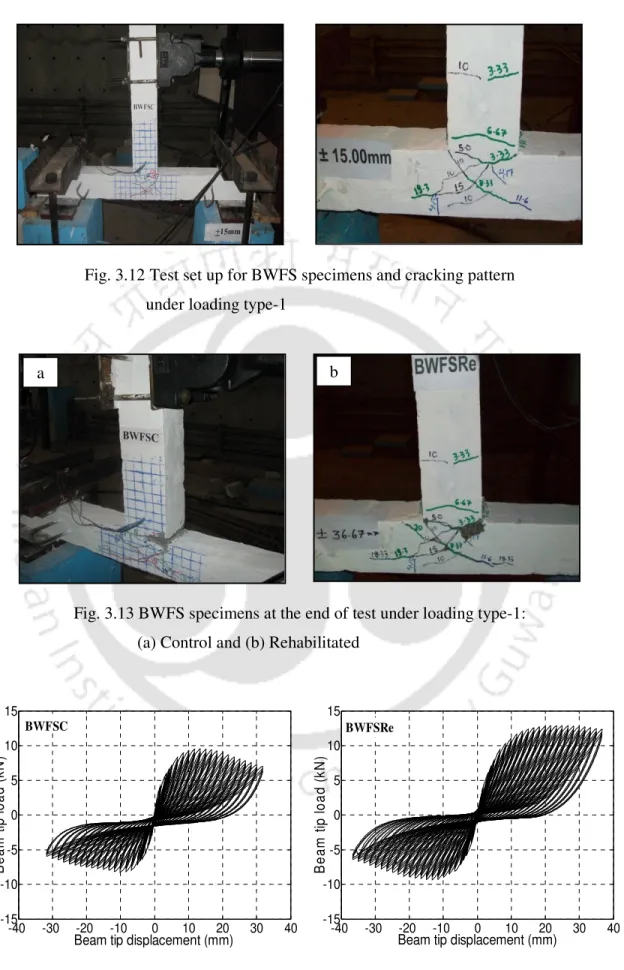
- Behaviour of connections under loading type-1
- Behaviour of connections under loading type-2
At the end of the experiment, a crack width of 3 mm was observed in the joint area in both the control and repaired samples. The X-shaped crack in the contact area started to propagate toward the column portion when it reached a displacement of ±11.67 mm for the control specimen and ±13.33 mm for the repaired specimen. At a displacement of ± 30 mm, no concrete spalling was observed in the joint area and joint interface.
At the end of the test, cracks of comparable size and pattern were observed in both control and rehabilitated specimens.
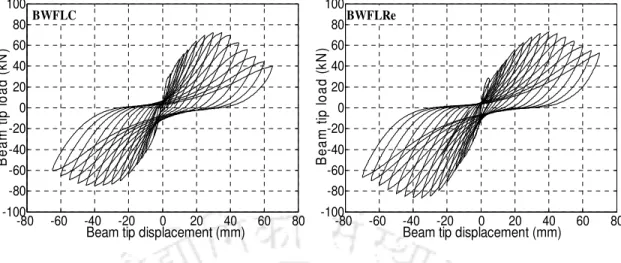
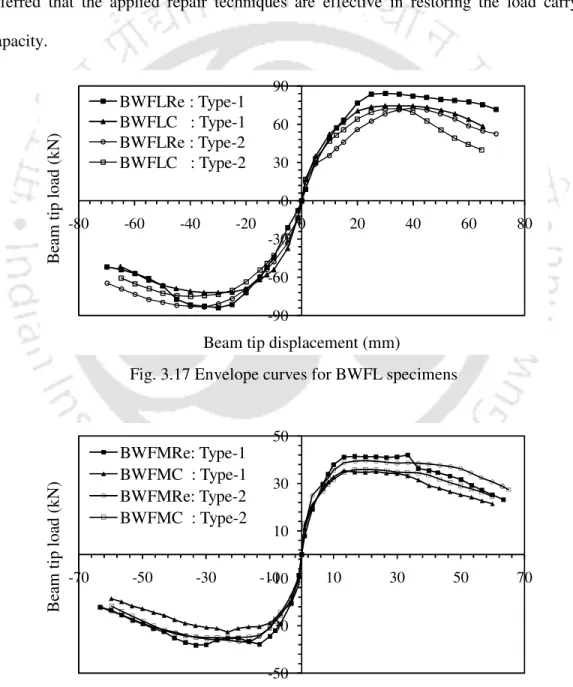
COMPARISON OF TEST RESULTS OF CONTROL AND REHABILITATED SPECIMENS
At the same drift angle of 0.37 %, the reduction in stiffness for the rehabilitated specimen was found to be 20.60. Similarly, variation of stiffness with drift angle for both control and the rehabilitated large size specimens under loading type-2 is shown in Fig. The variation of stiffness with drift angle for BWFMC and BWFMRe specimens under loading type-1 is shown in Fig.
The plots of cumulative energy dissipation versus drive angle for control as well as rehabilitated samples are shown in Fig.
INVESTIGATION FOR THE EXISTENCE OF SIZE EFFECT
- Bi-logarithmic plot
- Size effect on energy dissipated per unit volume of D-region
- Size effect on stress variation with relative deflection
Using these values, the bilogarithmic graph was drawn with log (D/D0) on the X-axis and log( t/). The bilogarithmic graphs were drawn considering all six data, regardless of load types. The cumulative energy dissipated per unit volume of the D region (eN) was calculated for all samples.
The estimated relative deflection and stresses were plotted for the control and rehabilitated specimens with type-1 loading in Figure 1.
CONCLUDING REMARKS
STUDY ON REHABILITATED RC BEAM-COLUMN CONNECTIONS WITH BEAM WEAK IN SHEAR
INTRODUCTION
TESTING OF LARGE SIZE CONNECTIONS
- Behaviour of connections under loading type-1
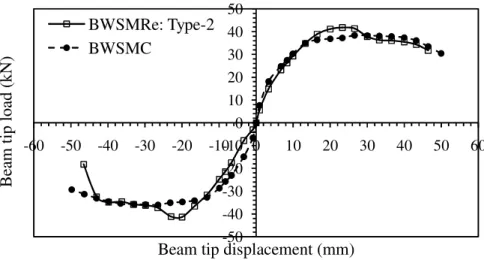
- Behaviour of connections under loading type-2
A wide crack with a width of about 6 mm was clearly visible on the joint surface of the specimen at a displacement amplitude of ± 55 mm. In the rehabilitated specimen, fine hairline cracks in the joint area expanded to approximately 1 mm in width at a displacement of ±35 mm. The existing crack width at the joint interface widened to approximately 3 mm when a displacement of ±50 mm was achieved.
At the end of the test, a crack width of approx. 5 mm at the joint interface in both control and rehabilitated specimens.
TESTING OF MEDIUM SIZE CONNECTIONS
- Behaviour of connections under loading type-1
- Behaviour of connections under loading type-2
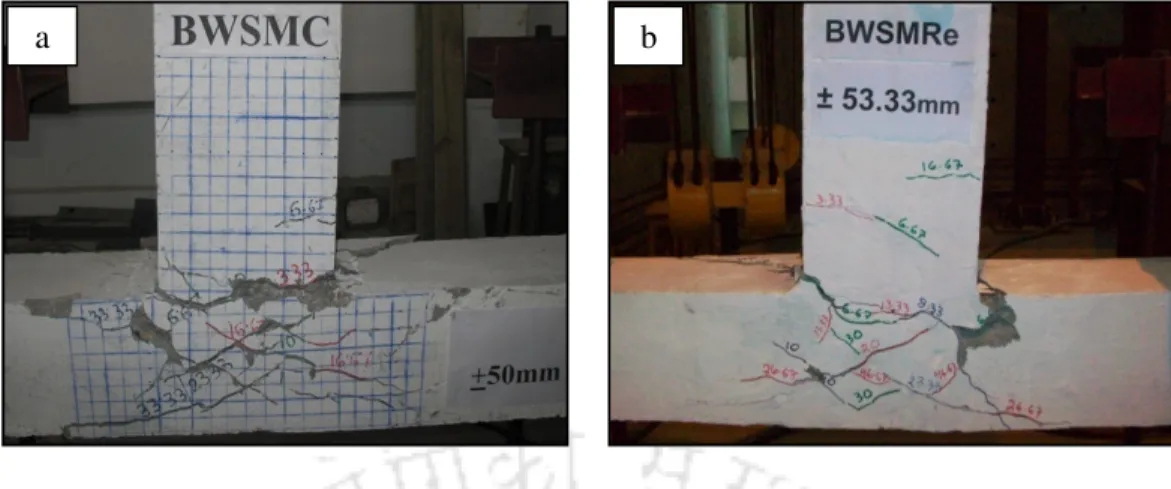
A crack width of about 2 mm was observed in the joint region with a displacement of ±26.67 mm. With the same displacement of ±36.67 mm, the splitting of the concrete at the edges of the joint has also started. A wide crack at the joint interface became detectable causing the specimen to fail at a displacement of ±50 mm.
Spalling of concrete at the joint surface for the control sample was observed at a displacement of ± 30 mm.
TESTING OF SMALL SIZE CONNECTIONS
- Behaviour of connections under loading type-1
- Behaviour of connections under loading type-2
Spalling of concrete also started at the joint interface with the same amplitude of ±20 mm. At the same stage where the experiment was stopped for control samples, rehabilitated sample was observed to achieve the original bearing capacity. The initial developed cracks at the joint interface for control specimens widened when they reached a displacement of ±11.67 mm with more cracks occurring in the joint area.
Rehabilitated specimen developed fine cracks at the joint interface and beam part during the initial loading cycles.
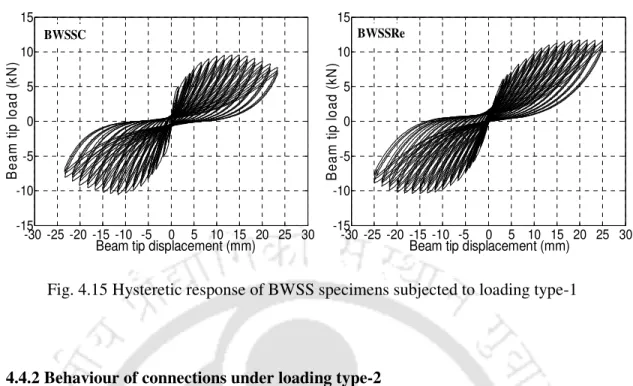
COMPARISON OF TEST RESULTS OF CONTROL AND REHABILITATED SPECIMENS
Variations in energy dissipation versus drift angle for both control and rehabilitated specimens are shown in Figure. Table 4.3 shows that the energy dissipated by the rehabilitated specimens is almost equivalent to that of the corresponding control specimens. The displacement ductility achieved by the rehabilitated specimens under type 1 loading is found to be marginally higher than that of the control specimens.
However, rehabilitated specimens (medium and small) under loading type 2 could not achieve their ductility values as good as their control specimens.
INVESTIGATION FOR THE EXISTENCE OF SIZE EFFECT
- Bi-logarithmic Plot Ultimate shear stress
- Size effect on energy dissipated per unit volume of D-region
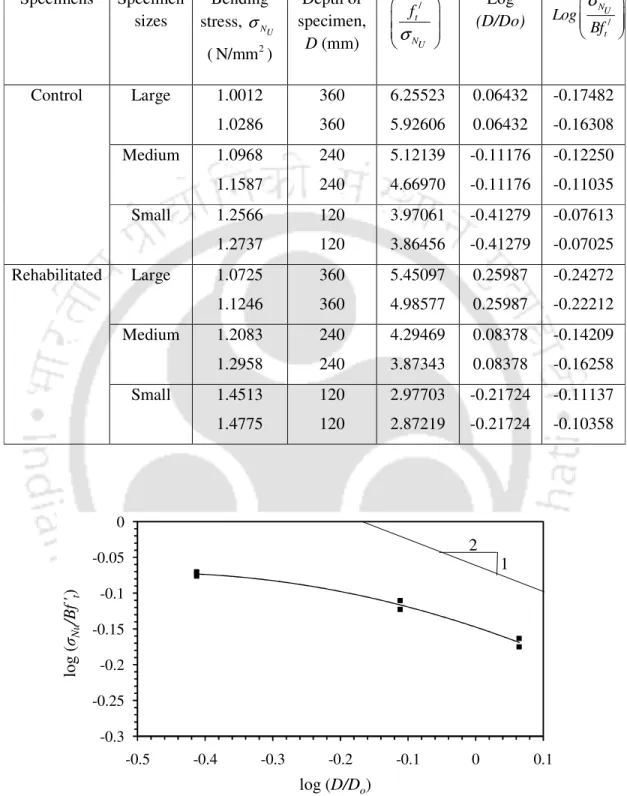
- Size effect on stress variation with relative deflection
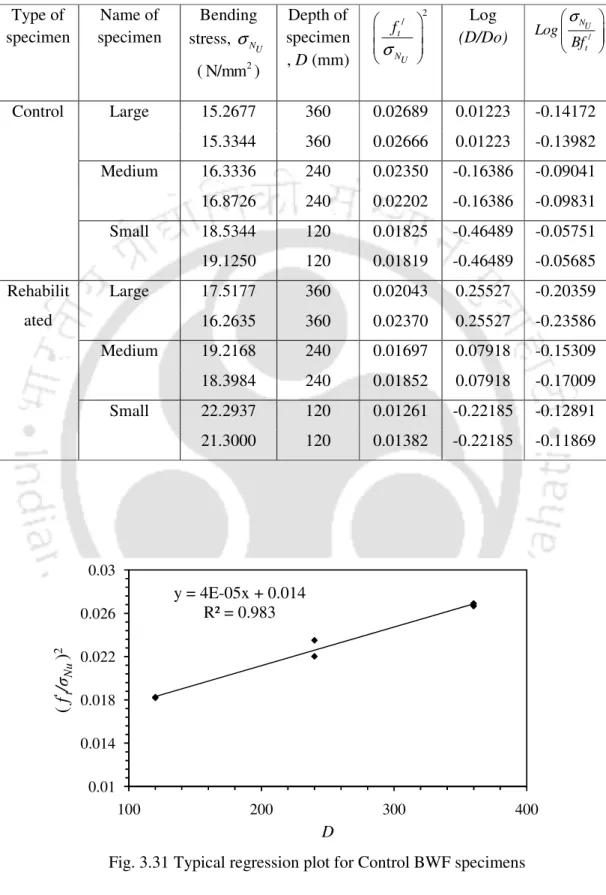
The voltage and the calculation of other parameters necessary to perform regression analysis and to draw a bilogarithmic plot for both control as well as rehabilitated samples are given in Table 4.5. Finally, bilogarithmic plots were drawn for control and rehabilitated samples as shown in Fig. It is observed that both plots show the presence of size effect and substantiate Bažant's size effect law.
Thus, it is observed that during cyclic loading, the smaller specimens dissipated more energy per unit volume of the D region compared to the larger specimens, which is an indication for the existence of the size effect.
![Fig. 1.3 Free body diagram of exterior beam-column connections [Paulay, 1989]](https://thumb-ap.123doks.com/thumbv2/azpdfnet/10490143.0/43.918.190.750.95.553/fig-free-body-diagram-exterior-column-connections-paulay.webp)
![Fig. 1.4 Typical load-displacement relationship for RC ductile element [Paulay and Priestley, 1992]](https://thumb-ap.123doks.com/thumbv2/azpdfnet/10490143.0/45.918.181.755.218.617/fig-typical-displacement-relationship-ductile-element-paulay-priestley.webp)
![Fig. 1.8 (a) Typical fragility functions (b) Evaluating individual damage-state probabilities [Porter et al., 2007a]](https://thumb-ap.123doks.com/thumbv2/azpdfnet/10490143.0/54.918.175.786.569.919/typical-fragility-functions-evaluating-individual-damage-probabilities-porter.webp)