The thermal power of the investigated compounds is found to be higher compared to the TE chalcopyrite prototype materials, together with comparable values for electrical conductivity. In the final results chapter, we address the electronic and TE properties of some transition metal dichalcogenides, which are less explored.
Constituent parameters involved in figure of merit
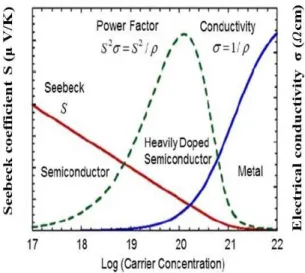
- Seebeck coefficient (Thermopower)
- Electrical conductivity
- Thermal conductivity
- Methods of tuning the parameters
Regarding the optimal ZT, several concepts have been discussed on improving the power factor and suppressing the thermal conductivity. To improve the ZT, one can focus on the power factor or reduce the thermal conductivity of the grid.
The journey of thermoelectric materials
Alloying of solid materials generally shows the reduction of lattice thermal conductivity without reducing electrical conductivity, and the Bi2Te3 family of compounds has been well investigated for this purpose [31, 19]. A glassy thermal conductivity is reported for these compounds, which became the main attraction for thermoelectric applications.
Applications of thermoelectric materials
Disadvantages of thermoelectric materials
Overview of the thesis
Born-Oppenheimer approximation
Due to the enormous number of interacting particles in a system (around 1023), the exact solution for the SE mentioned above will be difficult. The idea behind this approach was the huge mass difference between the electron and the ion, and the motion of the ions will be much smaller compared to the motion of electrons [98].
Hartree approximation
Hartree-Fock approximation
A reasonable solution to this problem requires several approximations, which are discussed accordingly in the following sections. The inclusion of the antisymmetric nature of the interacting particle results in an additional term in the total energy calculations known as the exchange energy.
Introduction to density functional theory
Thomas-Fermi theory
The expression of kinetic energy in this model is only developed for a homogeneous system, and the total energy of the system can be written as follows. Thomas-Fermi has taken the first step to reduce the complexity of the many-body Hamiltonian by replacing the wave function with electron density, which is a crude way of approximating the kinetic energy term alone.
Hohenberg-Kohn theorems
They considered a homogeneous electron gas and imposed classical interaction terms for electrons, which was a shortcoming of the theory, but they contributed the excellent idea of replacing the wave function with the electron density.
Kohn-Sham method
Exchange-correlation functionals
The local-density approximation (LDA)
To achieve a sensible solution to the many-body problem, Kohn and Sham in 1965 proposed an approach for exchange-correlation functionals known as local density approximation[100]. Hereǫhomxc is exchange-correlation energy per particle of the interacting homogeneous electron gas of density(r).
The generalised gradient approximation (GGA)
GGA could not provide the band gap of semiconductor, which is important for transport calculations. In the next section, we discuss a convenient method, which predicts an improved band gap over LDA and GGA.
Tran-Blaha modified Becke-Johnson potential (TB-mBJ)
Methods
Linearized Augmented Plane Wave (LAPW) Method
The APW method is very slow due to the unknown energy parameter included in the radial part of the wave function. The accuracy of this method is similar to the LAPW method, and the advantage of this method is the small basis set as the APW method.
Pseudopotential method
From the above equation, it is evident that both APW and LAPW share the same base set in the case of the interstitial region. Inclusion of (non)local orbitals in the linearization of the APW method is another method to improve the solutions.
Z 2 topological invariant: Method of calculations
Time Reversal Symmetry
Z 2 topological invariant
In the present thesis, we have used the pseudopotential method to evaluate the structural optimization and phonon dispersion calculations as implemented in the PWSCF [116] code.
Surface states
Boltzmann transport theory: Method to calculate the thermoelectric properties
Constant Relaxation Time Approximation
Consider at time t =0 that both external field and temperature gradient perturbations are turned off, the change in the electron distribution function will be due to collision only, and the relaxation time is defined as the characteristic time for a system to return to its equilibrium state.
Rigid band Approximation
Computational Details
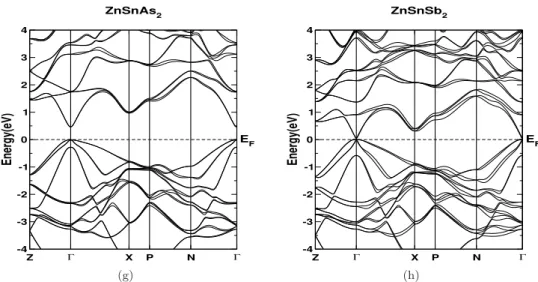
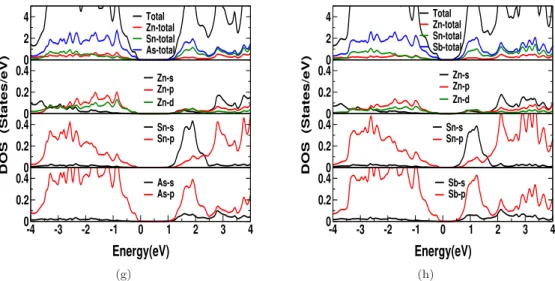
We present a detailed first principles study of electronic and TE properties of Zn-based pnictide series in this chapter. The TE applications of these compounds are less studied, although the prototype compounds have shown good TE properties.
Computational details
Massless and massive Dirac fermions are observed in Dirac materials themselves, and graphene has massless Dirac fermions, and a compound such as Pb1−xSnxTe also has massive fermions [158], which is due to the small gap between the Dirac points. In this chapter, we analyzed the electronic and TE properties of ZnXPn2 (X:Si, Ge, Sb; Pn: P, As), ZnSiSb2, ZnGeSb2 and ZnSnSb2, as well as the influence of hydrostatic loading on the electronic structure and TE properties of ZnGeSb2. .
Results and discussion
Structural properties
We used 10 × 10 × 10 k-points in the full Brillouin zone for calculations of total energy, band structures, and density of states. The BoltzTraP code is based on the Rigid Band Approximation (RBA) and the Constant Scattering Time Approximation (CSTA), and these approximations have been successfully applied to several thermoelectric materials.
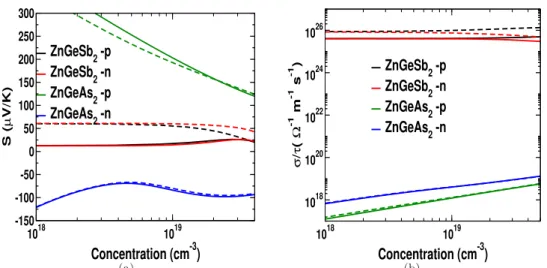
This shows that the electrical conductivity in the case of electron doping can slightly dominate that of hole doping for all investigated compounds. We observed a sharp increase in the density of states around the edge of the valence band for all compounds studied, and this trend is more pronounced in ZnXP2 compounds compared to "As" compounds.
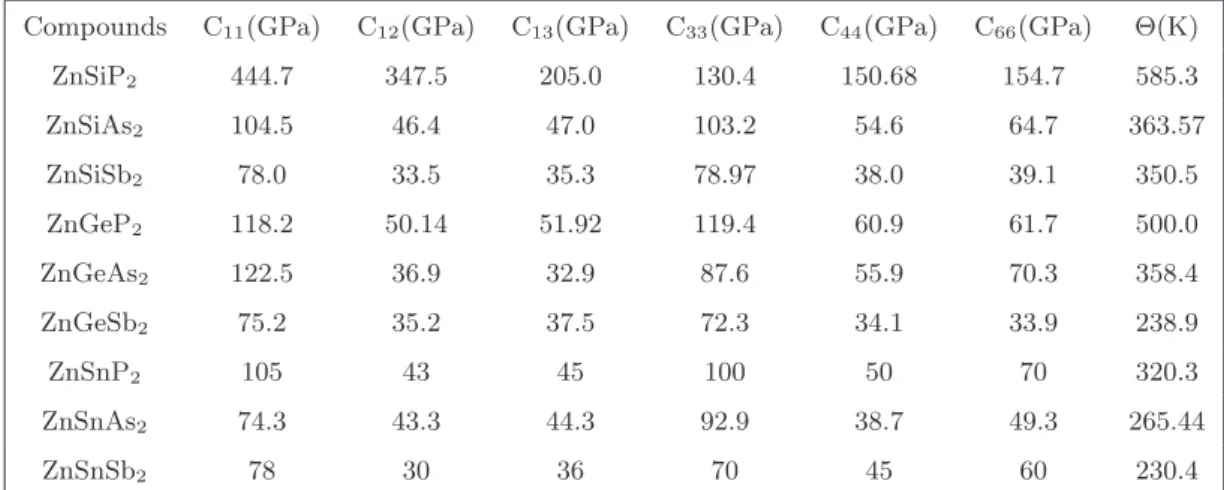
Another essential point to mention about the investigated compounds is that the reported thermal conductivity of the lattice is higher compared to other TE materials [180], which is evident from the Debye temperature values. If one can reduce the thermal conductivity of the lattice using certain techniques (such as superlattice, nanostructuring, etc.), all investigated compounds would be promising materials for TE applications.
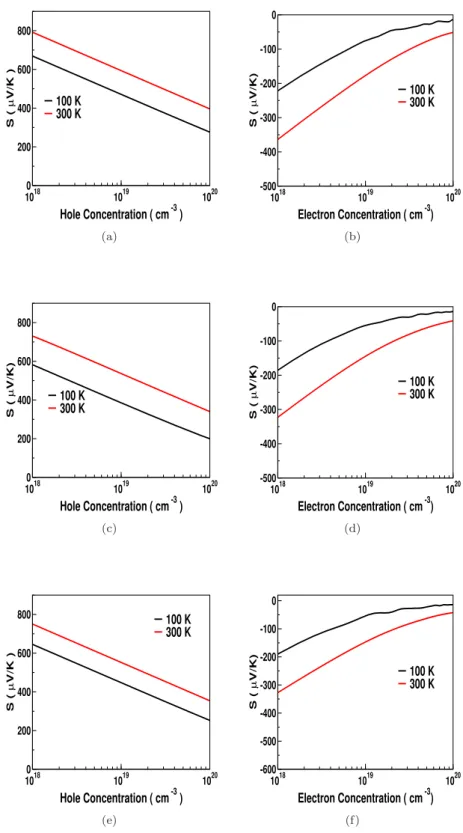
Electronic and thermoelectric properties of ZnGeSb 2 at ambient
Both the thermopower and electrical conductivity show an unusual response compared to conventional semiconductors, which also indicates a highly linearized dispersion in this compound. The carrier-independent nature of the thermopower and electrical conductivity of ZnGeSb2 opens up the possibility of using TE over a wide range of concentrations, which may attract experimentalists. The huge value of electrical conductivity in ZnGeSb2 will play a very crucial role in the thermoelectric properties of this compound, which will be discussed in the next section.
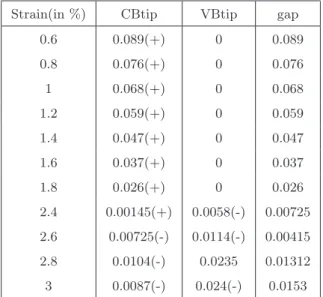
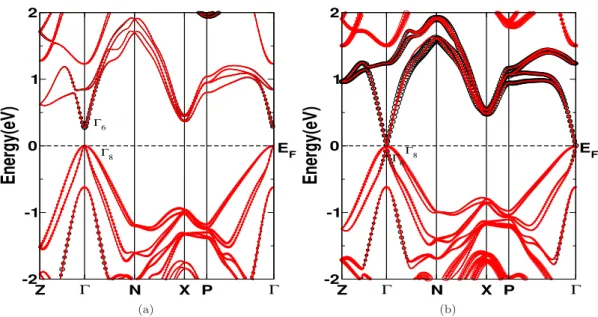
Electronic and thermoelectric properties of ZnGeSb 2 under strain
A huge power factor anisotropy is observed in the Dirac states, the 'c' axis is more favorable than the 'a' axis for optimized volume. In Figure 3.16(f) we compared the power factor of our examined connection to its huge Dirac. To estimate the power factor range (S2σ), which is independent of the relaxation time, we assumed a relaxation time of 1×10⁻¹⁴ s and 1×10⁻¹⁵ s, and calculated the electrical conductivity (σ) and power factor (S2σ) are given in Table 3.5.
Conclusions
The present chapter discusses the electronic structure, mechanical and TE properties of some superlattice materials that have high thermopower values together with the likelihood of low thermal conductivity. The possibility of low thermal conductivity is predicted from the obtained elastic constants and from the Slack model and the Cahill model. Despite these advantages of low thermal conductivity and high thermopower, the appeal of heterolayer TE system is very less due to practical difficulties.
Computational details
Results and discussions
Structural properties
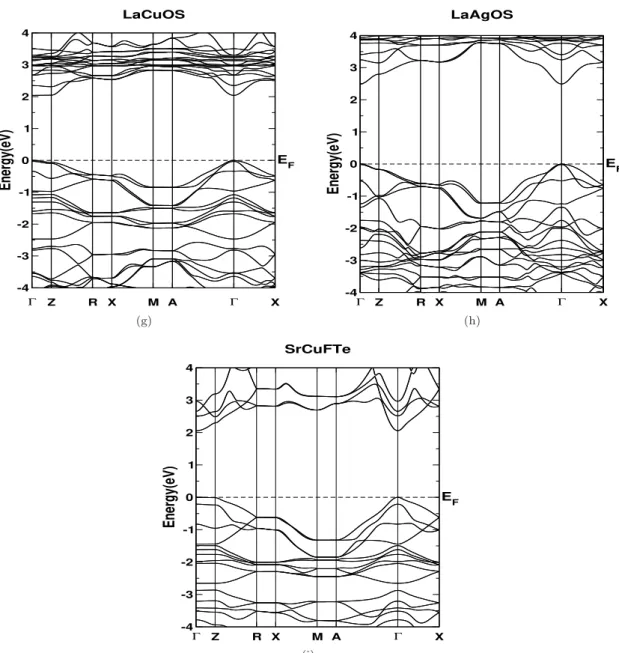
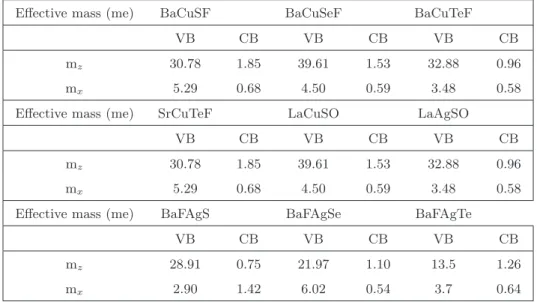
The enormous difference in the calculated effective mass confirms the quasi two-dimensional nature of the band structure and the values are given in Table 4.3. In the case of BaCuChF compounds, Cu-d states dominate in the valence band, while in the conduction band we can see the mixture of Ba-d and Cu-s states. For LaCuSO, Cu states are significant in the valence band, while La states dominate in the conduction band.
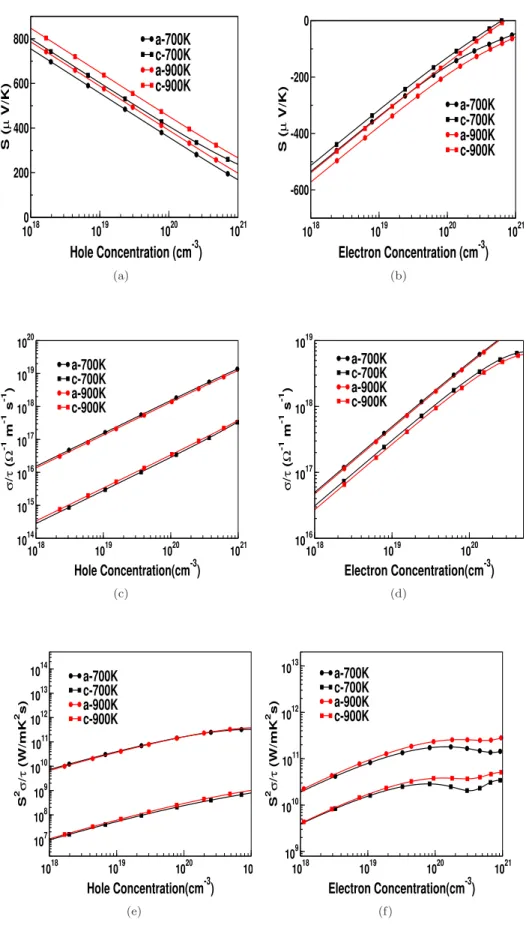
Thermoelectric properties
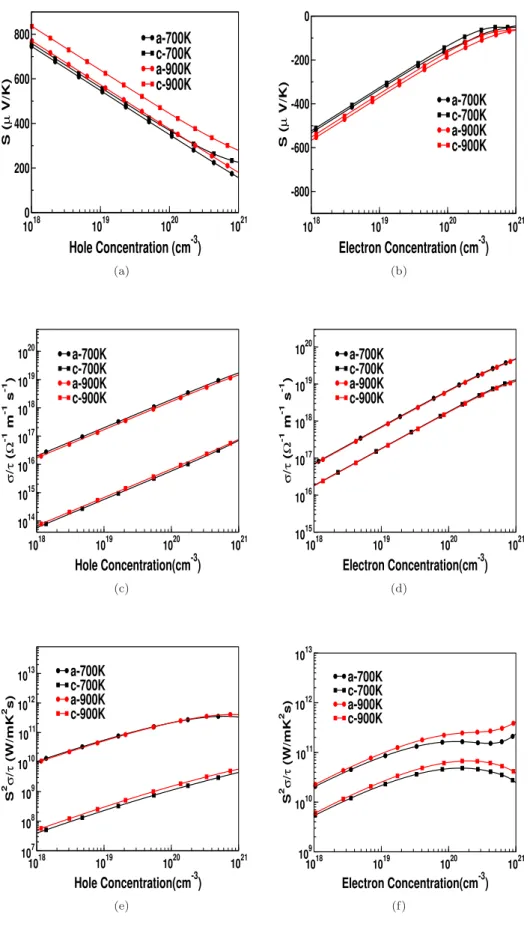
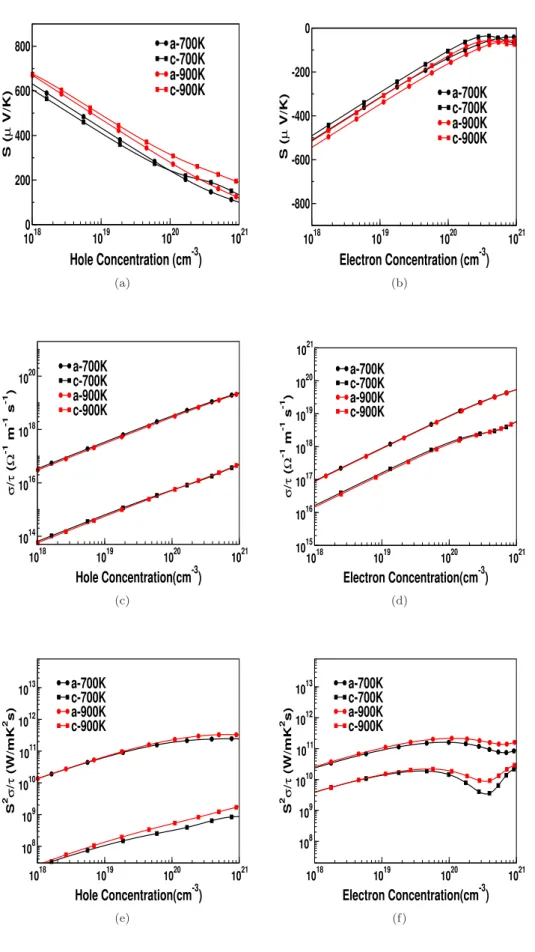
For all investigated compounds, the electrical conductivity is calculated for the concentration of electrons and holes. All studied compounds have almost similar behavior and for all investigated compounds we have presented the variation of electrical conductivity as a function of carrier concentration for the temperature range from 300 K to 900 K. As expected from the band structure, the electrical conductivity for holes is higher along the 'a' axis in compared to
Lattice dynamics
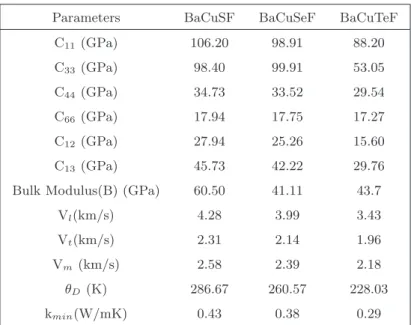
Calculated values of thermal conductivity of investigated compounds using Slack's equation are given in Table 4.7. Further, we have also related the anisotropy in the lattice thermal conductivity values by using Young's modulus. Furthermore, we can see the flat acoustic branches, which again indicate the low thermal conductivity of these connections.
Conclusions
We have crudely estimated the anisotropy in the thermal conductivity of lattices by comparing it with Young's modulus along different axes. The emergence of high power factor and low thermal conductivity can make these compounds suitable for better TE applications. The main appeal of these compounds is that they generally have a high melting point and low thermal conductivity.
Computational details
The improved band gap of investigated compounds was achieved with the help of Tran-Blaha modified Becke-Johnson (TB-mBJ) functional, since the exchange correlation functional such as local density approximation (LDA) and generalized gradient approximation (GGA) underestimate the band gap of semiconductors and insulators. The k-point mesh of 8×14×7 in the full Brillouin zone was used to study the electronic properties. The BoltzTraP code[169] was used to extract the thermoelectric coefficients including thermopower, electrical conductivity with dense k mesh.
Results and discussions
Properties at ambient conditions
In Table 5.2 we reported the bulk modulus and Debye temperature of all investigated compounds. We further calculated the surface states for all compounds and presented them in Figure 5.6. For all compounds, we study thermal power, electrical conductivity and power factor as a function of carrier concentration at different temperatures.
Effect of strain
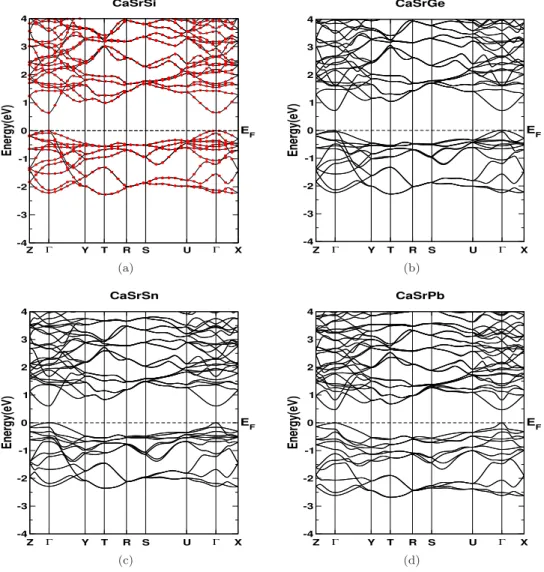
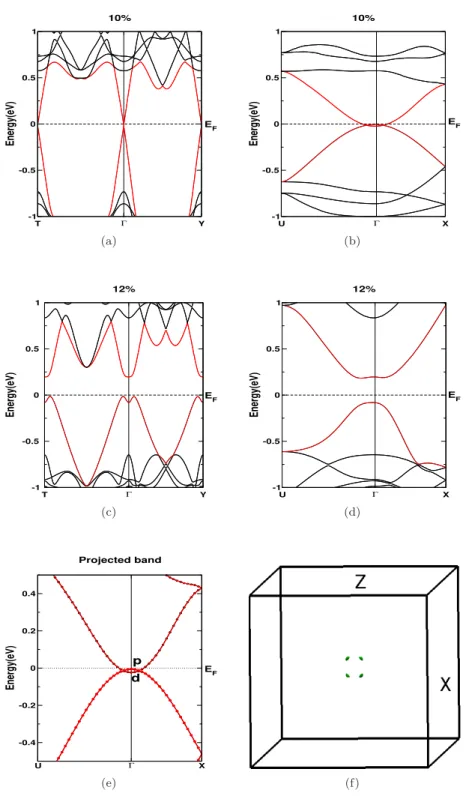
For compressive strain (uniaxial strain along the 'b' axis) of about 10% strain, the band gap is found to be closed and the system reverts to a semi-metallic state, and the Fermi surface formed in this state is very interesting (See Figure 5.12 (d)). The thermopower for CaSrSi as a function of carrier concentration at different hydrostatic stresses is shown in Figure 5.14 (a,b). Electrical conductivity for compressive stresses along the 'b' axis is found to increase the magnitude of anisotropy in the system (See Figure 5.15 (b)).
Conclusions
This chapter discusses the electronic and thermoelectric properties of some transition metal dichalcogenides that are less studied. However, Os-based dichalcogenides and dipnictides are less studied compared to other transition metal dichalcogenides (TMDs). ReS2 is one of the transition metal dichalcogenides that stands out with very unusual properties and has attracted due attention in the recent past.
Computational details
The presence of heavy elements in the investigated compounds justifies the inclusion of spin-orbit coupling in our calculations. Hydrostatic/uniaxial strain calculations were performed by changing the lattice parameters and we optimized the atomic position for each strained state. To understand the nesting of the Fermi surface in the tense state of ReS2, we calculated the real and imaginary parts of the Lindhard function using Wien2k output.
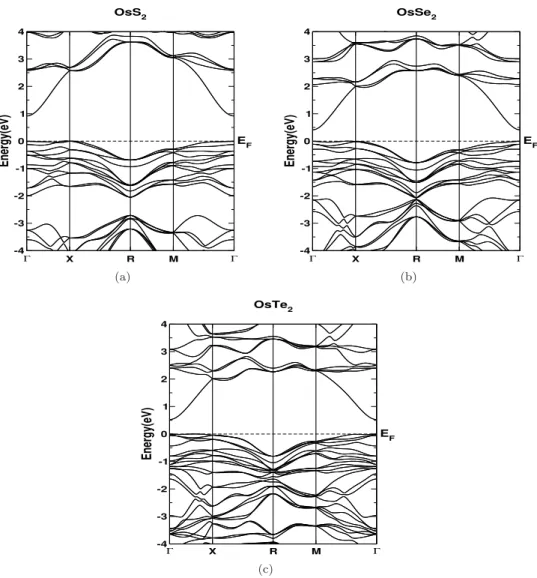
Results and discussions
In Figure 6.12 we have summarized the thermoelectric properties of ReS2 as a function of hole and electron doping. Similarly, we have calculated the thermoelectric properties of ReSe2 and present the same in Figure 6.13. Overall, the thermoelectric properties of the bulk and layered forms are found to be similar, implying layer-independent transport properties of ReS2.
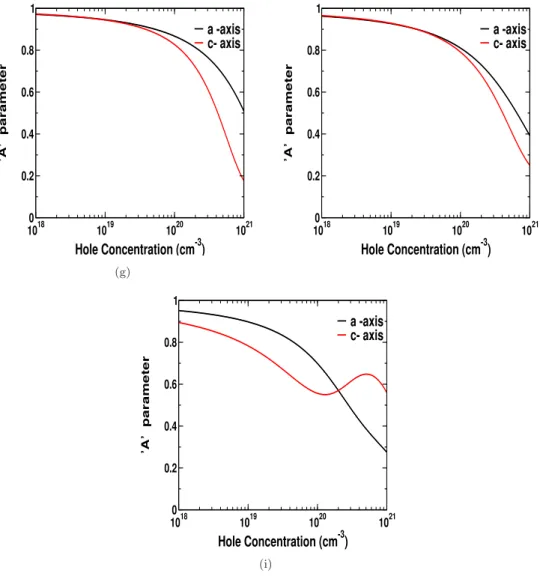
Furthermore, we have extended our analysis of thermoelectric properties of these materials by calculating a parameter. In the last chapter we have investigated the thermoelectric properties of a few transition metal dichalcogenides.
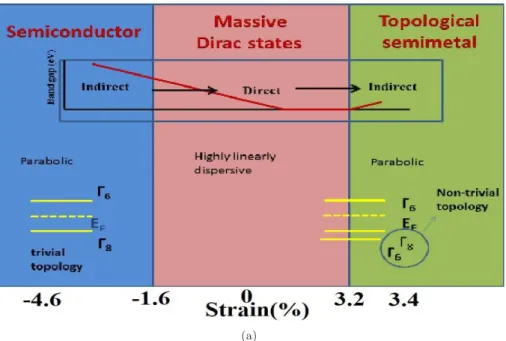
![Figure 3.17: Schematic of phase change and comparison with well established compounds, PbTe[214], Cd 3 As 2 [215], YPtBi[221]](https://thumb-ap.123doks.com/thumbv2/azpdfnet/10473945.0/73.892.162.768.124.528/figure-schematic-phase-change-comparison-established-compounds-yptbi.webp)