We introduce a tool that allows concerned decision makers to compare the savings from installing smart technologies with alternative investments that deliver returns of (say) r. For each user interface of the building, we create the time sequence of occupancy in different rooms. If smart technologies were installed, the devices would necessarily be turned off during the period the user remains out of the room.
Therefore, if smart technologies are installed, energy savings occur precisely in the intervals when the user leaves the room and forgets to turn off personal devices and lights. Consumers' energy awareness plays a major role in the issue of installing smart technologies to automate power consumption.
Problem Statement
Non-renewable energy is being depleted at an alarming rate these days, which is why it is imperative that we take effective measures to save as much energy as possible. An important area where a lot of energy is wasted is the electrical energy of households and offices. There are many ways to conserve non-renewable energy, including avoiding the consumption of energy when not in use, using a high-efficiency appliance to consume energy efficiently, and using alternative technology.
Among these methods, the easiest and most economical to reduce power consumption is to avoid power consumption when not in use. Smart homes today are equipped with smart lighting systems that automate the consumption of power, which includes turning off the power when not in use.
Related Work
Contribution of this thesis
Organization of thesis report
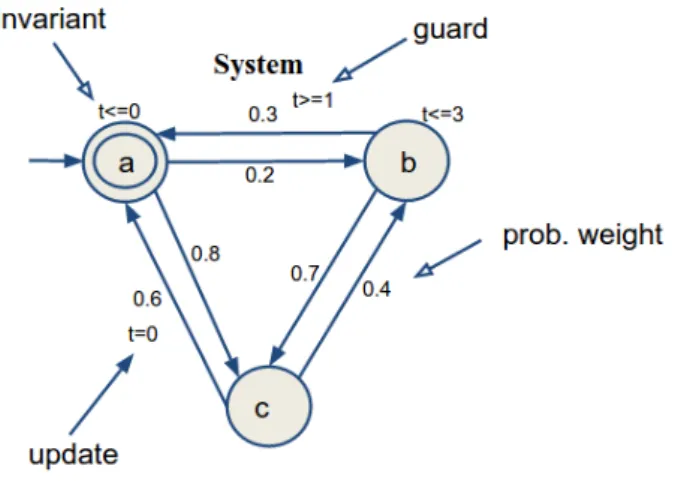
SMC-based verification technique monitors several simulations of a system that behaves in a stochastic way, that is, the locations and the events the system goes into are determined based on some probability associated with each event. PTAs are probabilistic version of temporal automaton obtained by associating a set of actions with each location. E⊂S×S(C)×guard(C) is the set of edges between locations, each edge is marked by a set of clocks and by a clock constraint.
For an edge (s,s′,X,δ)∈S fromstos′, the set X⊂C gives the set of clocks to be reset to zero, and is the time limit in guard(C) that must be met when using this edge . Associated with each location s is a nonempty set of actions As , which gives the set of actions that can be scheduled when the automaton is at location s .
Probabilistic Timed Computation Tree Logic - PTCTL
Informally, the maximum time an automaton can remain at a location is determined by the invariant state(s) associated with the clock variables at that location. A guard on the other side determines the earliest the automaton can transition to another location. The system starts at location a and transitions from one location to another based on the probability weight assigned to the transition.
Tree Logic, which allows us to answer such queries for systems that exhibit both timely and probabilistic behavior. Armed with this operator, PTCTL can be used to ask queries such as 'With probability at least 0.96, does the system reach location s' within period 5?'. In PTCTL, this query/property to be checked can be expressed as: ≥0.96[x≤3 and System.s'], where System is the name of the PTA representing the system.
6] System.c ≥[≤ 4] System.c or System.b, asks whether the probability that the system is at location c within time 6 is at least as great as that it is at either location b or location c within time 4.
Statistical Model Checking using UPPAAL SMC
Model Formalism
Trains slow down according to this speed and then approach the gate by synchronizing with the gate controller on signal appr[i]. The time at which the transition occurs from locations with invariants but without associated velocity(s), e.g. Cross, Appr and Start are determined by a uniform distribution over the time interval defined by the invariant.
For example, the time at which a transition occurs from the locationCross is uniformly and randomly chosen between 3 and 5 time units. The gate controller shown in Figure 2.3 is used to track the trains by placing them in a queue data structure (when the bridge is occupied by another train) and dequeuing them when the bridge is free.
Query Formalism
Uppaal SMC allows the user to visualize the values of expressions obtained from the simulation runs. This enables the user to gain useful insights into the system's behavior and make more relevant queries through the Verifier module. The syntax to get this done in Uppaal SMC is: simulate N[≤bound] Q1 , ., Qk , where N is the number of simulations, bound is the time limit on the simulations, and Q1, ., Qk are thek(location-based ) expressions that must be monitored and visualized.
For example, Simulate1[≤500]T rain(0).Cross,T rain(5).Cross,Gate.len runs one simulation over a time limit of 500, checking the times at which Train0 and Train5 cross the bridge, as well as the length of the train queue. But before we discuss the methodology, it is important to review the assumptions made. The energy consumption per device per unit time is fixed and is constant for all devices.
Each resident uses only one appliance and therefore consumes only the amount of energy that a single appliance uses in one unit of time.
The Setting
Model Checking Based Approach
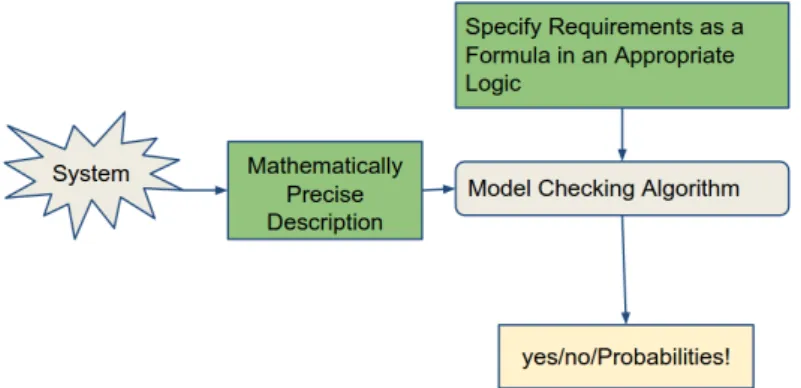
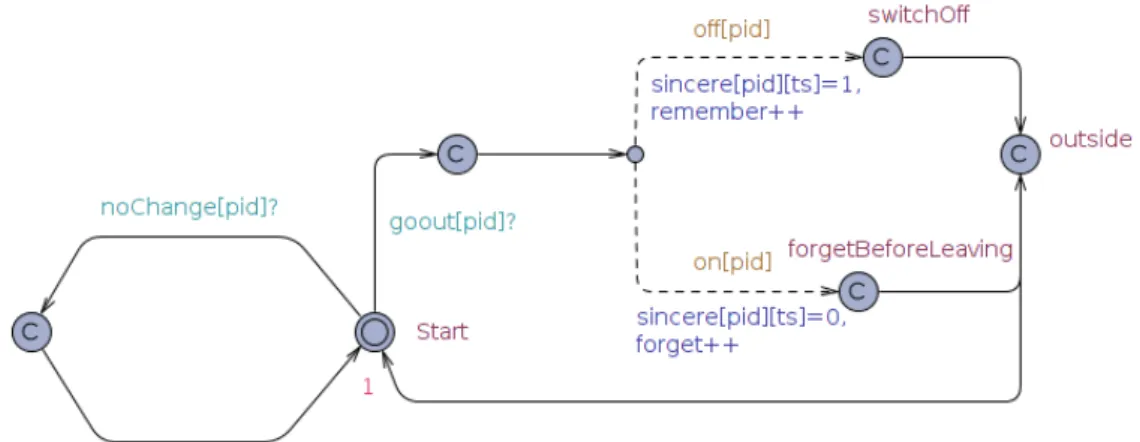
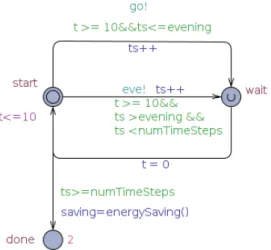
The Model Control Algorithm takes as input, the mathematical description of the system (Timed Automata in our case) and the requirements or properties that must be met by the system, and outputs a yes or a no with a given probability. And the following section describes some of the important properties that were checked with the system. The automaton switches from the start state to the standby state at the end of every 10-minute period.
This function returns the saved energy based on the energy consumption pattern and occupancy profile of the occupants as described in the previous sections. The go signal from the timer automaton sets this event in motion and the automaton moves to the WalkAround state from one of the three states viz. From each of these locations, the automaton moves to one of the states Room0 or Room1 or Room2 depending on the probability weights.
Upon transition from RemainInside to any of the states representing rooms, the roomPat array is updated to indicate that the person is still in that room by setting roomP at [pid][x][ts] to 1, where x is the room number and t is the time step. Initially, the automaton is in the initial state, then it moves to either switch f or f forgets to leave based on the energy awareness of the passenger, denoted by f[pid] and . Some of the most important and relevant queries that have been verified by the system are presented in the following table.
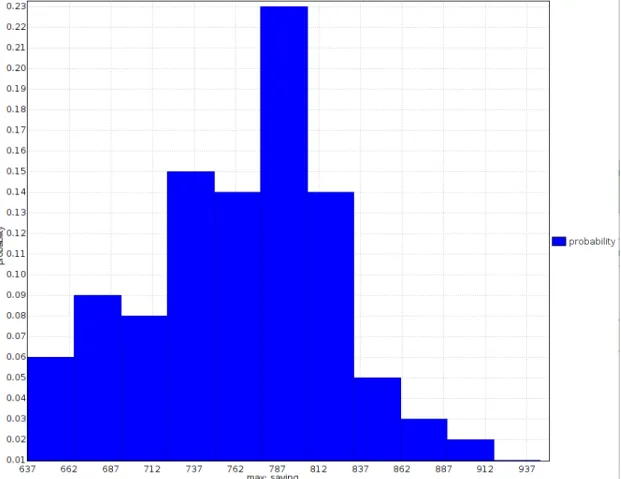
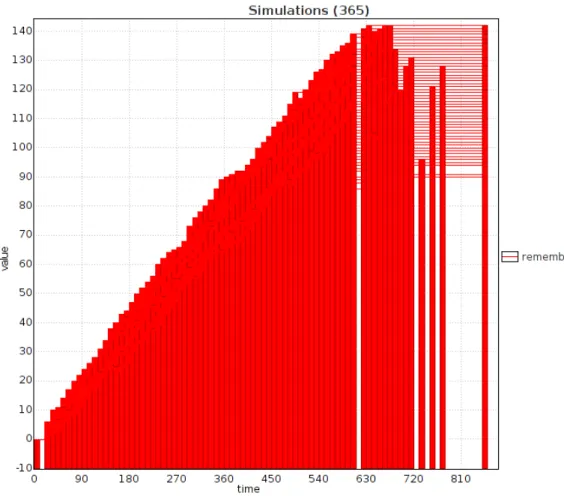
The first two queries simply ask about the probability that savings (in terms of time steps) will be within a certain range of values. The last three queries are to get the expected maximum values of the available items forget, remember and saves. The plot shown in Figure 3.4 depicts the probability distribution of expected maximum savings (in time steps) when the average energy awareness of the residents is 0.3.
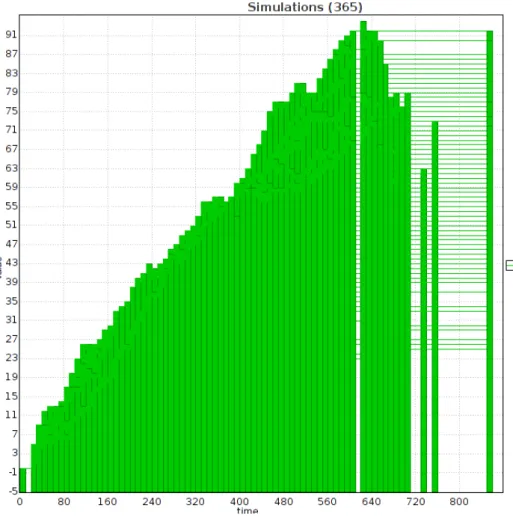
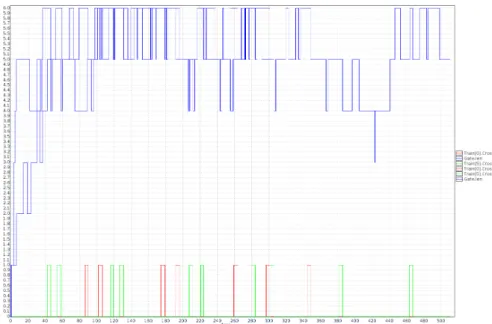
Finally, the plot in Figure 3.6 shows the plot of the difference in the number of remembers and forgets when the average sincerity value is 0.9. As expected, the difference turns out to be positive after a certain period of time due to high value of average sincerity of the residents.
Simulation Based Approach
The first step towards obtaining the occupancy profile for each resident is to get the next location or the current location at a particular time. Given the location matrix L and the p-matrix P, we calculate the matrix C = LP [Table 3.5], which is the movement probabilities of resident 2 from their original location to other rooms. The next step is to generate a random number r between 0 and 1, and compare it to each of the values in C'.
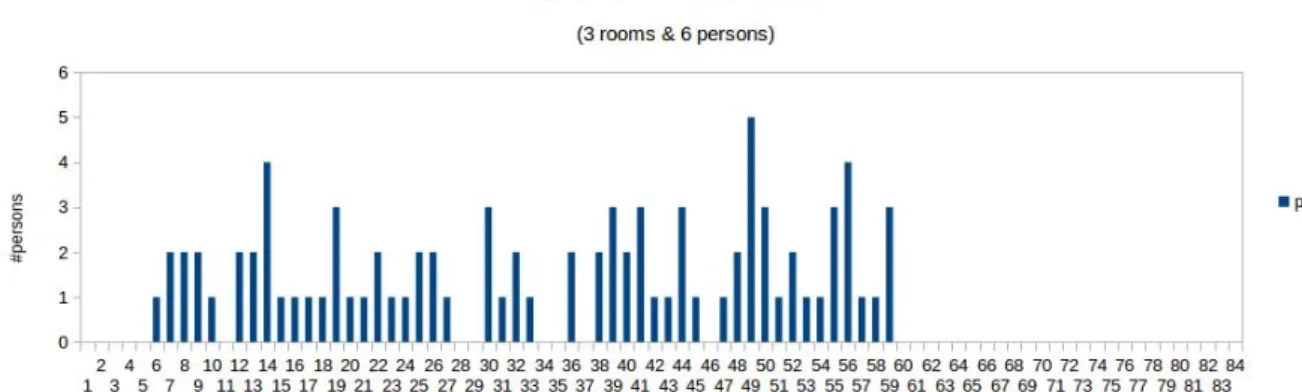
If the random number generated is 0.6, for example, then the next location of resident 2 is returned as 2. Recall that, the amount of energy saved is calculated as shown in Figure 3.8 Therefore, the energy saved per room per time step if the smart technology is deployed = (no. of people leaving a location - no. of people unplugging their devices)*W, where W is the average power consumed by a device in one time step, in kWh. Based on the occupancy profile and the energy profile thus generated, we have the energy saved as shown in Fig.
Average savings per day = energy consumption corresponding to the number of TimeSteps (in which the power is not turned off when not in use). Now that we have obtained the energy savings from the simulations, and considering the initial capital and return on investment, we can now answer whether the money should be invested in deploying smart technology or not. This approach is easy to implement and scalable, as the size of the system (i.e. the number of rooms, the number of people, etc.) can easily be increased without significant changes.
But since a simulation only covers a random trace of the system, the accuracy relies heavily on the number of simulations performed. For example, questions like "What is the probability of saving P amount of money in the first 1000 time units due to the deployment of energy-aware technology?" cannot be answered (easily) by the results obtained from the simulation. Before we conclude, it is important for us to compare the two approaches discussed, viz.
Simulation v/s Model Checking - A comparison
The decisive factor in this decision is the average energy awareness of the building's users. Based on this observation, and using the users' occupancy profile over different time intervals in a day, we report two decision-making approaches: Statistical Model Checking and Simple Simulation. However, Statistical Model Checking has an advantage over simulation because it answers a wide range of questions related to the stochastic behavior of the system, which cannot (easily) be answered using regular simulation.
Thus, we have seen that the model checking approach can be used to solve the investment dilemma given the parameters discussed above and earlier.
![Figure 2.2: Train PTA [13]](https://thumb-ap.123doks.com/thumbv2/azpdfnet/10482542.0/14.892.287.536.125.668/figure-2-2-train-pta-13.webp)
![Figure 2.3: Gate-Controller PTA [13]](https://thumb-ap.123doks.com/thumbv2/azpdfnet/10482542.0/14.892.288.527.157.353/figure-2-3-gate-controller-pta-13.webp)