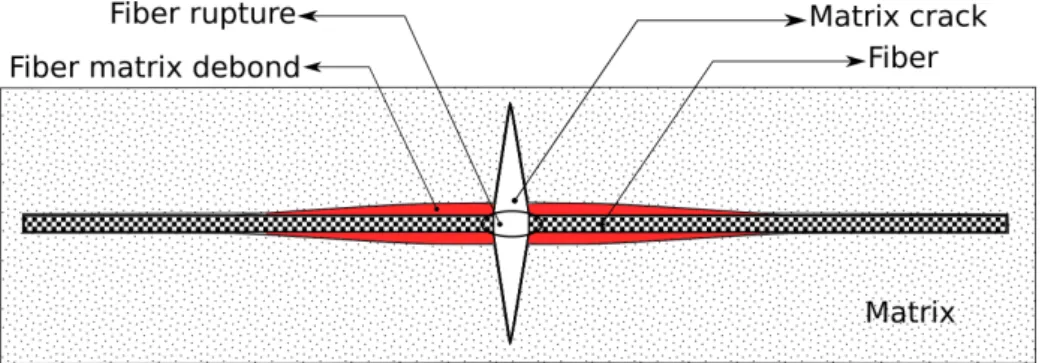
Study of stress redistribution after the fiber fracture in the SFC reveals the development of different damage modes occurring in FRPs. In the result of SFC fiber fragmentation test, the evolution of matrix crack, fiber-matrix interface failure, stress redistribution around the fiber failure is discussed.
Composite materials
Multi-scale analysis of composites
However, micromechanics cannot be used at the laminate (meso) level or the structural (global) level due to computational limitations. Structural analysis is performed at the global scale to understand the overall behavior of composite structures.
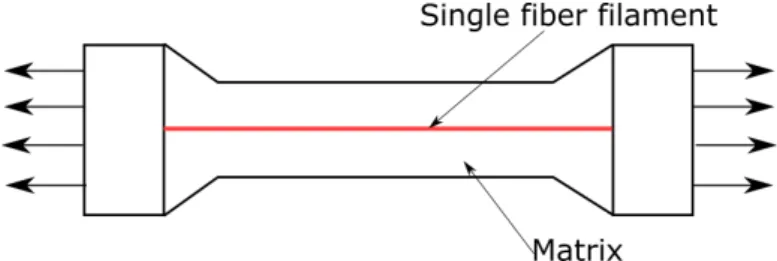
Single Fiber composites
Analysis of Single Fiber Composite
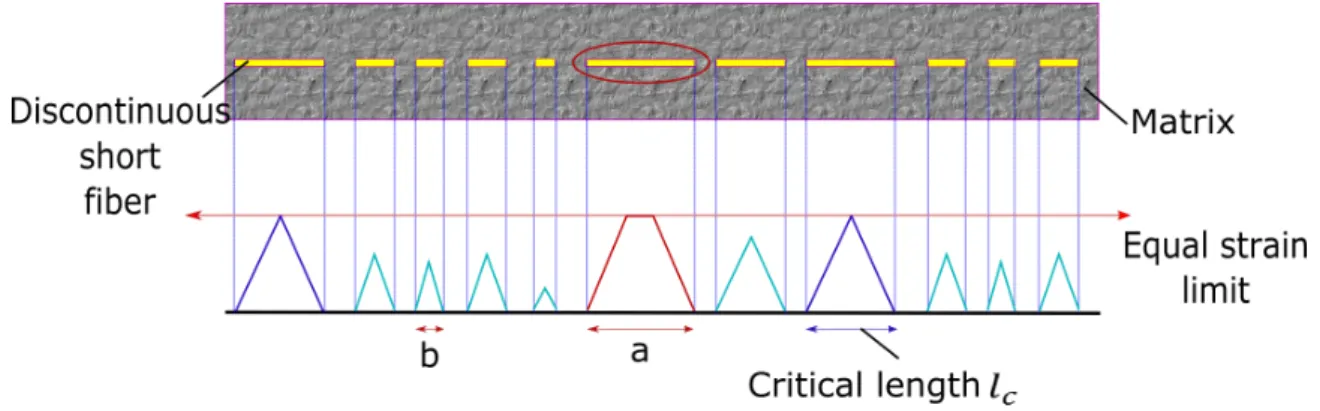
Damage saturation is the condition when each fiber has its length less than or equal to the critical length lc [8, 9]. Hereσu is the ultimate strength of fiber and τm is the shear stress at the fiber-matrix interface.
Types of failure in SFC
On the other hand, fragments of length b that are shorter than the critical length lc have stresses that are less than the ultimate strength of the fiber. In addition, stress redistribution and load transfer are also explained based on the analysis of SFC.
Motivation
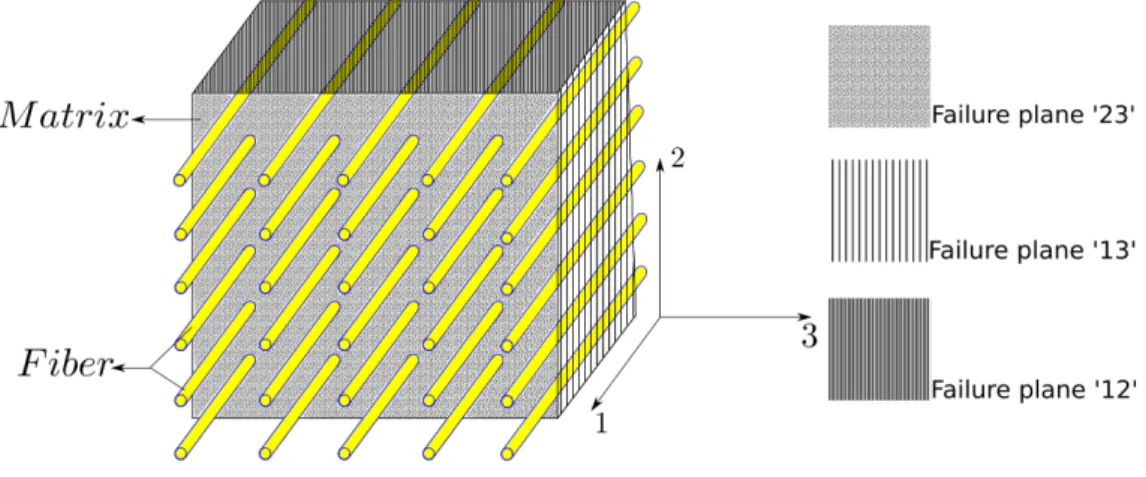
Other failure modes experienced by composites are matrix cracking, delamination, fiber-matrix debonding, and fiber pull-outs. The work done on the analysis of SFC helps in understanding damage modes shown in Fig.
Objectives
Thesis layout
Introduction
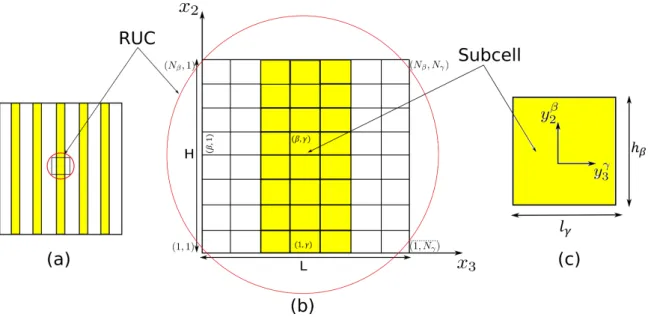
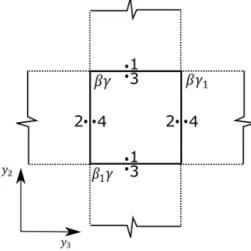
The local coordinate system (y2β, y3γ) is located at the center of the subcell as shown in Fig. In this work, single fiber composite is analyzed in two dimensions with the HFGMC formulation.
HFGMC formulation
- Displacement vector in HFGMC framework
- Strain vector at each subcell
- Average strain
- Average stress
- Equilibrium equation
- Incremental form of constitutive relation
- Traction and displacement continuity
- System of equations and unknowns
- Residual vector
The expression of stress is assumed to follow linear expansion in the local coordinate system [16]. The incremental form of the constitutive relation, for the available material in the subcell (βγ), is given by the equation:
Homogenization of properties
The residual vector in its incremental form ∆Rβγ was defined as:. 2.35) ∆Rσ represents the residual based on the two traction continuity expressions given by Eqs. To do this, for a given subcell, the total residual vector is calculated in integral form rather than in incremental form as defined in Eq. If the norm of the residual is less than the allowed tolerance of 10-5, the solution of the current step is accepted, otherwise the correction for the microvariable is calculated using the Jacobian.
Later in Chapter 3, HFGMC methodology is coupled with damage detection and damage modeling to form the PDA. Progressive damage analysis (PDA) [21] involves the detailed study of damage initiation, evaluation to final failure. Progressive damage analysis was performed numerically using the home grown code designed in the Fortran fixed format.
Stress analysis
Composite modeling for stress analysis with HFGMC method
Damage detection
- Maximum Principle Stress Theory
- Multi continuum theory (MCT)
- Fiber failure mode
- Matrix failure mode
The concept of representative volume element (RVE) is used in the derivation of the MCT theory. In MCT, the unknown strains in the matrix and fiber are evaluated with the help of Eq. The coefficient Z1 and Z2 are set to zero since the linear terms have already been considered in the basic derivation of the MCT.
Considering only the fiber strength, all the invariants (see Eq. 3.16)) which are independent of stress in the plane010 have no effect on the failure equation. Assuming that the longitudinal failure of the composite fiber dominates, A1 is set to zero in the Eq. S2222mc, S3322m provide the matrix compressive strength in direction 2 and 3 respectively and Sm12 indicates the strength property in shear.
The information gathered in Section 3.2 is further used in the next section which includes the PDA damage modeling aspect.
Damage modeling
Failure criteria derived in this section will be used in the damage detection in Section 4.2, which describes the effective multifiber composite (MFC) property calculation.
Structural outline of PDA
The second solver is the parallel direct solver (Intel MKL Pardiso solver) which is 9 times faster than that of the first solved solver discussed, but loses its accuracy as the number of subcells increases. MCT criteria are applied for subcell damage detection while performing the SFC-RVE analysis. For damage detection in the fiber fragmentation test of SFC, the maximum stress criteria provide the fracture index for the fiber subcell.
In the effective property calculation of multi-fiber composite and SFC fiber fragmentation test, the degradation factor is kept 99%. The Section 4.3 talks about the SFC fiber fragmentation test, followed by the Section 4.3.3 to explain the numerical analysis of SFC. The strength of the individual fiber fragment is modeled based on the literature discussed in Section 4.3.2.
Furthermore, the effective property calculation of multifiber composite based on the SFC-RVE concept is discussed in Section 4.2.
Introduction
Effective property calculation of multi fiber composite
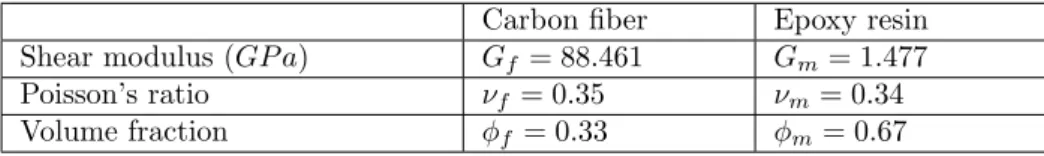
- Material properties of fiber and matrix from experiment
- Rule of mixture
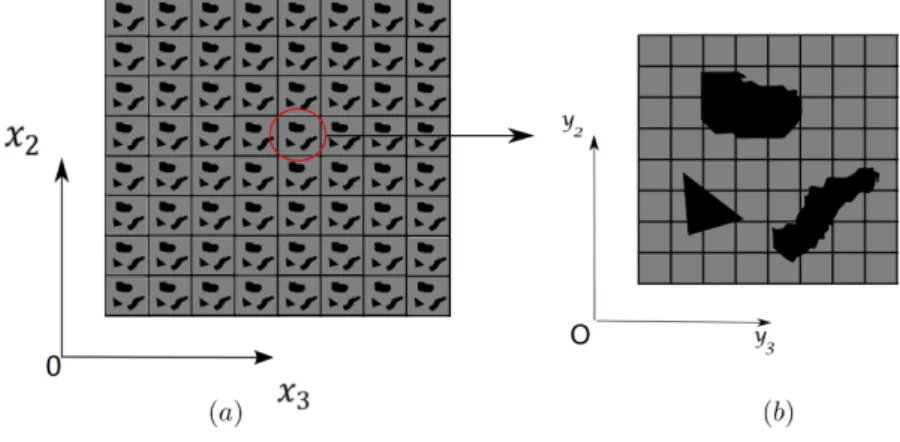
- Model of SFC-RVE
- Assumptions for the analysis of SFC-RVE
In the mixing rule, effective properties of the composites are found using Eq. The geometric model used in the present analysis of SFC-RVE is illustrated in Fig. Mesh increment studies show that the analysis solution repeats itself with the discretization of and 45×45.
The global coordinate system x2−x3 for the SFC-RVE is located in the lower left corner (origin (0,0)). The inter-fiber distance in the MFC is chosen to be 15µmon, therefore the matrix width is 7.5µmon on each side of the fiber. With SFC-RVE, the procedure for length effect in the damage modeling is omitted.
Using the aforementioned procedure (Section 4.2), the effective properties of the MFC material are evaluated and presented in Section 5.1.
Fiber fragmentation test of Single Fiber Composite
- Critical length for fibers
- Weibull tensile strength distribution
- Numerical simulation of SFC fragmentation test with PDA
- Assumptions in the analysis of SFC fiber fragmentation test
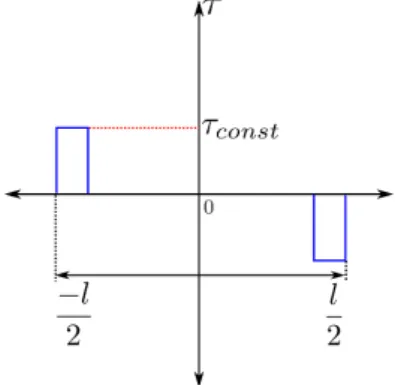
To further simplify the equation. 4.5) it is assumed that the shear stress is constant in the small length near the fiber ends [11]. The constant tensile stress in the center of the fiber is due to the matrix shear at the fiber ends. The maximum stress developed in the fiber is therefore determined by the shear stress on the fiber at the ends.
Consequently, the fiber breaks when the tensile strength developed in the fiber is more than its ultimate tensile strength. For the failure probability of the fiber strength can be related to the fiber length by Eq. 4.10). Weibull scaleσ0 is called as the average strength of the fiber at the gauge length of l0.
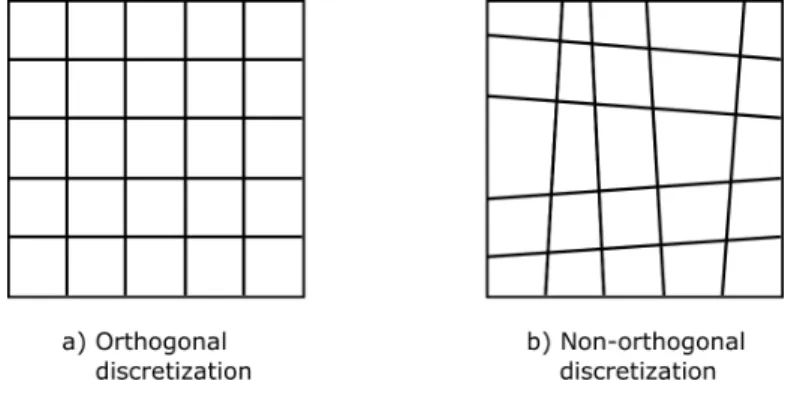
Such a form of discretization allows for the desired microdimensions of the fiber in fig.
Effective property calculations of multi fiber composite
The results of the analyzes described in sections 4.2 and 4.3 are presented in the current chapter. While Section 5.1 provides results of the analysis of CFRP composites with the single fiber composite representative volume element (SFC-RVE), Section 5.2 provides the discussion of the results obtained in the SFC fiber fragmentation test. Geometric and material details required in the multifiber composite analysis with SFC-RVE are given in Sections 4.2.1 and 4.2.3.
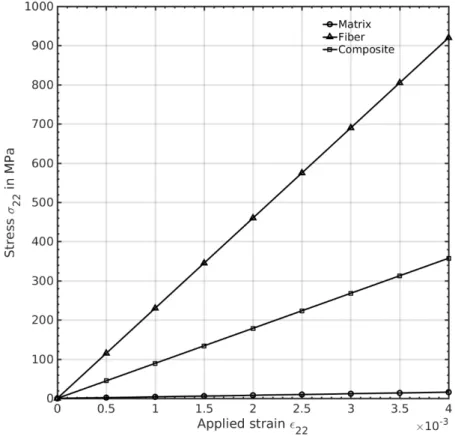
In this case, SFC-RVE fails with matrix failure detected at strain = 4×10⁻³. Using these values in the equation above, it can be seen that the fiber is 60 times more stressed than the matrix. The matrix does not participate in the load, but its primary function is to transfer the load to the fiber.
Although there is a discrepancy between the numerical analysis of SFC-RVE and the experimental findings, the obtained results are used in the qualitative explanation of the load transfer between the fiber and the matrix.
SFC analysis for the fiber fragmentation test
- Stress redistribution
- Matrix fiber interface failure
- Average tensile stress distribution in the fiber
- Stress interactions along the fiber-matrix interface
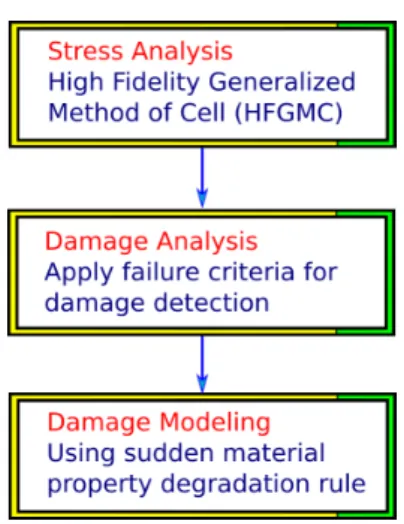
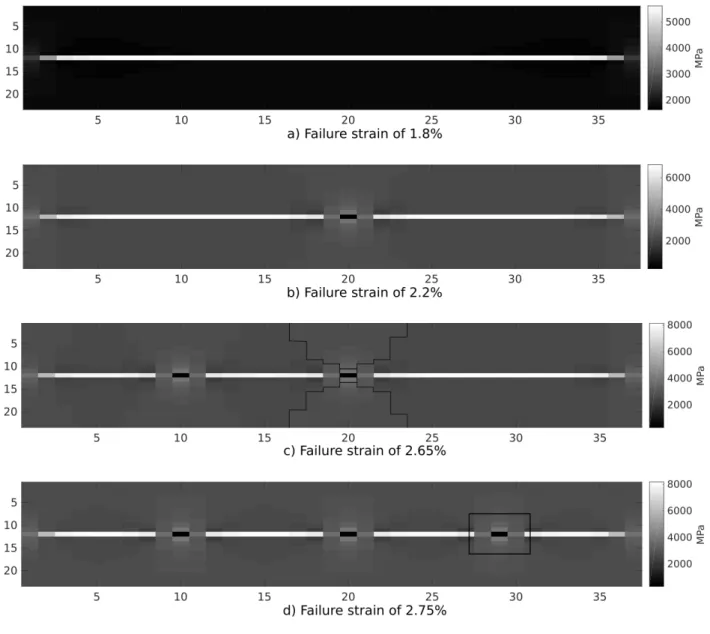
To perform the fiber fragmentation test of SFC, the PDA framework is described in Figure . All results derived in the current section are obtained based on the general problem definition discussed in section 4.3.3, where the tension is applied in the direction of the fiber. Note that the figure shows the maximum stress that the fiber can tolerate just before the next break.
Most of the stressed subcells around the fiber break result in matrix and interface failure. The maximum positive and negative shear around the fiber break results in interface failure. It is further noted that the shear stress in the matrix subcells present along the fiber-matrix interface is zero, except for those present at the fiber ends.
These trends represent the average shear stress present in the matrix subcells immediately adjacent to the fiber subcells.
Conclusion
Future work
Design of a generalized high-resolution cell method with arbitrary cell geometry for refined micromechanics and damage in composites. A new and general formulation of the HFGMC parametric micromechanical method for two- and three-dimensional multiphase composites. Micromechanics of metal matrix composites using the generalized cell model (gmc) method user's manual.
A Monte Carlo simulation of damage and failure process with crack saturation for unidirectional fiber reinforced ceramic composites. Composites Science and Technology. Determining the size of the representative volume element for random composites: statistical and numerical approach. Estimation of statistical fiber strength in fragmentation tests of single fiber composites. Composites Science and Technology.
Simulation of the failure process of single-fiber composites with finite elements considering interface properties.
Complete and incomplete quadratic equation of displace- ment in HFGMC method
Since the SSE must be minimum, its partial derivative with respect to xis is evaluated and then set equal to zero to get the least error solution. This solution of the Eq. B.8) gave the least error solution, to the system of linear equation. In the HFGMC analysis, the solution of the equation ∆X =TG−1DG is found using Intel Math Kernel Library.
Use of the sparse solvers
Other solvers are also used based on the sparsity of the TG matrix. a) Morphology of 3×3 subcells (b) Morphology of 6×6 subcells Figure B.1: Distribution of zeros and non-zeros in the TG matrix. When Hooke's law is applied to each of the fibers, the matrix and the composite separately, the following expression is obtained: Putting the value of Eq. C.7) is rearranged so that terms in fiber and matrix are separated.
Fiber strength distribution with Weibull distribution