Background, Motivation and Scope
Introduction
The main attractive properties of aluminum alloys are high formability, light weight, good corrosion resistance, high thermal as well as electrical conductivity and recyclability (Hatch, 1984). Aluminum alloys are used in the manufacture of components in the automotive, aircraft and shipbuilding industries mainly due to their light weight.
Production of Aluminum
Designation of Aluminum Alloys and their Applications
Ultimate tensile strength (UTS) of 69–186 MPa, strain hardening, high thermal and electrical conductivity, high corrosion resistance. UTS 186427 MPa, good creep strength at high temperatures, high toughness even at cryogenic temperatures, good machinability.

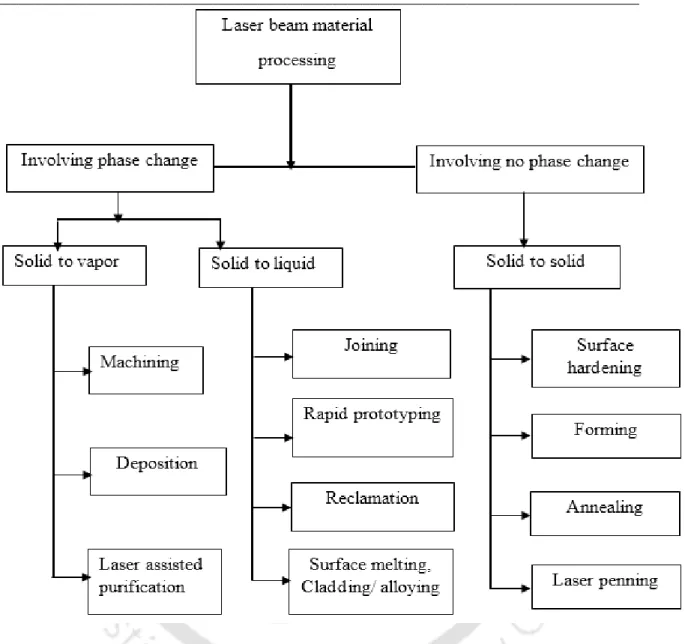
Laser Application in Manufacturing
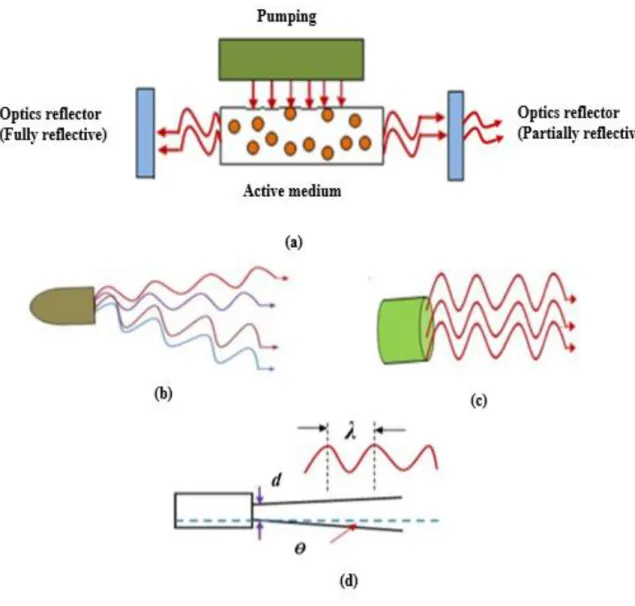
- Types of lasers
- Laser interaction with solid surface
The output energy from the laser interacts with a solid surface, creating an electronic excitation and de-excitation of the solid surface in a short time. The solid surface first absorbs the laser beam, which creates an electronic excitation and de-excitation at the solid surface.
Lasers in Material Processing
- Laser Forming
- Laser Rapid Prototyping
- Laser Joining
- Laser Machining
- Laser Surface Modification…
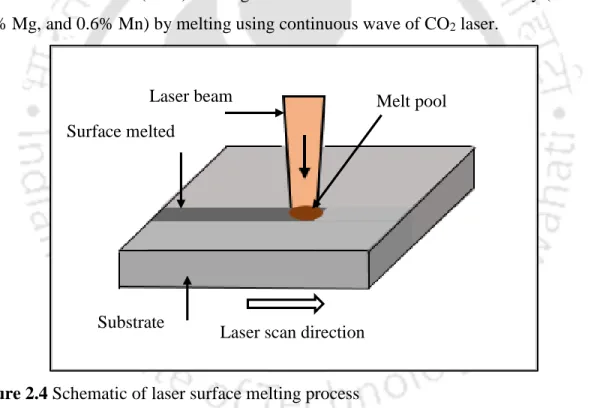
Laser surface modification is performed by melting the surface of the material with a laser beam or by adding additional material, followed by melting with a laser beam. Alloying materials can be added during laser beam melting by feeding wire or powder directly from the side of the laser beam (Singh and Harimkar, 2012; Obadele et al., 2014).
Motivation and Scope
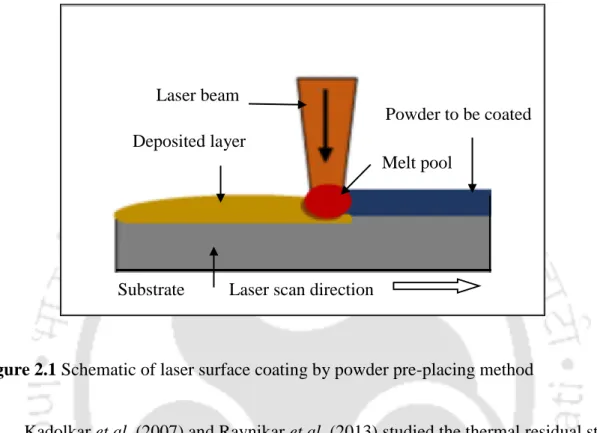
The alloy material can be pre-placed on the substrate material before laser beam melting (Kadolkar and Dahotre, 2003; Sahoo et al reported that a powder pre-placement method has the advantage of controlling the coating thickness; a smaller amount of powder is required, resulting in high material utilization. Furthermore, the pre-placed powder is easily melted as the laser beam absorbability is high due to coating.
Organization of the Thesis
The original hardness of the substrate was in the range of 240–. The erosion resistance of laser remelted sample was better than thermal barrier coated samples. On the other hand, when the silicon content is more than 12.5 wt%, the microstructure is hypereutectic.
Literature Review on Laser Surface Modification of Aluminum and its Alloys
Introduction
Laser surface alloying can create a new microstructure on the surface that increases its mechanical properties, including hardness, fatigue, and wear resistance. Laser surface modification improves the microstructure, hardness, wear resistance and corrosion resistance of the metal.
Laser Surface Coating
Detachment and granular exfoliation of the coating from the surface resulted in higher wear of the plasma sprayed samples than that of the laser coated samples. 2000) reported laser surface coating of aluminum alloy using TiC powder by Nd: YAG laser in continuous wave mode. Increase in the laser scanning speed resulted in the increase of the micro-voltage developed during laser coating.
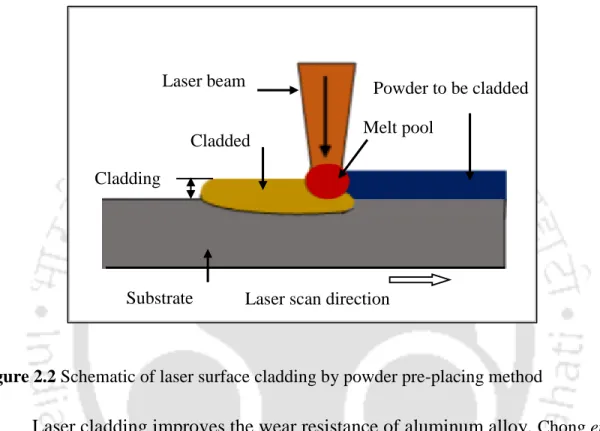
Laser Surface Cladding
2012) developed a hybrid controller to control temperature and deposition during laser coating for complex parts such as turbine blade. 2018) reported laser cladding of aluminum alloy 7075 using Ti/TiBCN coating using 4 kW semiconductor laser.
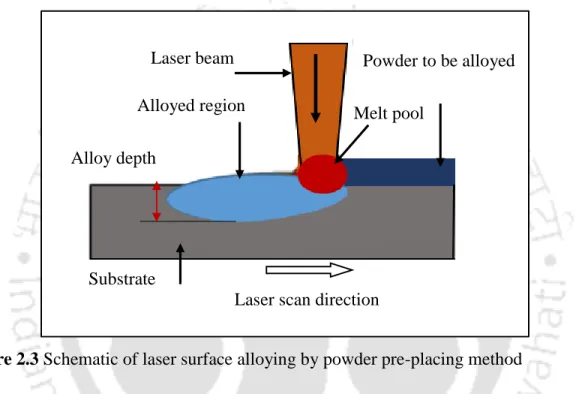
Laser Surface Alloying
- Studies on Wear Resistance
- Studies on Corrosion Resistance
Bonding was achieved by fusing with a pulsed Nd:YAG laser with a maximum power of 400 W. Bond strength was increased by 10-15 times. The presence of micro-cracking was a challenge when a laser power was increased from 200 to 300 W. The thickness of the alloy layer was in the range of 50-80 μm.
Laser Surface Melting
- Studies on Wear Resistance of LSM
- Studies on Corrosion Resistance of LSM
The superior corrosion resistance of laser treated zone was due to chemically stable AlN composite phase. Some work has been done on the effectiveness of laser surface melting for corrosion resistance.
Research Gaps
They reasoned that the corrosion resistance of laser-treated metal alloys mainly depends on the refined microstructure, the phase transformation of new intermetallic compounds and the cooling rate. 2008) reported on laser surface melting of Al-9 wt% Si alloys. Laser surface melting of aluminum alloys is an interesting area that needs further research.
Objectives and Research Plan
The EDS result shown in Table 5.5 shows the highest concentration of manganese up to 84.9 wt.%, the minimum concentration was 29.6 wt.%. The hardness increased to 101 HV0.3 by bonding with magnesium, but after the acid corrosion test, the hardness decreased to 61 HV0.3. The reduction in hardness is an indication of corrosion that has removed some depth of the hard zone of the alloy.

Details of Experimentation
Introduction
Laser surface alloying of commercially pure aluminum with various metals and ceramic powders using powder preposition method is studied. The laser surface melting was carried out on a cast aluminum alloy Al-12Si-4Cu-1.2Mn after dissolving heat treatment in an electric oven at 510 ºC for 5 hours and cooling in an oven at 165 ºC for 6 hours.
Sample Preparation
The cast samples were prepared in a graphite crucible of 3 kg capacity using a melting/vacuum holding furnace. Heat treatment was carried out for 5 hours in an oven at 510 oC and then it was cooled in the oven at 162 oC for 6 hours.

Laser Surface Alloying
Here, M2 was taken as equal to 1 considering the radius as a perfect Gaussian, although in practice it is always greater than 1.
Studying Microstructure
Figure 3.7 (a-c) shows the photographs of precision cutting machine, sample mounting machine and automatic polishing machine.
Chemical Composition and Phase Analysis
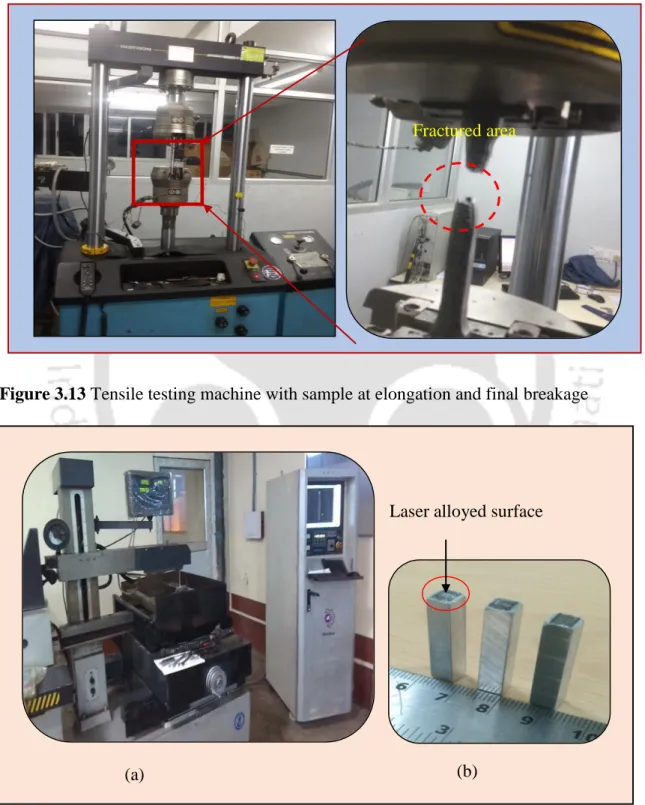
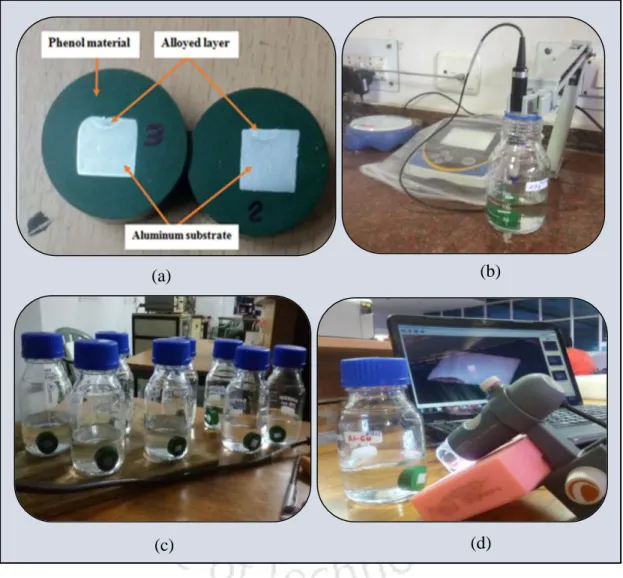
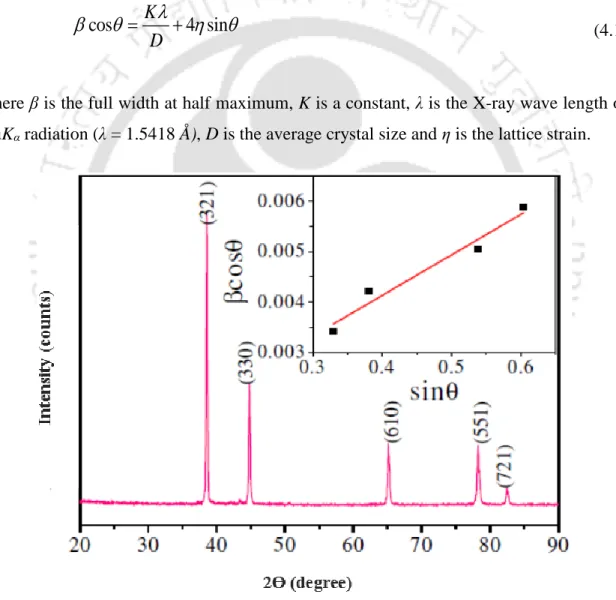
The top circle mark on top of the pin sample shown in Figure 3.14(b) represents the laser surface alloyed area. 83 Figure 5.5 XRD pattern of laser surface alloyed samples for Al-CuMgMn alloy for selected samples.
Studies of Surface Roughness
Hardness and Tensile Testing
- Surface Hardness Testing
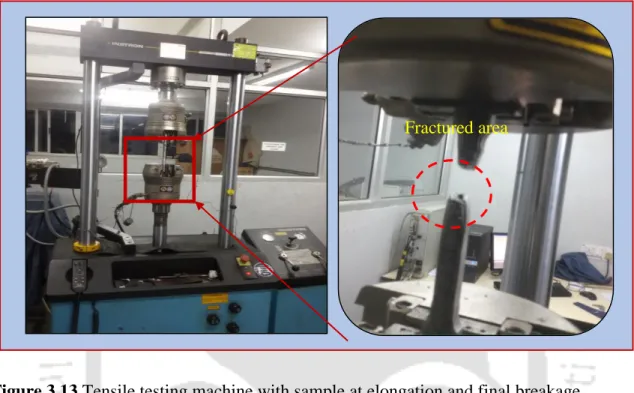
- Tensile Testing
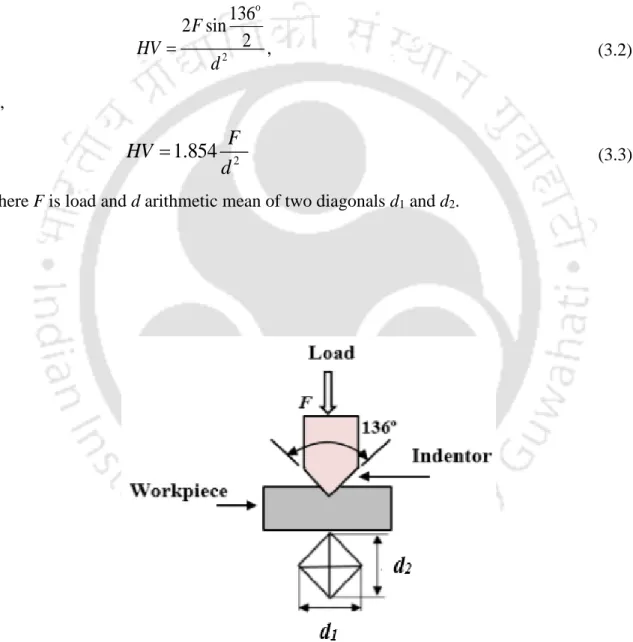
Surface hardness test is carried out using Vickers hardness testing machine, which has a load capacity of 0.5 kg. The value of Vickers hardness is displayed on the machine after an operator measures the distance of two diagonal lines 'd1' and 'd2'.
Wear and Surface Scratch Testing
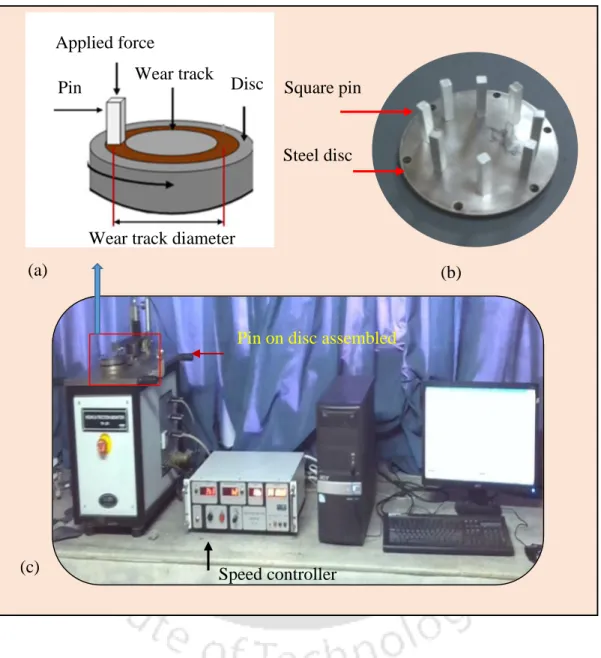
- Studying Friction and Wear
- Studying Surface Scratch
The normal load, rotation speed and wear track diameters are set according to the need. The indenter of the machine is a standard Rockwell 'C' type and the tip of the indenter is a hard diamond with nose radius (conical angle is 120º and hemispherical tip radius of 200 microns).
Corrosion Testing
Corrosion pit depth and corrosion pit width were also measured by non-contact optical profilometer.
Conclusion
In the present work, the surfaces of the laser surface alloyed samples were tested without polishing their surfaces. The effect of corrosion on the microhardness of a laser surface alloyed sample is also discussed.
Pilot Experiments on Surface Alloying of Copper in Aluminum using CO 2
Introduction
Laser surface melting has been implemented to improve the surface properties of metal parts as reported by Pagano et al. Laser surface alloying utilizes a high power density of the laser beam to melt the metal alloy elements and the surface of the substrate material (Dahotre, 1998; Zhao et al., 2012).
Materials and Method
Please note: P is laser edge, H is distance distance, v is laser beam pitch and d is laser beam door cut.
Results and Discussion
- Crystal Size and Lattice Strain
- Surface Roughness
- Microhardness Analysis
- Microstructure and Surface Morphology
- Porosity Problems in Surface Alloying
When the Al4Cu9 compound was given a rapid cooling time, it resulted in the formation of a fine microstructure at higher magnification, as shown in Figure 4.6(b). The quality of the laser surface alloyed samples confirmed that there are no cracks and other defects in the alloy area.
Conclusion
The pitting corrosion resistance of the laser surface alloyed sample was more than that of the aluminum substrate. Further investigation of laser surface alloy morphology was done using FESEM as shown in Figure 7.2 (c).
Surface Alloying of Copper, Magnesium and Manganese in Aluminum
Introduction
Fu and Batchelor (1998) reported laser surface alloying of AA6061 aluminum with 70% Ni and 30% Cr metal powder. A literature review shows that only a few attempts have been made to laser alloy commercially pure aluminum with a copper additive, as discussed in Chapter 4.
Materials and Method
75 In this chapter, individual and combined metal powders of Cu, Mg and Mn are alloyed with commercially pure aluminum substrate. As a new combination, in this work copper, magnesium and manganese are alloyed in aluminum substrate in the ratio 2:1:1.
Results and Discussion
- Surface Topology Study
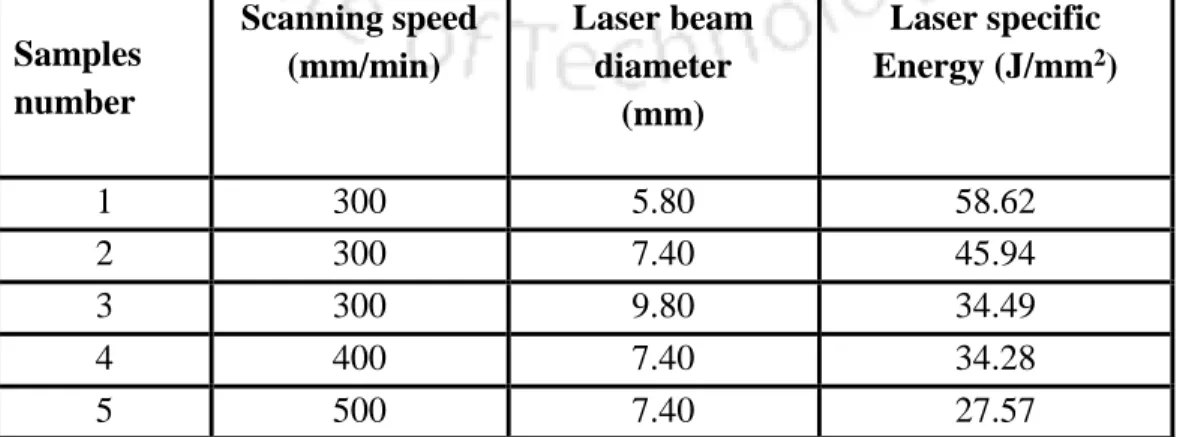
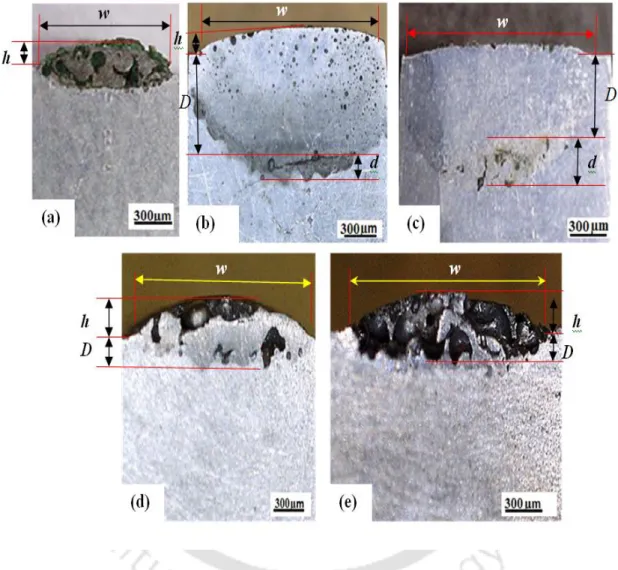
- Effect of Laser parameters on Alloy Geometry
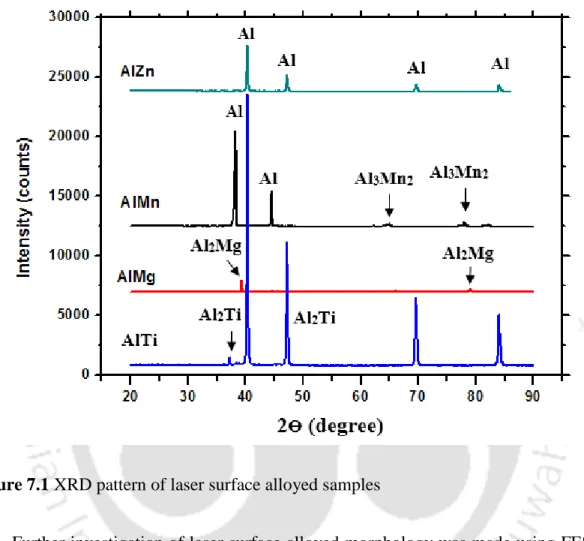
- X-ray Diffraction Analysis
- Microstructure and Surface Morphology
- Microhardness Analysis
- Tensile Strength
The smaller indentation shape as shown in Figure 5.16(a) indicates the alloyed zone with a superior hardness. 99 Figure 5.18 Stress-strain graph of laser surface alloyed and unalloyed aluminum substrate processed by 1.7 kW laser power, 300 mm/min laser scanning speed and 7.4 mm laser beam diameter.
Conclusion
Wear mass loss, wear coefficient and friction coefficient were studied after laser surface alloying. The average coefficient of friction for laser surface-alloyed samples and aluminum substrate is shown in Table 6.3.
Wear Behavior after Laser Surface Alloying of Aluminum with Copper,
Introduction
Labisz (2014) reported the laser alloying of cast aluminum Al-Si-Cu with WC ceramic powder using a high-power diode laser (HPDL), which improved its microstructure and improved hardness properties. 2006) reported the laser surface alloying of aluminum by forming a hard SiC dispersed composite layer on an aluminum substrate. The improved wear resistance was due to the increased microhardness and refined microstructure of the laser composite layer.
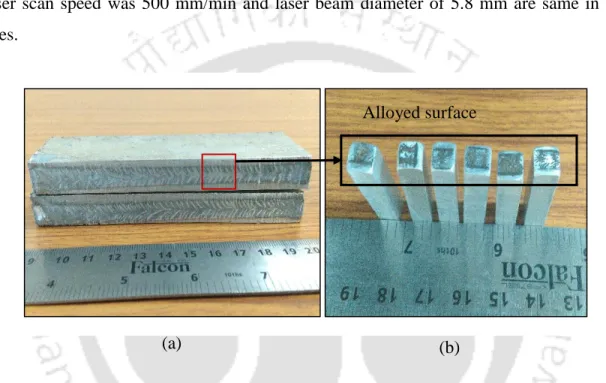
Materials and Method
Pin samples of size 6 mm 6 mm 30 mm were prepared from the laser surface alloyed region as shown in Figure 6.1. Therefore, in the pin, the entire surface of 6 mm 6 mm had good and almost uniform concentration of alloying elements.
Modified Lancaster Wear Coefficient
In the pin-on-reel test, instead of the wear volume, the wear mass is measured and divided by the density to obtain the wear volume. Since the wear depth is very small, we can use the average density av instead of the variable density over the sliding distance.
Results and Discussion
- Wear Analysis
- Study on Coefficient of Friction
- Worn Surface Morphology
As the hardness decreases, the plasticity index increases, causing the friction coefficient to decrease (Mao et al., 2016). The asperity-based model predicts a slight reduction in the friction coefficient with increasing normal load (Mao et al., 2016).
Conclusion
Corrosion Behavior After Laser Surface Alloying Aluminum with Different
Introduction
Hinton, (1995) reported the corrosion of aluminum and magnesium alloys in the form of pits and white powdery deposits on their surface. 2006) reported that pitting of aluminum is caused when chloride ions attack the metal. In this chapter, improvement of the corrosion resistance of aluminum was achieved by laser surface alloying with magnesium (Mg), manganese (Mn), titanium (Ti) and zinc (Zn) metal powders using a continuous wave of 2.5 kW CO2 laser cutting machine.
Materials and Method
The depth and width of the corrosion pit were measured with a non-contact optical surface profilometer. Before the corrosion test, the pH of the solution was measured using a pH meter (pH 2700, brand: Eutech, Singapore).
Results and Discussion
- Microstructure and XRD Phase Analysis
- Corrosion Analysis
- Effect of Corrosion on Hardness
- Corrosion Mechanism
- Acid and Salt Solutions Test
The hardness value of AlMg sample before and after acid corrosion test is shown in Figure 7.10 (a). In acid solution, the size of corrosion pit was larger in the alloyed sample as shown in Figure 7.16 (c).
Conclusion
No literature was found on the wetting and contact angle reported during laser surface alloying of aluminum with SiC. The surface topology of the laser surface alloyed area was analyzed using a non-contact optical surface profiler.
Laser Surface Alloying of Aluminum with TiO 2 and SiC Powders
Introduction
There is limited data on laser surface bonding of pure aluminum substrate to SiC and no studies have yet been performed using TiO2 bonding. In this short chapter, it is intended to illustrate the advantage, especially in improving hardness, after laser surface bonding.
Materials and Method
Aluminum reinforced with titanium aluminide alloys has shown high strength, high fracture toughness, low structural specific gravity, and good resistance to corrosion, wear, and creep (Wagner et al., 1999; Gaus et al., 2000). Aluminum reinforced with titanium aluminide composite has been produced by various methods – mechanical alloying (Barlow et al., 2001); friction and stirring processing (Zhang et al., 2011); reactive compression molding (Beyer et al., 2000), reactive sintering (Gheorghe et al., 2002) and ball milling process (Ying et al., 2004).
Results and Discussion
- Surface roughness
- Microstructure Analysis
- Microhardness of Al-SiC and Al-TiO 2
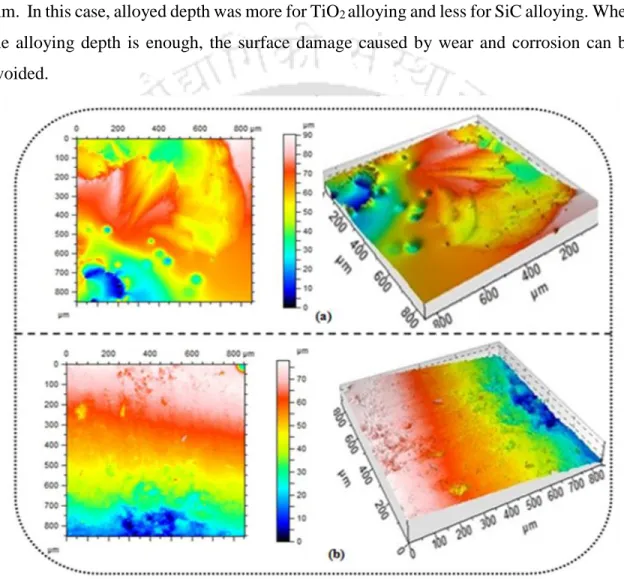
154 Figure 8.4 EDS surface topology and spectral point of laser surface alloyed Al-SiC material: (a) photomicrograph of the surface topology of the alloyed area and (b) EDS point spectrum. Figures 8.5 (ab) present the surface morphology of the laser surface-alloyed material. area with TiO2. It was found that the microhardness of the interface with laser alloying of AlTiO2 was less than 90 HV0.3, and with laser alloying of the Al–SiC surface, the microhardness of the interface was less than 60 HV0.3.
Conclusion
The deformation depth of the scratches formed on the surface was measured using an optical surface profilometer. The grain size of the heat-treated sample before laser remelting was 65 µm, while for cast samples it was 74 µm.
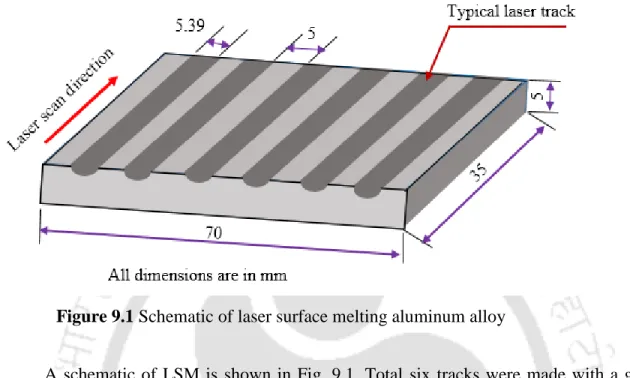
Laser Surface Melting of Al-12Si-4Cu-1.2Mn Alloy
Introduction
2003) performed LSM of Al-15Cu alloy and observed about 3 times increase in the hardness. In this piece of work, LSM of Al-12Si-4Cu-1.2Mn was performed to study its influence on microstructure, microhardness, tensile strength and wear resistance.
Materials and Method
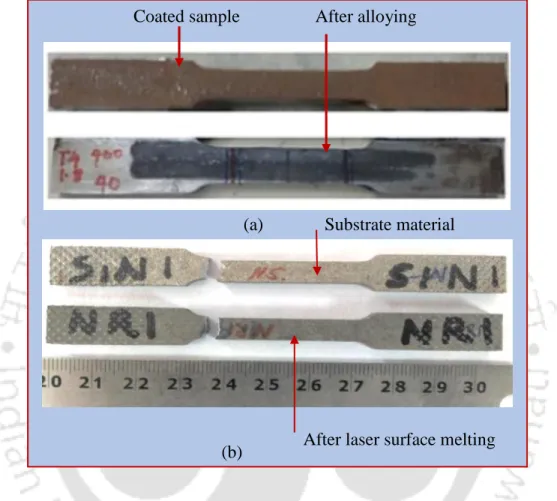
Then the tensile specimens were prepared by cutting a portion of the laser treated area with a wire electric discharge machine. Width at the measured length portion was 6 mm and the total length of the sample was 100 mm.
Results and Discussion
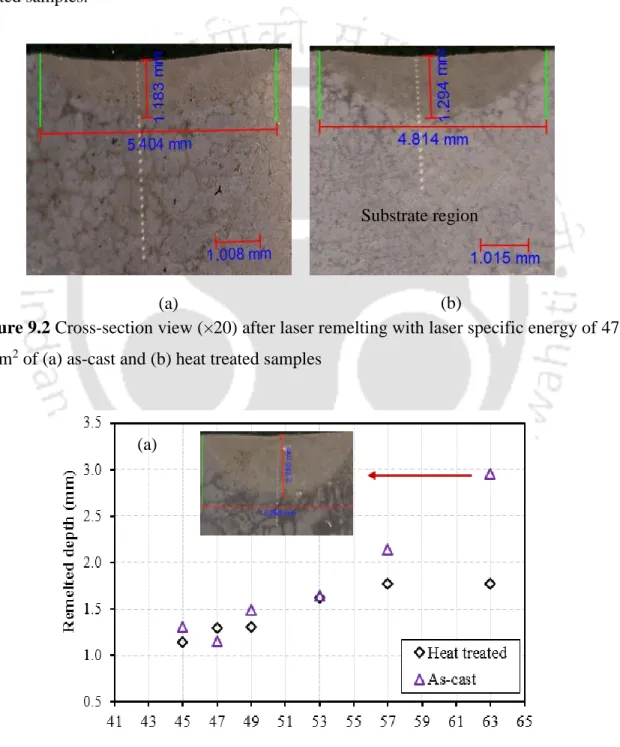
- The remelted thickness
- Microstructure and grain size
- Microhardness
- Surface scratch resistance
- Ultimate Tensile strength
Figure 9.4(a–b) shows the microstructure of as-cast and heat-treated samples before LSM, respectively. It was found that the average grain size of cast samples was larger than the heat treated samples.
Conclusion
Conclusion and Scope of Future Works
Conclusion
Scope of Future Work