The marketing research findings of the above consumer behavior studies were communicated to designers in a conventional manner. This study is an attempt to provide a holistic view of the academic discipline of product design and marketing research.
Consumer Behaviour Related to Dishwashing 65-117
The transformation of marketing research findings for design ideation
Conclusion, Recommendations and Suggestions 141-146
Descriptive statistics of the respondents’ demographic profile .1 Age of the respondent
- Gender of the respondent Gender of the
- Educational qualification of the respondents Educational
- Occupation of the respondents Occupation Frequency Percent
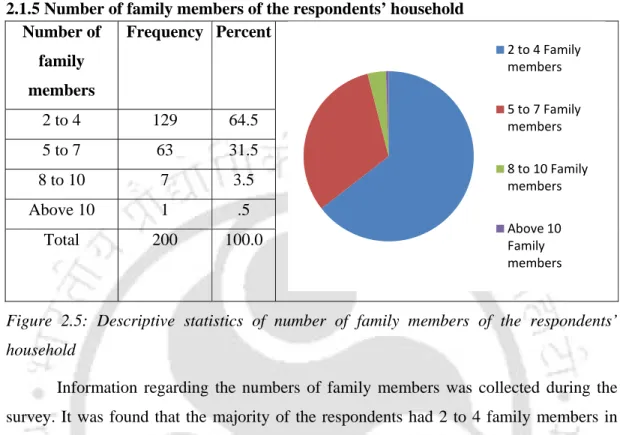
- Number of family members of the respondents’ household Number of
- Monthly household income of the respondents Monthly
It was found that most of the respondents had 2 to 4 family members in their household (64.5%). Majority of the respondents were from middle income group with monthly family income ranging from Rs.10,001 to Rs.25,000.
Design of kitchenware and food habit
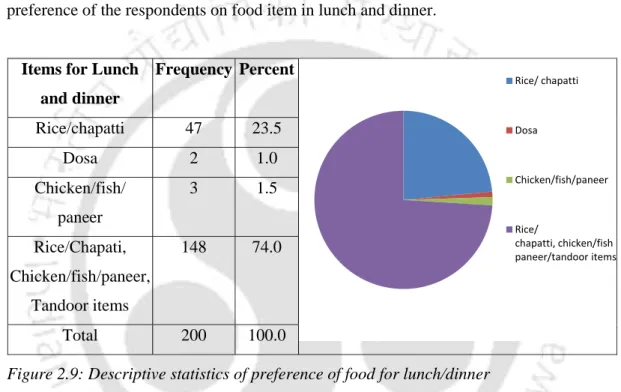
Preference of food for Lunch/Dinner
Following are the descriptive statistics of respondents' food preferences during lunch and dinner. The survey shows that most respondents prefer traditional Indian food for their lunch and dinner.
Availability of microwave oven/OTG etc
Perceived importance on variety of product features
Respondents were asked about the reasons why they do not prefer modern, sophisticated kitchenware such as microwave, Oven Toaster Grill (OTG) etc. It has been observed that the main factor that prevents people from buying modern, sophisticated new cookware is taste variety (27%).
Disliked activity in kitchen
Descriptive statistics of rating on ‘cooking’ activity Ratings on 5 point semantic
Again looking at the descriptive statistics we found that a total of 38% of respondents gave a rating of 5 and 20.5%.
Descriptive statistics of rating on ‘dishwashing’ activity Ratings on 5 point semantic
Therefore, we can conclude that respondents like cooking compared to the other activities in the kitchen. Therefore, we can conclude that respondents like dishwashing activities the most compared to the other activities in the kitchen.
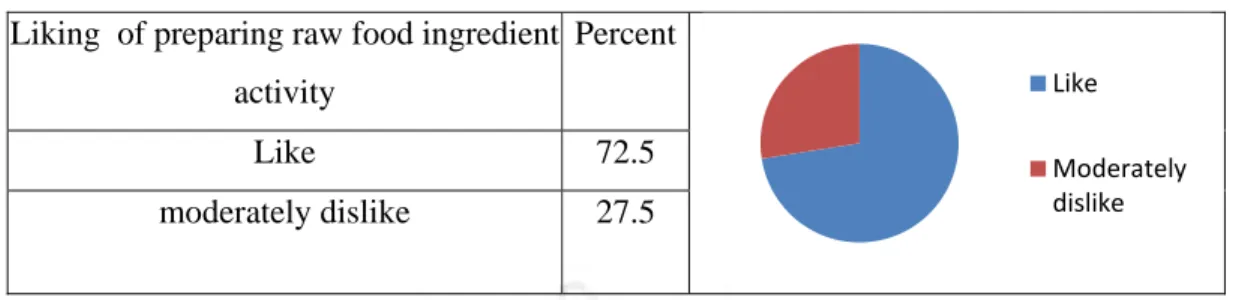
Descriptive statistics of rating on ‘Preparing raw food ingredients’ activity Ratings on 5 point semantic
Preference rating on materials of cookware, utensils and crockery
Preference rating on materials of cookware
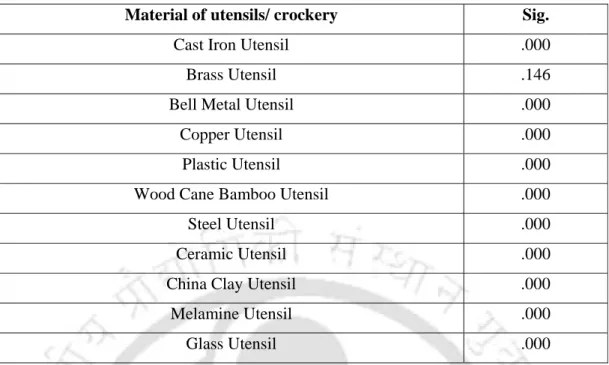
It has been observed that majority of respondents preferred non-stick cookware (mean: 0.8.97, mode: 10), followed by cast iron cookware (mean: 6.8, mode: 7). It is worth mentioning here that traditional Indian cookware is normally made of brass, bell metal and copper.
Preference rating on materials of utensils
Importance level on various attributes of cookware, crockery and utensils
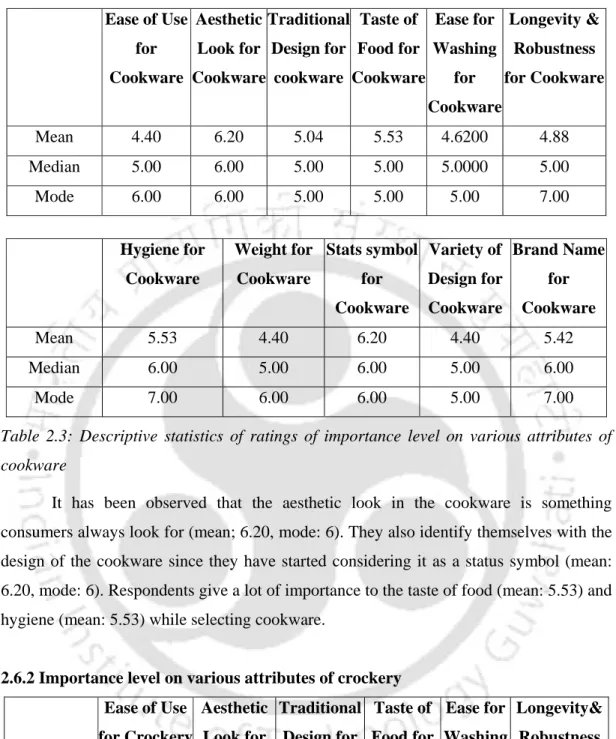
- Importance level on various attributes of cookware Ease of Use
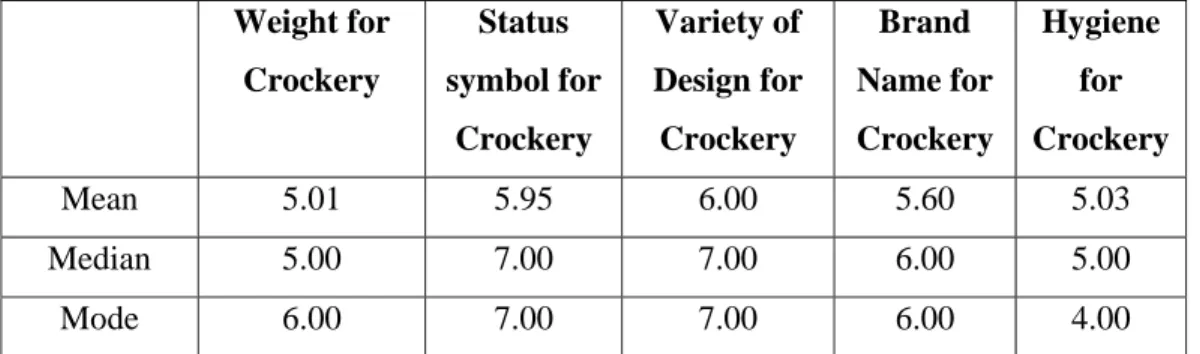
- Importance level on various attributes of crockery Ease of Use
- Importance level on various attributes of utensils Ease of Use
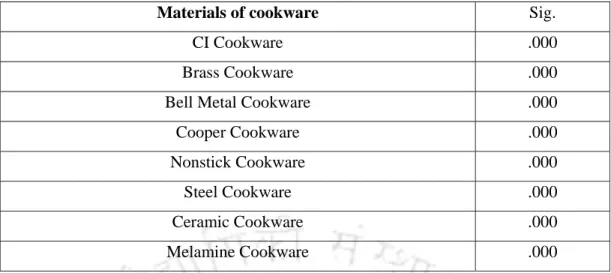
- Inferential statistics of preference ratings on various materials of cookware One way ANOVA was conducted for preference ratings on various materials of cookware
- Inferential statistics of ratings of importance level on various attributes of cookware
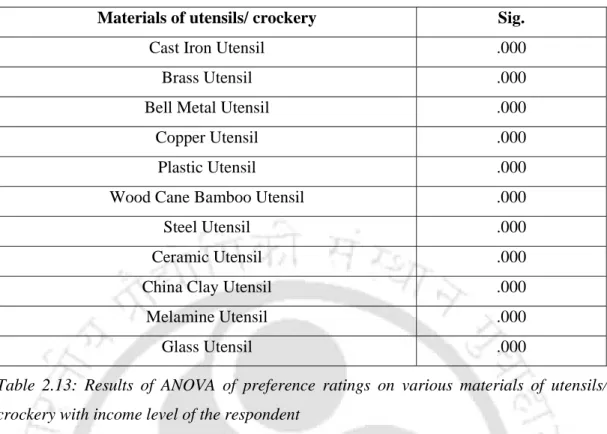
- Inferential statistics of preference ratings on various materials of utensils/
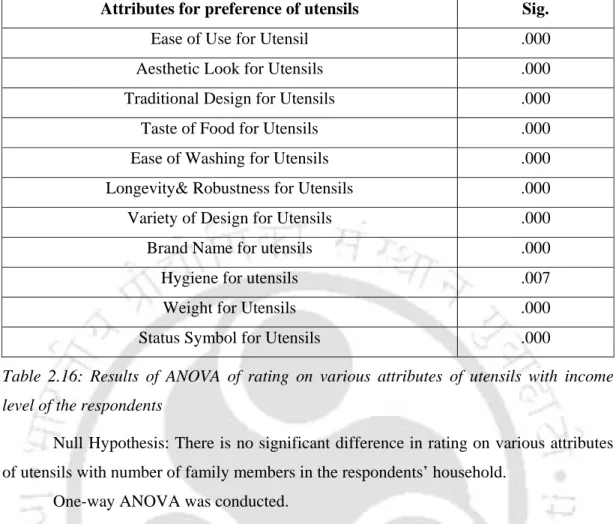
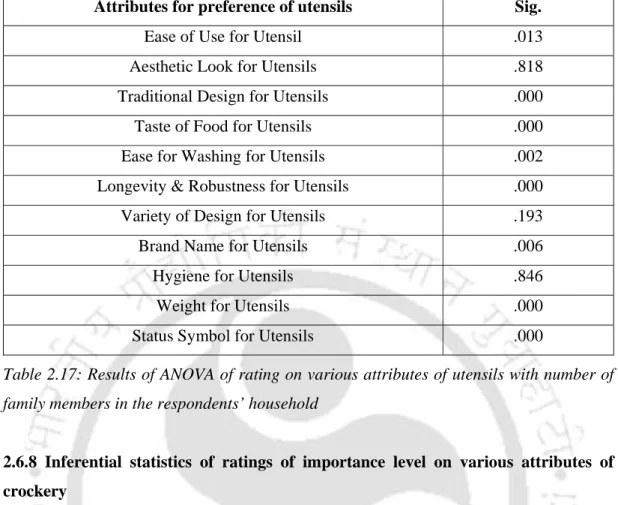
- Inferential statistics of ratings of importance level on various attributes of utensils
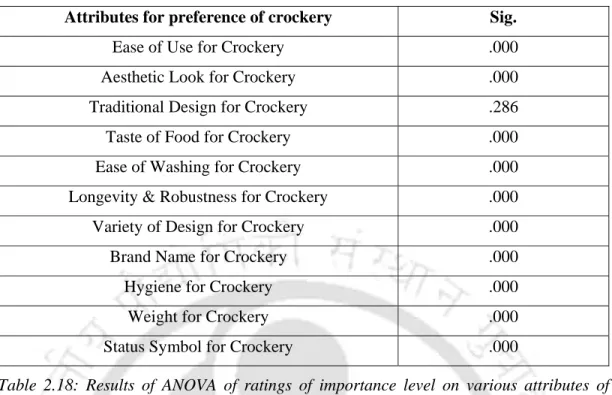
- Inferential statistics of ratings of importance level on various attributes of crockery
Null Hypothesis: There is no significant difference in the rating for various attributes of cookware with the number of family members in the household of the respondents. Null Hypothesis: There is no significant difference in the rating for various attributes of the dishes with the number of family members in the household of the respondents.
Conclusion of the study of consumer behaviour related to cookware, crockery and utensils
The research paper entitled 'The use of visual research method in the study of dishwashing process to identify design needs and idea generation' was presented at the 'Design Principles and Practices 2010' conference held at the University from 13 to 15 February 2010 of Illinois. , Chicago, USA This study attempts to understand the dishwashing process using visual research methods and other quantitative research methods.
The Dishwashing Process
Likewise, it is expected that a socially responsible solution to the dishwashing problem will not eliminate the domestic help. A socially responsible design solution to the dishwashing problem can improve the efficiency, health and hygiene and satisfaction level of people and therefore the capability will increase (AmartyaSen).
Consumer behaviour of the urban respondents
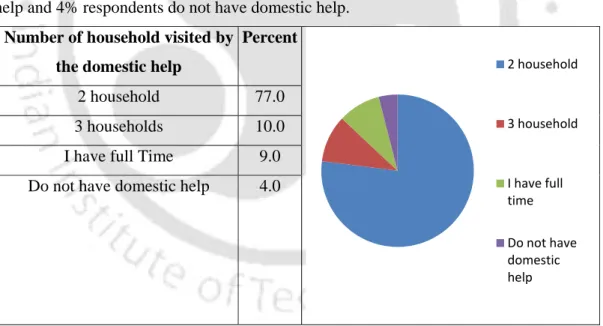
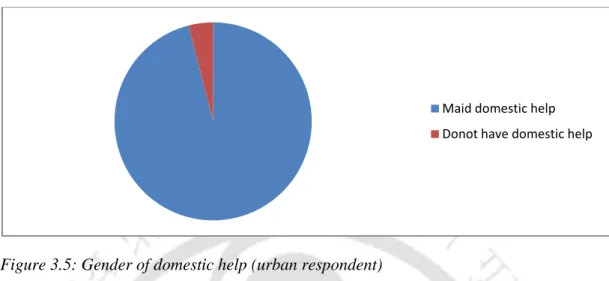
Domestic help related consumer behaviour (urban respondent)
Respondents were asked about their preference for part-time or full-time help in the home to perform various activities. It was observed that 98% of respondents prefer full-time domestic help to take care of children.
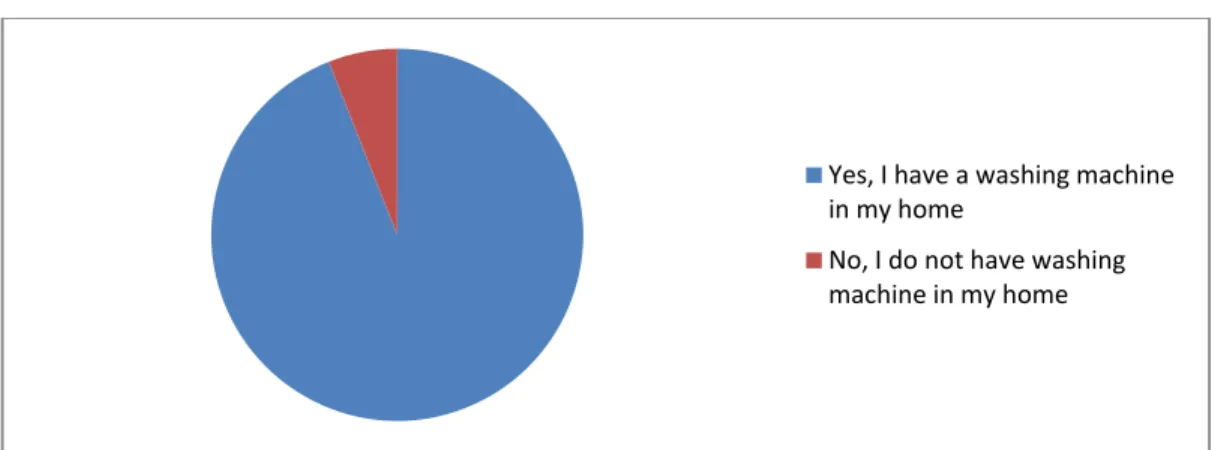
Consumer behaviour related to dishwasher/ washing machine (urban respondent)
Respondents were asked for their opinion about the dishwasher or washing machine as a replacement for household help. Only 10% of respondents believe that a dishwasher or washing machine can replace household help.
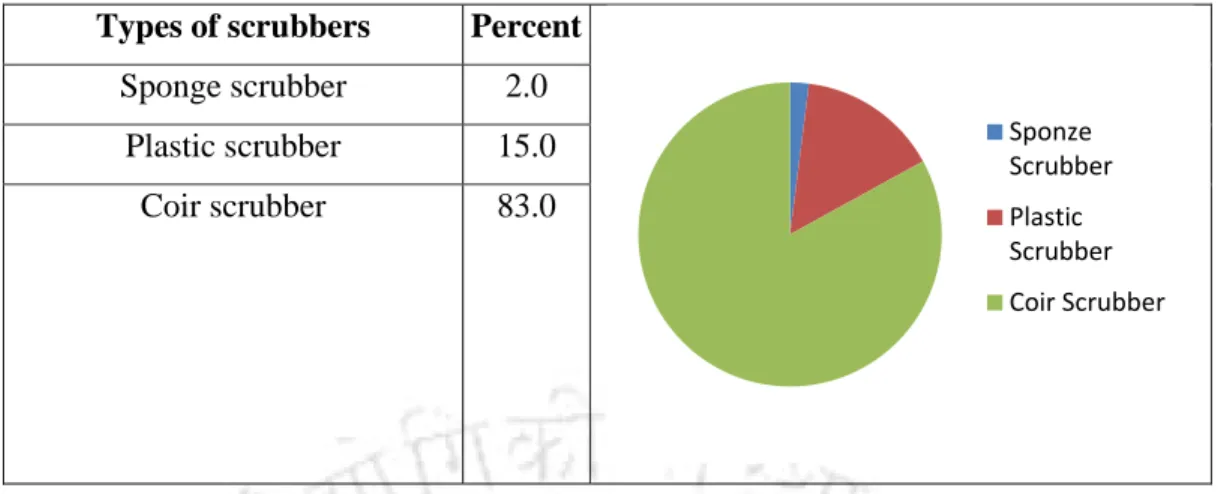
Consumer behaviour for scrubber (urban respondent)
A total of 84% of respondents highly rate the level of satisfaction with the plastic scrubbers available in the market. A total of 85% of respondents give the highest rating to the level of satisfaction with coconut scrubbers available in the market.
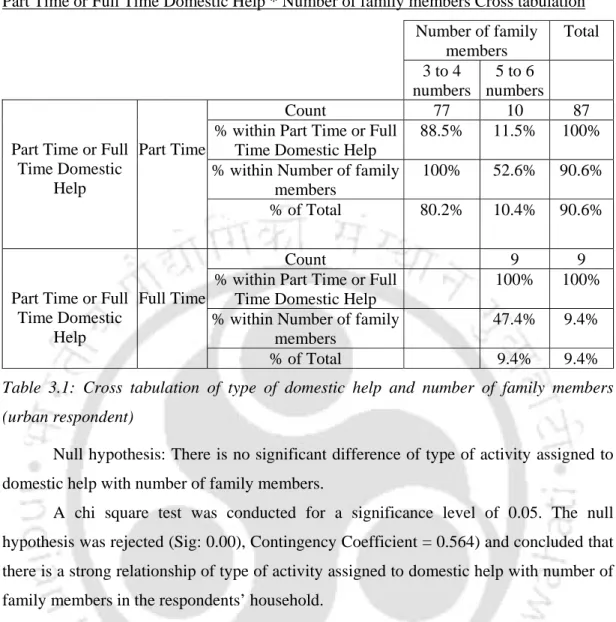
Relationship of dishwashing behavior with number of family members in the respondents’ household (urban respondent)
Null Hypothesis: There is no significant difference between the respondent's satisfaction with the sponge scrubber and the number of family members in the respondent's household. Null Hypothesis: There is no significant difference between the respondent's satisfaction with the steel scrubber and the number of family members in the respondent's household. Null Hypothesis: There is no significant difference between the respondent's satisfaction with the plastic scrubber and the number of family members in the respondent's household.
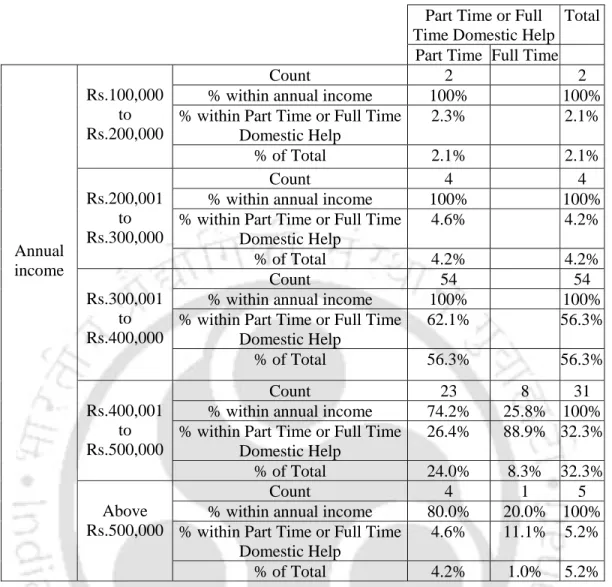
Relationship of dishwashing behavior with income level of the respondent
Null hypothesis: There is no significant difference between the respondent's satisfaction with the sponge washer and the respondent's income level. Null hypothesis: There is no significant difference between the respondent's satisfaction with the sample washer and the respondent's income level. Null Hypothesis: There is no significant difference between the respondent's satisfaction with the coconut washer and the income level of the respondent.
Consumer behavior of the rural respondents
- Likings and disliking about activities performed in the kitchen (rural respondent)
- Consumer behaviour for scrubber (rural respondent)
- Relationship of dishwashing behavior with number of family members in the respondents’ household
- Relationship of dishwashing behavior with income level of the respondent (rural respondent)
Null hypothesis: There is no significant difference between the respondent's level of satisfaction with the cleaning sponge and the number of family members in the respondent's household. Null hypothesis: There is no significant difference between the respondent's level of satisfaction with the coir washing machine with the number of family members in the respondent's household. Null hypothesis: There is no significant difference between the respondent's level of satisfaction with the plastic cleaner and the respondent's income level.
Visual research findings
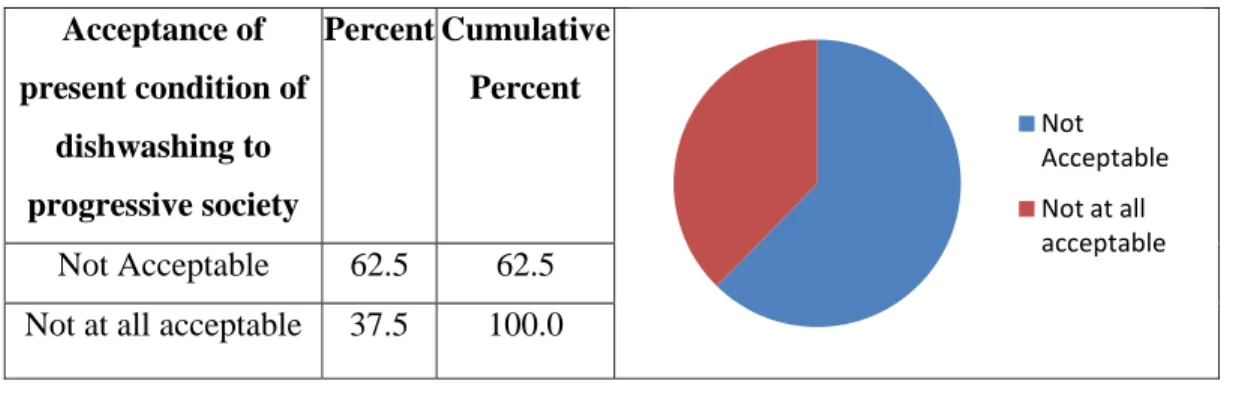
- Acceptance of present condition of dishwashing to progressive society
- Productivity and dishwashing
- Environment friendliness and dishwashing
- Hygiene and dishwashing
- Dishwashing and benefit to the poor
- Relationship of benefit to the poor with increase in productivity, environment friendliness and hygiene
Respondents were asked whether they thought the existing dishwashing process benefited the poor. It was found that 70% of respondents noted that the existing dishwashing process did not benefit the poor. A total of 20% of respondents noted that the existing dishwashing process did not benefit the poor at all.
Conclusion of the study of dishwashing related consumer behaviour
The ranking of the 'benefits to the poor' variable was found to vary significantly with respect to the other variables viz. A total of 90% of the respondents believe that the "benefit for the poor" component is completely neglected in the existing project solution to the washing problem. Again, 90% of respondents believe that engineers and designers should pay special attention to the problem of dishwashing.
The transformation of marketing research findings for design ideation with conventional sharing of marketing research findings (1st phase)
We have documented the findings of the marketing research of module I (study of consumer behavior in relation to kitchenware, tableware and accessories) and module II (study of consumer behavior in relation to dishwashing). The study of the transformation of marketing research findings for a design idea took place in two phases. In the first phase, designers were asked to generate design ideas for a dishwashing problem through a conventional exchange of market research findings.
The transformation of marketing research findings for design ideation with Marketing-Research-Finding Sensitive Visualisation (MRFSV) method for product
Marketing Research Findings Sensitive Visualization (MRFSV). Description of Designer's design solution to the design problem) MRI findings 1.
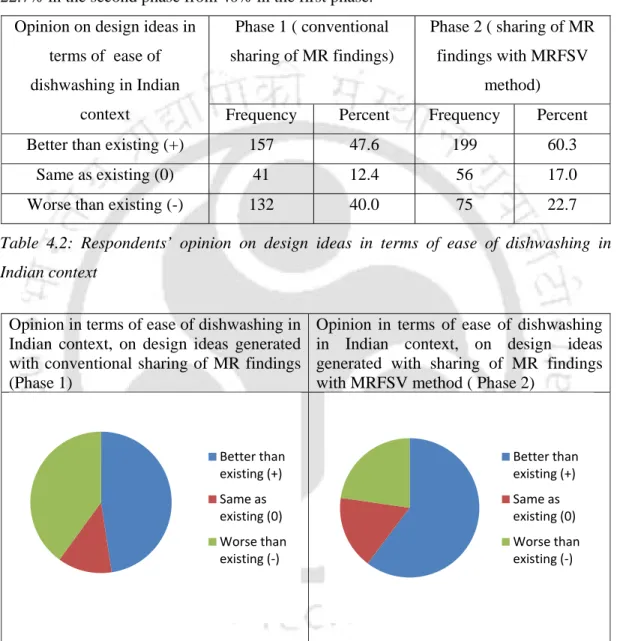
Comparative evaluation of design ideas generated in the 1st phase (conventional sharing of marketing research findings) and the 2 nd phase (sharing of marketing
- Evaluation of design ideas considering ease of dishwashing in Indian context It has been observed that the design ideas generated in the second phase have
- Evaluation of design ideas considering ease of use
- Evaluation of design ideas considering ergonomics
- Evaluation of design ideas considering ease of manufacture and assembly It has been observed that the design ideas generated in the second phase have just slightly
- Evaluation of design ideas considering aesthetic appeal/ design variety
- Evaluation of design ideas considering economic and financial feasibility
- Evaluation of design ideas considering environment friendliness
Ease of use feedback on design ideas generated by sharing MR findings with the MRFSV method (Phase 2). Opinion in terms of ergonomic consideration, on design ideas generated by sharing MR findings with the MRFSV method (Phase 2). Opinion in terms of ease of manufacture and assembly, on design ideas generated with conventional sharing of MR findings (Phase 1).
Relationship and variance in ranking of design ideas generated in the 1st phase (conventional sharing of marketing research findings) and 2nd phase (sharing of
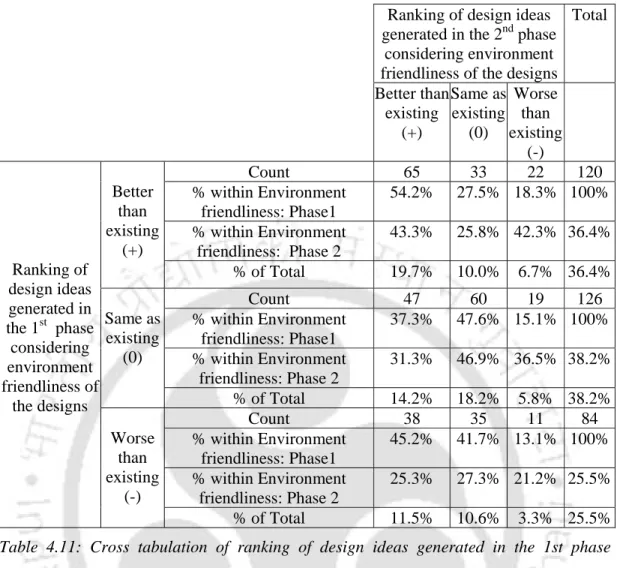
Cross tabulation of ranking of design ideas generated in the 1st phase (conventional sharing of marketing research findings) and 2nd phase (sharing of
Null hypothesis: There is no significant difference in the collection of design ideas generated in the first phase (conventional sharing of market research results) and second phase (sharing of marketing research results with the MRFSV tool) in terms of ease of use. 131 Null hypothesis: There is no significant difference in the collection of design ideas generated in the first phase (conventional sharing of market research results) and second phase (sharing of marketing research results with the MRFSV tool) in terms of ergonomic considerations. Null hypothesis: There is no significant difference in the collection of design ideas generated in the first phase (conventional sharing of market research results) and second phase (sharing of marketing research results with the MRFSV tool) in terms of economic and financial feasibility.
Cross tabulation of ranking of design ideas generated in the 1st phase (conventional sharing of marketing research findings) and 2nd phase (sharing of
Cross tabulation of ranking of design ideas generated in the 1st phase (conventional sharing of marketing research findings) and 2nd phase (sharing of
The research shows that of the designs assessed as 'better than existing' in the first phase, a total of 54.2% of design ideas were assessed as 'better than existing' and in the second phase 27.5% of the design ideas were assessed as 'better than existing' in the second phase. ideas as 'same as existing'. Of the designs rated as 'worse than existing' in the first phase, a total of 45.2% of design ideas were rated as 'better than existing' and in the second phase 41.7% of designs were rated as 'the same assessed as existing'. 135 4.4.5 Comprehensive summary of the relationships and variances in the ranking of design ideas generated in the 1st stage (conventional sharing of market research results) and 2nd stage (sharing of market research results with MRFSV tool) The following table shows the results of the chi - square conducted tests to observe the relationships and variances in the ranking of design ideas generated in the first stage (conventional sharing of market research results) and second stage (sharing of marketing research results with the MRFSV tool), using different features for the screening of design ideas in be taken into account.
Comparison of total scores of design ideas generated in the 1st phase (conventional sharing of marketing research findings) and 2nd phase (sharing of
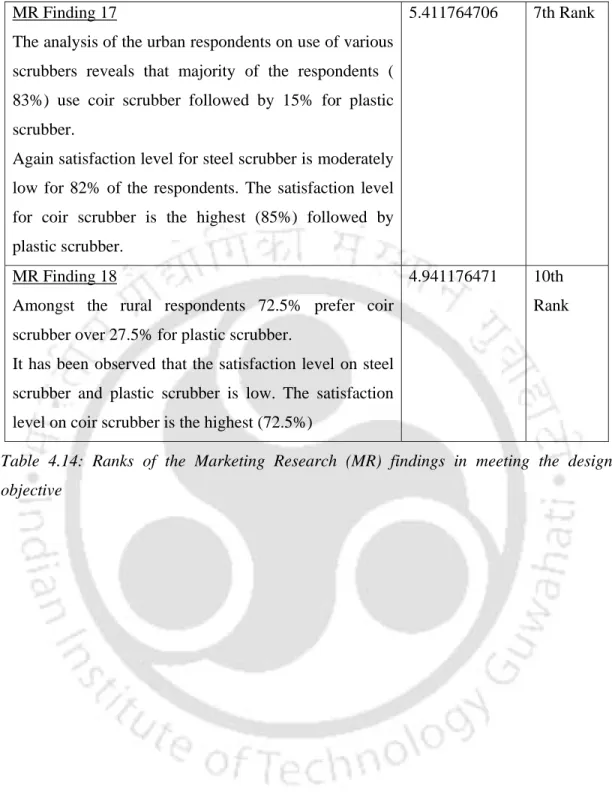
Ranks of the Marketing Research (MR) findings in meeting the design objective Designers were asked to give weightages to each MR findings out of a total score of 100
The participation of domestic help in the design of kitchen utensils and the design of the built-in kitchen is extremely low. Interestingly, it was found that many of the household tools help using thin metal sheets of used medicine tablets as a cleaner instead of iron wire mesh. Analysis of urban respondents on the use of different cleaners reveals that most of the respondents (83%) use coir cleaners followed by 15% for plastic cleaners.
Conclusion
The study reveals that conventional communication of consumer behavior to the designers can move the designers away from the design goal. This method helps establish a direct relationship between the defined design problem and the designer's design solution. The synthesis of all marketing research that finds sensitive visualizations generates wonderful design ideas that ultimately lead to a complete design solution that meets the design goal.
Recommendation and suggestion
MRFSV is concerned with generating ideas for product design at all levels of the design process viz. Future research can be conducted to observe the efficiency of the instrument at all four levels. Quantitative analysis can be performed on the recorded data for further interpretation and refinement of the design.
The MRFSV method is concerned with generating ideas for product design at all levels of the design process viz. MR finding 8 In the kitchens of urban households, dishes are normally washed standing.
Product Design
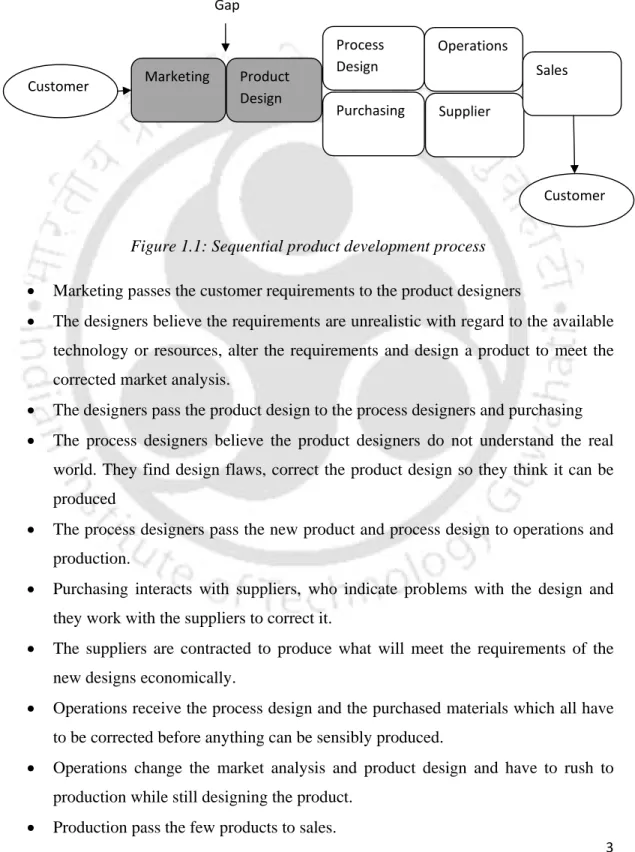
Marketing and Product Design
They find design flaws, fix the product design to make them think it can be manufactured. Operations receive a process design and purchased materials, all of which must be fixed before anything meaningful can be produced. Operations change market analysis and product design and must rush production while still designing the product.
Product Development Decision framework
Sales get a suggested price and a forecast from the marketing team, but they are not happy with selling what the customer does not want: 'sub-standard'. There is a need for extensive research to minimize these barriers so that products can be designed that meet customer expectations. Project Management Table 1.1: Comparison of perspectives from the academic communities in marketing, organizations, engineering design, and operations management.
New Product Development and Marketing Interface: Product performance and Time-to –market
Cohen and Jehoshua Eliashberg (1996) of the Wharton School, University of Pennsylvania proposed a model of new product development process. Allocation of uniformly distributed efforts at all stages of the new product development process is not suggested. More emphasis on efforts at the most productive stages of the new product development process is required.
The R&D- Marketing Interface in New Product Development process
This was achieved through a highly structured method of communicating marketing research findings to the designers. But the marketing research team typically conducts consumer behavior research using structured questionnaires or other qualitative and quantitative methods. The effort of this research is to maximize the benefits of these marketing research results to the product development team.
Effectiveness of the Marketing research findings: Practice and contradiction The American Marketing Association has defined Marketing Research as the function
The Marketing Research results had shown that the Stella Artois beer ad would be a failure, but the ad turned out to be very successful (Marketing, May 8, 2003). However, management at Stella Artois believed that the ad was good and the marketing research was flawed. Case studies of marketing research that predicted success but turned out to be failures.
Marketing Research in Product Design
The owner relied on local school data and statistics from a company that requested advertising for her marketing research. A product idea takes shape during marketing research and the definition of market requirement specification (Rafinejad Dariush, 2009, Armstrong Stephen C, 2001). A need is felt to review the marketing research process and critically examine the various factors that contribute to the effectiveness of marketing research in formulating design solutions.
Identifying customer needs