Proximate and final analysis confirmed more volatile matter, higher carbon content and lower ash and nitrogen content. FTIR analysis suggested the presence of hemicellulose, cellulose and lignin while XRD analysis confirmed the amorphous nature of the biomass. TD analysis of these biomasses confirmed that the change in activation energy and enthalpy indicated favorable product formation.
The results confirmed that with an increase in the number of biomass beds at optimized condition, the liquid yield was higher, but further increasing biomass beds resulted in reduced liquid yield and increased char formation. Characterization results confirmed that the introduction of catalysts improved the properties of pyrolytic oil by reducing viscosity, density, oxygen content and increasing the heating value. GC-MS analysis confirmed that the introduction of catalysts significantly reduced oxygenate compounds and increased alcohol, aldehyde and hydrocarbons.
The co-pyrolysis of NM and WNG was carried out in a cylindrical semi-batch reactor. The physicochemical results of NM and WNG confirmed that a mixture of the two significantly changed the yield of the pyrolytic liquid and enhanced the properties of the fuels.
1-18
Introduction
Biofuel Options in India
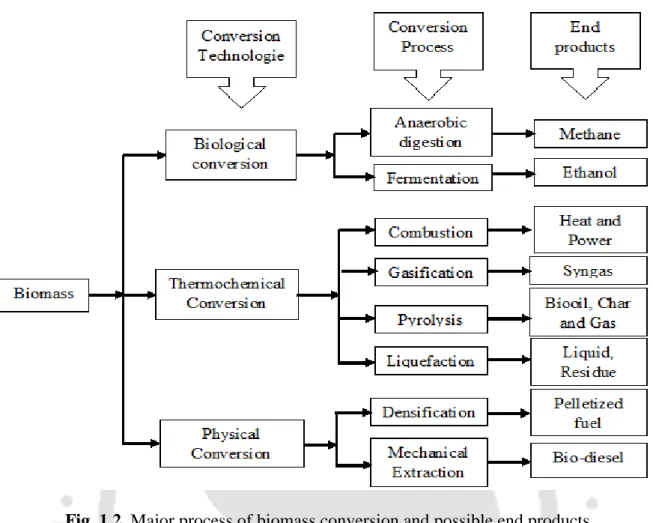
Biomass Conversion Technologies
Thermochemical Conversion Technology
- Combustion
- Gasification
- Pyrolysis
- Liquefaction
Biomass as a Source of Renewable Energy
Chemical Composition of Biomass
- Macromolecular substance
- Low molecular weight substance
Major Advantage and Disadvantage of Biomass
Mechanism of Biomass Pyrolysis
- Removal of moisture
- Primary decomposition
- Char formation
- Depolymerization
- Fragmentation
- Secondary reaction
Classification of Pyrolysis
- Slow pyrolysis
- Intermediate pyrolysis
- Fast pyrolysis
- Flash and vacuum pyrolysis
19-50
Importance of Pyrolysis
Biomass
- Source of biomass
Available Biomass Resources in India
Why Biomass or Waste Biomass?
Why Non-edible Biomass?
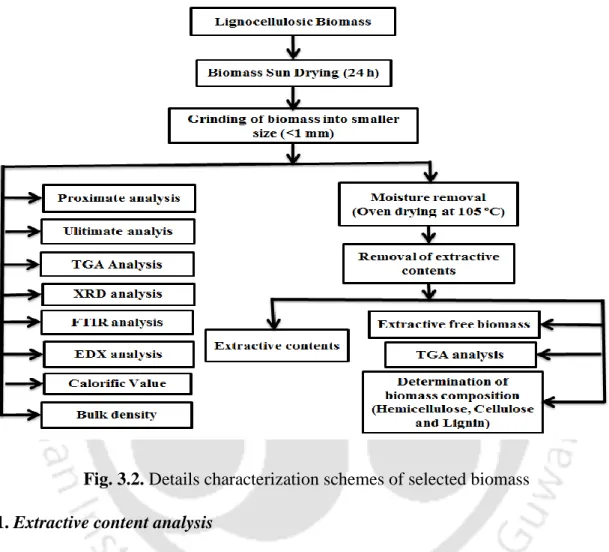
Characterization of Biomass
Pyrolysis Kinetics of Biomass
Effect of Process Parameters on Pyrolysis
- Effect of temperature
- Effect of heating rate
- Effect of particle size
- Effect of sweeping gas flow rate
- Effect of other process parameters
- Effect of catalyst on pyrolytic liquid yield
- Effect of catalyst on the composition of the pyrolytic liquid
Properties of Pyrolytic Oil
- Calorific value
- Viscosity
- Acidity (pH)
- Moisture
- Density
Co-pyrolysis of Biomass and Waste Plastic
Characterization of Biochar
The source, Availability, and Production of Non-edible Seeds in India
Knowledge Gaps
Aim and Objectives
51-73
Samples Collection and Preparations
Characterization of Raw Materials
- Extractive content analysis
- Proximate analysis
- Ultimate analysis
- Calorific value and bulk density
- Biofuel reactivity
- Van Krevelen plot
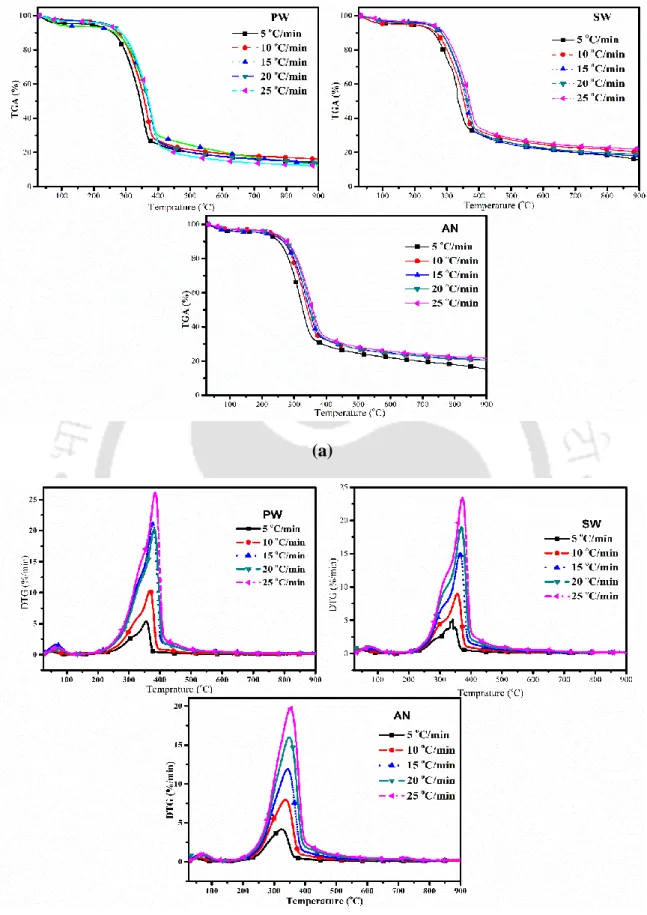
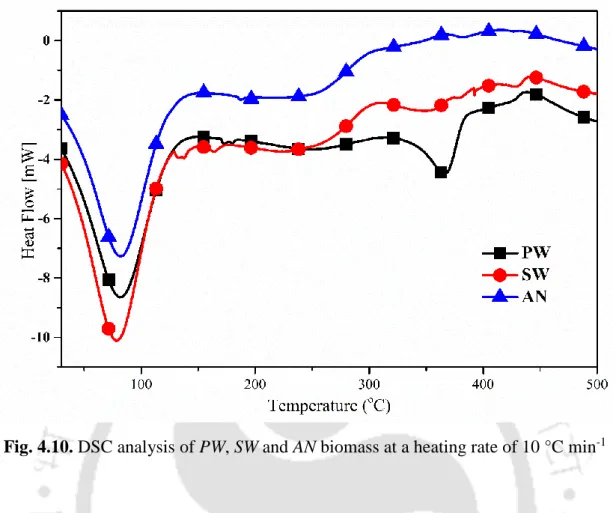
- Thermogravimetric and compositional analysis of biomass
- Change in activation energy over raw and extractive free biomass
- XRD analysis
- EDX analysis
- FTIR analysis
- X-ray fluorescence (XRF) analysis of residual content
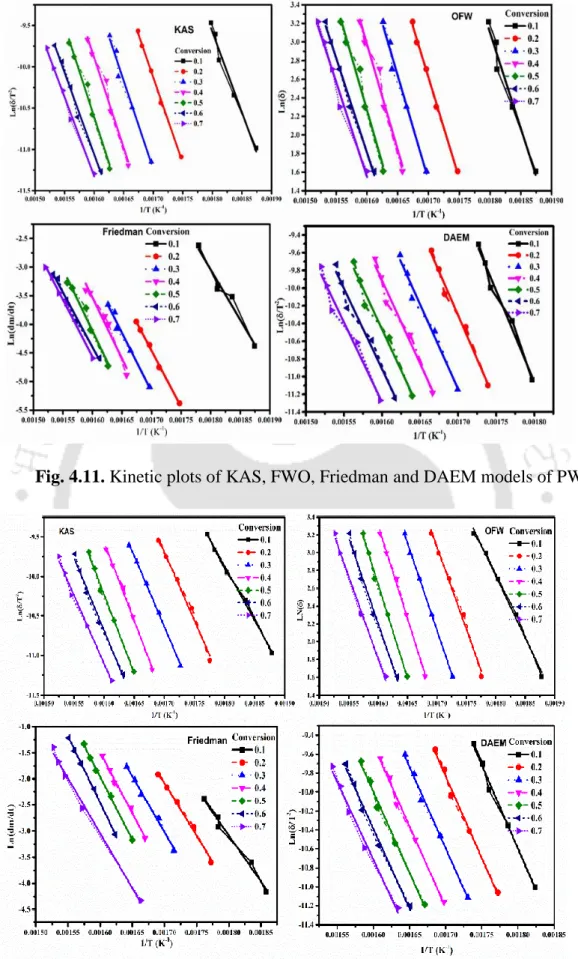
- Differential scanning calorimetry (DSC) analysis
Synergistic Effect on NM and WNG
Kinetic Theory
- Kissinger–Akahira–Sunose (KAS) method
- Ozawa–Flynn–Wall (OFW) method
- Friedman method (FM)
- Coats-Redfern method (CR)
- Distributed Activation Energy Model (DAEM)
Thermodynamic Analysis (TD)
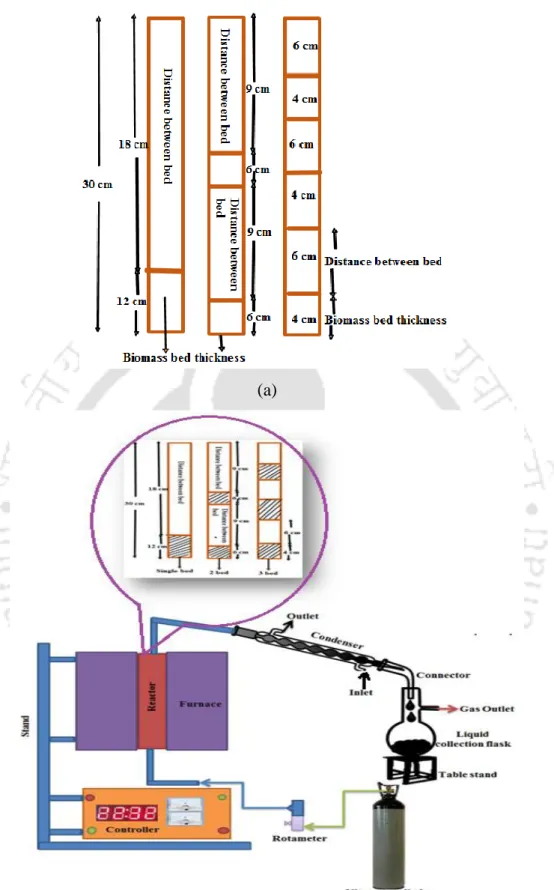
Experimental Procedure for Thermal Pyrolysis
Experimental Procedure for Catalytic Pyrolysis
Experimental Procedure for Co-pyrolysis
Characterization of Pyrolytic Oil
- Elemental analysis of pyrolytic oil
- Viscosity
- Heating value
- Acidity, density, and moisture of pyrolytic oil
- FTIR analysis of pyrolytic oil
- Gas Chromatography-Mass Spectrometry analysis (GC-MS)
- Gas Chromatography (GC) analysis
Biochar Characterization
- Acidity, oxidation-reduction potential (ORP) and electrical conductivity (EC) 72
- Water holding capacity (WHC)
- Surface area analyzer (BET)
- Biochar morphology (FESEM)
Characterization of Raw Biomass
- Physicochemical characterization of biomass
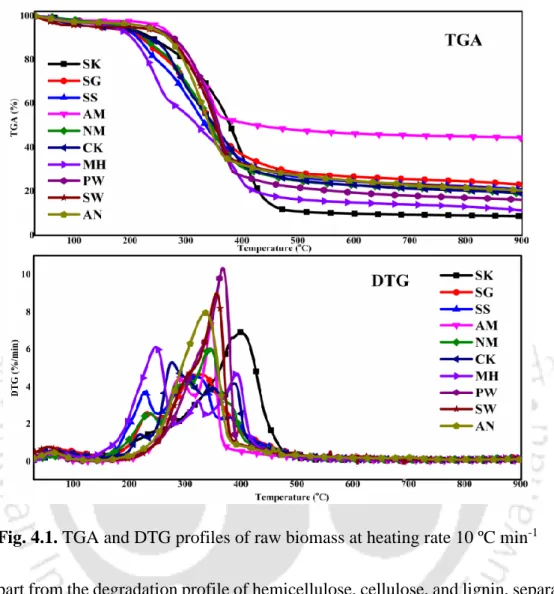
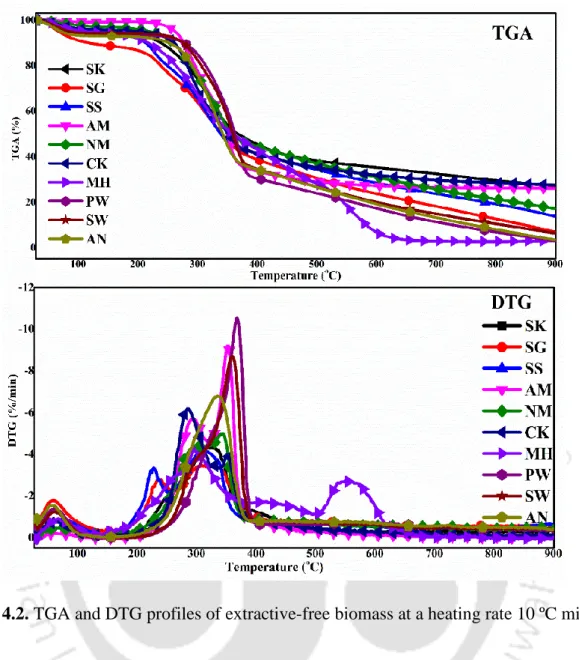
- Thermogravimetric analysis (TGA)
- Variation in activation energy of fresh and extractive free biomass
- Van Krevelen diagragram
- Biofuel reactivity
- Energy Dispersive X-ray analysis
- XRD analysis
- FTIR analysis
- Slagging and fouling indices and ash deposition tendencies of residual biomass
Kinetic and Thermodynamic Analysis of Biomass
- Burnout temperature
- Thermal analysis of biomass
- Effect of heating rates on biomass decomposition
- Differential scanning calorimetric analysis of biomass
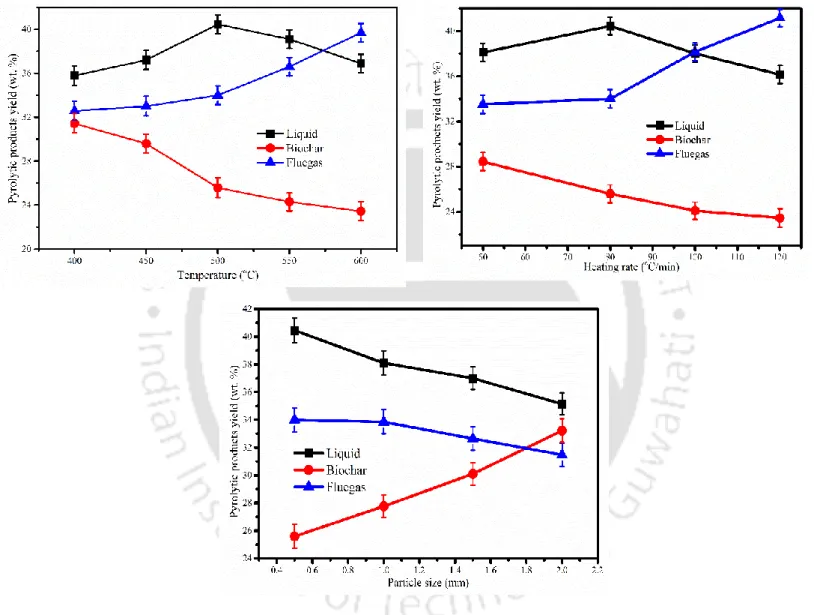
- Kinetic analysis
- Kinetic parameter by using DAEM model
- Thermodynamic analysis
111-143
Thermal Pyrolysis of Selected Biomass
- Optimization of process parameters
- FTIR analysis of thermal pyrolytic oil
- Characterization of thermal pyrolytic oil
- GC-MS analysis
Furthermore, the obtained pyrolytic oil was characterized using various techniques such as FTIR and GC-MS analysis. At a lower heating rate of 50 oC min-1, the liquid yield was reduced due to incomplete pyrolysis of biomass. Thermal pyrolytic oil was characterized and compared with diesel fuel and gasoline [219] and listed in Table 5.2.
Results confirmed that all thermal pyrolytic oil had higher viscosity (39.45 cSt) which affected the stability and reduced the fluidity of pyrolytic oil. Results also confirmed that pyrolytic oil had a higher viscosity than sawdust, as this happened due to the variation in the composition of biomass. Furthermore, the heating value of all pyrolytic oil varied from 23.20 MJ kg-1 - 28.32 MJ kg-1 which means that this oil can be used as furnace fuel.
The acidity of thermal pyrolytic oil varied from mostly acidic which reduced the heating value of fuel [33]. The chromatograph obtained from thermal pyrolytic oil of all biomass by GC-MS analysis was compared with NIST library and presented in Fig. The pyrolytic oil contains more than 300 different types of organic compounds due to its diverse nature.
Pyrolytic oil is a complex mixture of highly oxygenated compounds of large molecular size, which includes almost all types of oxygenated organics, such as esters, ethers, aldehydes, ketones, phenols, carboxylic acids, amide groups and alcohols. Further, it was observed that thermal pyrolytic seed oil had higher amount of hydrocarbons than sawdust. Almost all pyrolytic oil associated with oxygenated compounds such as ethers, esters and ketones, which had a negative impact on pyrolytic oil when the intended use is as a transportation fuel.
Also thermal pyrolytic oil associated with various other compounds such as octadecanenitrile, oleanitrile, 9-octadecenoic acid methyl ester, stearic acid methyl ester, heptadecane, 9-octadecenamide, 11-hexadecenal and pentadecane etc. Most of these compounds can be used in a variety of applications that increase the value of pyrolytic oil. GC-MS analysis of thermal pyrolytic biomass oil PW, SW, AN, SG, SK, CK, MH, NM and SS.
Effect of Biomass Bed Thickness and Height on Pyrolytic Products Yield
- Process parameters optimization
- Effect of biomass bed thickness and distance between successive beds on pyrolytic
- Characterization of pyrolytic oil
- FTIR analysis pyrolytic oil
- Gas Chromatography (GC) analysis of pyrolytic gases
- GC-MS analysis of pyrolytic oil
Further increasing the number of beds beyond the optimum bed decreased the formation of gaseous products (Fig. 5.12b). The change in gaseous yield was observed due to the formation of secondary reactions, which changed volatile gases to non-condensable gases during pyrolysis. During secondary cracking, the biomass fragmented into non-condensable gases, which resulted in the formation of higher gases.
Possible initiation of secondary cracking led to the formation of higher charcoal yield due to the increase in vapor residence time. At optimized bed condition, biomass offered higher heat and mass transfer, resulting in the reduction in biochar and non-condensable gases. The pyrolytic oil has a strong brown color with a viscous nature, while the aqueous phase looks like a slightly cloudy yellow-brown solution.
The formation of the secondary reaction may be one of the possible reasons for the change in density. The heating value of the pyrolytic oil in the optimized condition was higher than the first and sixth beds, because in the optimized conditions the formation of acidic compounds was reduced (as evidenced by GC-MS analysis). Thus, it can be concluded that hydrogen and hydrocarbons increased significantly with increasing temperature and at the same time, carbon dioxide formation decreased with increasing pyrolysis temperature.
When pyrolysis temperature increased from 400 oC to 600 °C, the formation of more hydrogen and hydrocarbons was observed. The results shown in Fig. 5.15 presented showed the formation of phenol, ester, alcohol, ketone, aromatics, aldehyde, carboxylic acid and amide during pyrolysis. The produced pyrolytic oil was associated with several valuable chemicals such as nitrile, methyl ester, carboxylic acid methyl ester, heptadecane and amide. chemicals in pyrolytic oil have already been described earlier.
In the first and sixth beds, the thickness of the beds was higher, which prevented the release of volatiles. At the same time, the residence time of volatile compounds increased, leading to the initiation of secondary cracking reactions and subsequent formation of phenolic compounds. Research on the pyrolysis of pine wood biomass in a fixed bed reactor (two-stage method) to improve hydrocarbon yield and reported that at moderate temperature (600 °C) the formation of phenolic compounds and acids was higher. The study also suggested that pyrolysis of wood biomass resulted in the formation of higher phenolic compounds at higher temperatures [228].
Catalytic Pyrolysis of Cascabela thevetia Seeds
- Process parameter optimization
- Optimization of biomass to catalysts (B/C) ratios
- Characterization of pyrolytic oil
- FTIR analysis of pyrolytic oil
- GC-MS analysis
144-160
Thermocatalytic Co-pyrolysis of Biomass and Waste Nitrile Gloves
- Characterization of Neem Seeds and Waste Nitrile Gloves
- Thermal Analysis of NM and WNG
- Synergistic Effect and Reactivity of NM+WNG along with Catalysts in Different
- FTIR Analysis of Raw Sample
- Process Parameter Optimization and Co-Pyrolysis
- Effect of Catalysts on Thermal Decompostion Profile of NM+WNG at Different
- Physicochemical Characterization of Pyrolytic Oil
- FTIR Analysis of Pyrolytic Oil
- GC-MS Analysis of Pyroytic Oil
Characterization of Biochar
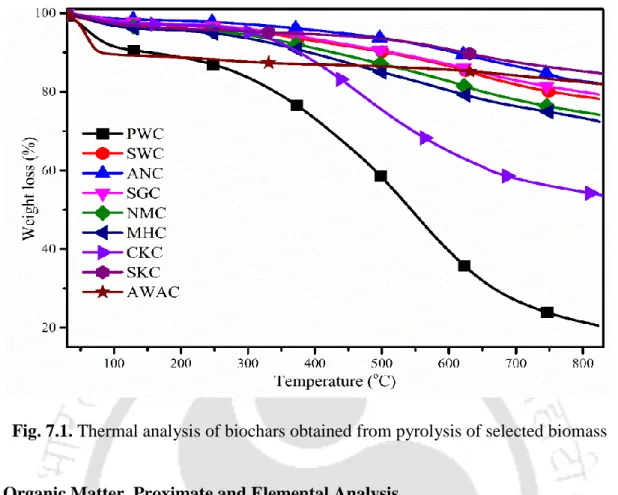
- Thermal Analysis of Bioachar
- Organic Matter, Proximate and Elemental Analysis
- Particle Size, Zeta Potential, Acidity, Oxidation and Reduction Potential (ORP) and
- Bulk Density and Specific Gravity
- Water Holding Capacity and Surface Area Analysis
- FESEM Analysis of Biochar
- Van Krevelen Diagram
- Biochar Reactivity
- FTIR Analysis of Biochar
7.1 it was found that temperatures up to 120 oC, moisture and easily volatile substances were removed in the first stage. From the table, it was confirmed that the organic matter of all biochars differed, which showed that these biochars can be used for soil improvement. The results also found that all biochars had lower nitrogen content, but no sulfur, which indicated that there would be less SOx and NOx gases during combustion.
Particle size, Zeta potential, acidity (pH), oxidation and reduction potential (ORP) and electrical conductivity (EC) of Biochars. From the table, it was confirmed that all biochars had smaller particle sizes (21.29 nm - 3895.7 nm), which were smaller than those reported by Yargicoglu et al. The results showed that CKC biochar had a particle size of 3895.7 nm had, leading to a larger surface area (20.26 m2 g-1) compared to other biochars listed in Table 7.1.
It has been reported that the more negative the zeta potential, the higher the pollutant removal will be [123]. From the results (Table 7.1), it was confirmed that all biofuels had a lower bulk density (221 kg m-3 - 614 kg m-3) which may create difficulties in storage and transportation. From the results, it was observed that WHC differed from which indicated that it can be used for soil reinforcement and as fertilizer.
In addition, these FESEM images appear as honeycombs with different pore diameters on the biochar surface. It was also found that AWAC biochar has a uniform and smooth surface, while other biochars have a rough and variable surface. 7.2 it was confirmed that the temperature of 450 oC - 850 oC caused the formation of micropores, which is the result of the phenomenon when the micropores are filled with tars (condensed volatile substances) and other degradation products that partially block the porosity [244].
It was confirmed that the hydrogen to carbon ratio (H:C) varied from which was similar to that reported by Yargicoglu et al. 7.3, it was confirmed that among all the biofuels, ANC had the highest H:C ratio which indicated that the combustion of ANC as a solid fuel will be much easier compared to other biofuels. From the results (Fig. 7.4), it was confirmed that biochar having a higher ratio of volatile matter to fixed carbon was more reactive than that having a lower ratio of volatile matter to fixed carbon.
173-176
Conclusions and Recommendations for Future Study
- Conclusions
- Recommendations for future investigation
The present study demonstrated the potentials of Cascabela thevetia seeds, Delonix regia seeds, Samanea saman seeds, Phyllanthus emblica kernel, Azadirachta indica seeds, Manilkara zapota seeds, Madhuca longifolia seeds, Pinus hucashu production and Pinus ponderosa rocachutachus sawdust. renewable fuels and value-added chemicals. FTIR analysis confirmed the presence of useful compounds such as phenol, aromatic, alcohol, ether, ester and acid. The study of the effect of biomass bed thickness and the distance between beds confirmed that the yield of pyrolytic liquid changed with the increase in the number of biomass beds for single bed, double bed, triple bed, fourth bed, fifth bed and sixth bed .
The results of the catalytic pyrolysis confirmed that the efficiency of the pyrolytic liquid increased with different B/C ratios. Copyrolysis of waste nitrile gloves with biomass seems to be one of the prominent ways to reduce waste and increase economy. The physicochemical results of NM and WNG confirmed their potential for the production of fuels and chemicals with added value.
It was observed that co-pyrolysis of NM and WNG increased liquid yield along with improved fuel properties. Biochar characterization confirmed the presence of higher organic matter, volatile matter and carbon content. The present study emphasizes the use of biomass towards the production of valuable fuels and chemicals.
To develop a new mathematical model to investigate the pyrolysis characteristics of biomass using thermogravimetric analysis which produces minimal or negligible error. Park, J., et al., Slow pyrolysis of rice straw: Analysis of product properties, carbon and energy yields. Kim, Current Developments in Thermochemical Conversion of Biomass to Fuels and Chemicals, in Gasification to Low-Grade Feedstock.
Sundaram, Preparation and characterization of pyrolytic oil by pyrolysis of neem seed and study of performance, combustion and emission properties in CI engines. Butler, E., et al., A review of recent laboratory research and commercial developments in fast pyrolysis and upgrading. Huang, Y.-F., et al., Microwave pyrolysis of rice straw to produce biochar as adsorbent for CO2 capture.