The Bengal-Bangladesh Borderland:
Chronicles from Nadia, Murshidabad and Malda
1Paula Banerjee
Introduction
Borderland studies, particularly in the context of South Asia are a fairly recent phenomenon. I can think of three works that have made borderlands, particularly the Bengal-Bangladesh borderland as the focal area of their study in the last one decade. Ranabir Samaddar’s The Marginal Nation:
Transborder Migration From Bangladesh to West Bengal started a trend that was continued by Willem Van Schendel in his The Bengal Borderland: Beyond State and Nation in South Asia.
Both these books argue that the border is part of larger zone or the borderland that at once constructs and subverts the nation. Samaddar goes beyond the security and immutable border discourse and problematises the borderland by speaking of flows across the border. He argues that such flows are prompted by historical and social affinities, geographical contiguity and economic imperative. People move when their survival is threatened and rigid borders mean little to the desperate. They question the nation form that challenges their existence. If need be they find illegal ways to tackle any obstacle that stand in their path of moving particularly when that makes the difference between life and death. Thereby Samaddar questions ideas of nation state and national security in present day South Asia when and if it privileges land over the people who inhabit that land. Van Schendel also takes the argument along similar lines by stating that without understanding the borderland it is impossible to understand the nation form that develops in South Asia, the economy that emerges or the ways in which national identities are internalized.
Van Schendel challenges the glib assumption that globalization has done away with borders and also questions the penchant of analyzing societies, identities and nations as fixed.
Joya Chatterjee in Bengal Divided argues that to understand the boundary formed by partition one needs to dig beyond received histories. She is of the opinion that one needs to look at Hindu communalism for the act of partition rather than at Muslim communalism. The Radcliff line she says was not surgically crafted but evolved through other forms of practices. Accepting Joya’s arguments about essentials of historical analysis I have tried to push Samaddar’s and Van Schendel’s arguments further in my book on Borders, Histories, Existences: Gender and Beyond where I have suggested that borderlands are often sites of exclusion/inclusion in the context of South Asia. This is because there the national will to exclude and include is played out. I analyse
1 I am grateful to Shri Rajat Kanti Sur for helping me with the research for this paper. I am also grateful to Shri Ramen Moitro of Shikarpur and Dr Ananda Bhattacharya of West Bengal State Archives.
how state constructs borders and try to make them static. This stasis is disturbed by bordered existences of whom, women, migrant workers, trafficked bodies, victims of HIV/AIDS are all parts whose survival is carried out within a milieu of endemic violence. The tussle in the borderlands is often on the question of who controls. In this paper I want to address an issue that I have not addressed to this extant previously. I want to look at this notion of flows and how that impacts on notions of security. With every election and every census borders become an issue.
The concern remains over undocumented migrants and whether their arrival threatens the nation form? In this essay I will address the notion of increasing violence in the borders, fencing as the most recent marker of such violence and how women and the evolution of their relationship to the border is shaped through the discourses of violence. I hope to portray that from the beginning violence makes the borders exceptional albeit this violence may be a continuation from the colonial times but the processes of state formation has changed the nature of this violence. One of the impact of this recent form of violence is to reduce the entire question of gender to women’s trafficking and obliterating all other forms of violence in the process. I return then to the study of the Bengal-Bangladesh borderlands in the three districts of Nadia, Murshidabad and Malda and look at the nature of population movement, violence and its effects on women. Instead of meta- narratives I come back to the question of micro politics and see whether present day flows and concomitant violence have any relation to past histories or not and how it impacts on present histories of women.
The Formation of the Three Districts in the Colonial Times
The district of Nadia was and still is situated in the heart of Bengal Delta held within the arms of Ganges and Bhagirathi in the west and Padma running into the Meghna estuary in the east. Nadia was acquired by the British Company under the Diwani grant of 1765. The Nadia Raj 3,151 sq.
miles, corresponding with Nadia Sadar and Ranaghat sub divisions with a very small portion of southern Meherpur, at the time of the Permanent Settlement also included Satsikka and the riparian strip east of the Saraswati. In the post Permanent Settlement period the boundary was changed a number of times. I have taken in consideration only the changes with Jessore and Pabna as they pertain to the final boundary settlement. In 1796 the boundary between Jessore and Nadia was demarcated by the Administrative Convenience Order of 1796. For reasons sited as
“thefts and decoities” and by the Administrative Orders dated 17 October 1812 thanas Taki and Suksagar were given from Jessore to Nadia and thana Kotchandpur was transferred to Jessore.
From police sources it is well known that a number of gangs were operating in Nadia including the Banke Muchi gang, the Dedar Biswas gang, the Janakinagar gang, the Latif Sardar gang, the Brojo Bagdi gang etc.2 In 1816 Sunderbans were placed under a Commissioner. In 1854 the Karimpur subdivision was created including Dewanganj, Hurdi and Meherpur thanas and Jalangi and Newada thanas of Murshidabad. Even today it is one of the most problematic border areas and includes Nasirerpara, which a few years back was the most crime prone of all the sub divisions. Beyond it lies Shikarpur today, which is the poorest subdivision in Nadia. In 1863
2 List of Active Decoit Gangs in Bengal 1930, Government of Bengal, Bengal Police, Calcutta 1932, pp.
186-204. Procured from Hogolberia Police Station, Shikarpur, Nadia.
Kushtia was transferred from Pabna to Nadia. In 1883 Bongaon subdivision was transferred to Jessore. By 1911 Nadia had a population of 1,617,846 and a land area of 2790 sq. miles.3
Murshidabad was the capital of Bengal under the nawabs. The company acquired it by the Diwani of 1765. Murshidabad included the zamindaris of Fatehsing and Chunakhali with a part of Rajshahi and a small portion of Nadia Raj. According to Hunters’s Statistical Account of Bengal, the British built barracks there incurring the enormous cost of 302270 pounds by 1767.
By an administrative order dated 11 January 1793 the portion of Rajsahi zamindari lying west of the Padma river was transferred to the Murshidabad collectorate. In 1824 Murshidabad acquired the Calcapore village from the Dutch. By the Administrative convenience order of 5 March 1839 thana Palsa was transferred to Birbhum. In 1848 and 1855 the thanas Calcapore and Farakabad were transferred from Bhagalpur. In 1875 district boundaries were rearranged and 39 villages were transferred to Birbhum and 7 to the Santhal Parganas. In 1879 thanas Ramporhat, Nalhatui and Palsa was transferred to Birbhum. By 1911 the population of Murshidabad was 1,372,274 and the area in 1916 was 2143 sq. miles.4
The 1765 Diwani of Bengal handed over Malda to the British company. At the time of the Permanent Settlement in included the three districts of Rajsahi, Dinajpur and Purnea. By the Administrative Convenience Order dated 25 August 1825 the thanas Rahanpur and Chappae were judicially transferred from Rajsahi. In 1859 Malda got its own Magistrate and Collector. In 1875 Malda was drastically reorganised with 65 villages joining it from Murshidabad and 237 villages being transferred from Dinajpur. In 1879 Malda was transferred from the judgeship of Dinajpur to that of Rajsahi. By 1911 Malda had a population of 1,004,159 and by 1916 Malda had 1899 sq. miles.5
From the beginning then it was obvious that the boundaries of these three districts were never fixed but kept evolving. In fact in this period major changes were planned and implemented for a short time. These changes were in nationalist discourses termed as the partition of Bengal. The Lieutenant Governor of Bengal proposed a scheme for the amalgamation of Assam with the Chittagong and Dacca divisions and the districts of Pabna, Bogra and Rangpur. But compared to Bengal, this new province was still extremely small and so it was decided to transfer the districts of Rajsahi, Dinajpur, Jalpaiguri, Malda and the State of Cooch Behar. “These additions were thought by the Government of India to be justified on the grounds that they would constitute a new province with a population of over 31 millions, while leaving Bengal with a little more than 54 millions; that they would provide a clearly defined western boundary corresponding with well recognised characteristics, both geographical, ethnological, social and linguistics, that they would concentrate in a single province the typical Muhammadan population of Bengal ….”6
Although the scheme was cordially accepted by the Governments of Bengal and Assam it was not popular among the Indian leadership. They inspired the common people to revolt partly by sentiment and partly by fear. The zamindars often inspired their tenants to revolt particularly
3 Monmohan Chakrabatti ed. And revised and updated by Kumud Ranjan Biswas, A Summary of the Changes in the Jurisdiction of Districts in Bengal 1757-1916 (West Bengal District Gazeteers) pp. 48-49.
4 Ibid, p. 50
5 Ibid, p. 77
6 The Gazette of India, (Simla, Saturday, July 22, 1905) in Basudeb Chattopadhyay ed. Bengal Partitioned (West Bengal State Archives, Higher Education Department, Government of West Bengal, 2007) p. 5
in Jessore, Khulna, Nadia, Hoogly, Rajsahi, Mymensingh and Pabna.7 Soon there was widespread protest against the decision to partition Bengal. In a report on the agitations the Government noted that although agitations were not very severe in Malda there were discontent in the region for having been included in the new province. As for Murshidabad it was said that the agitation was confined to the babu classes though it was agreed that many people took the vow of swadeshi. In Nadia however the anti-partition agitations took serious proportions. In a report it was said that the principal towns and villages of Nadia took up the agitations against the use of foreign goods in earnest. “Pleaders and schoolmasters busied themselves lecturing on the subject.
The teachers and boys of several schools raised funds out of which they purchased cigarettes and made bonfires of them. The usual processions of schoolboys and others, bareheaded and barefooted, marched through the principal towns, mourning for the partition of Bengal.”8 The Goswamis of Santipur and Nawadwip lent weight to these agitations. They used their religious authorities to convince the people to give up the use of foreign sugar, salt and other goods. Soon family priests took up the issue and carried the matter into every home. Even Muslims in Nadia responded to the call against partition. Both Hindus and Muslims tried to supply the people with indigenous dhotis but found it difficult to compete with Manchester cotton. It was from Nadia that report reached the Special Branch that plans is afoot to organise anti-partition protests when the Prince and Princess of Wales came down for their visit. This could be stopped but the partition could not be made viable and was revoked in 1911. Thus experimentation with the borders continued. It would now be essential to look at the flows across the border and to analyse whether the rate of migration to and from these border areas can be termed as a historical trend that was definitive of these borderlands.
In the colonial period higher decadal growth rate was not considered as a threat. In fact lower decadal growth was considered as a marker of the ill health of the population. It was in the decade of 1911 to 1921 that the only time Bengal registered a negative decadal rate because of the influenza and malaria epidemics as is shown by table 1. Arthur Geddes, a famous geographer, concerned by this trend comments in 1931 that Bengal’s population was an unhealthy population and so there is not a steady rise in this population. However, even in this situation it was said that one third of Calcutta consisted of people from outside of the province. Therefore migrants were a common presence in this part of the country. Between 1911 and 1931 there is one decade of decrease from the national levels and one decade of increase. “The statistics for I911-2I showed terrible mortality, and, as was foreseen, those of I92I-3I have compared favourably with them and even with those for the decade before the war. The decade to I93I may therefore seem to show improvement in health and vitality and hold out promise for the future. Unfortunately we cannot call this a true advance, since unless "reconstruction" is undertaken the coming census of I94I may belie the apparent recovery shown in I93I. Since the calamities of the war and post-war period of I914-2I were so great, with their combined economic hardship and epidemics, they carried off many who would normally have lived longer, and whose deaths would only have occurred in I92I-31. Their premature decease before I921 does not there-fore prove the last decade to be more healthy than other periods of peace, but is simply to be accounted for by the
7 “The Carlyle Circular” of 10 October 1905 in Basudeb Chattopadhyay ed. Bengal Partitioned (West Bengal State Archives, Higher Education Department, Government of West Bengal, 2007) p. 19
8 “Report on the Agitation” in Basudeb Chattopadhyay ed. Bengal Partitioned (West Bengal State Archives, Higher Education Department, Government of West Bengal, 2007) pp. 75
fact that the war years and those immediately following them were so mortal in their effects; the same is even truer for India as a whole in these two decades. In other words, when the province was suddenly forced to spend itself in deaths in one decade, it paid its debt to Nature ahead of time and was liable for less at the normal time when it came. Yet, unless assets of vitality are being built up meantime, its people are no better off, and the apparent improvement, judged from a fall in the death- rate, is in part illusory.”9 However, what is even more important for our purposes is that according to Geddes the density of population and population growth rate is traditionally higher in eastern part of undivided Bengal.10 After looking at how these districts are administratively constructed it becomes essential to look at the decadal growth rate, percentage variations in population and density of population to understand population movements in these areas. It becomes apparent that the flow of population in Bengal is traditionally from east to west or from areas of excess to areas of lower density.
Population Movement Prior to 1947
There is no data on the decadal growth rate of the population of West Bengal in 1901. However, from 1911 we have the complete data. In 1921 the decadal growth rate was in the negative but from 1931 it is continuously increasing. The decadal growth rate had reduced in 1921 as has already been said because of the famous influenza epidemic. It is clear that for the whole of West Bengal the decadal rate is higher after 1947 than before it. Now let us turn towards the three districts under review.
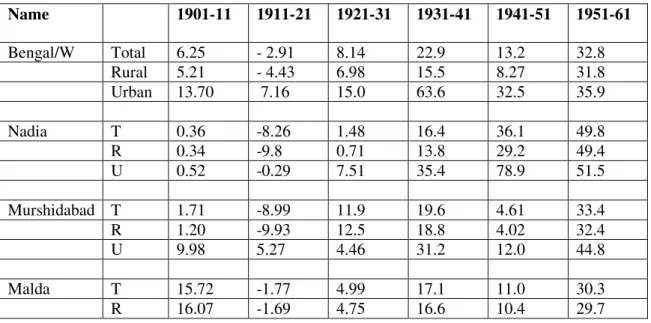
Table 1: Decadal Variation of Population from 1901-1961
Name 1901-11 1911-21 1921-31 1931-41 1941-51 1951-61
Bengal/W Total 6.25 - 2.91 8.14 22.9 13.2 32.8
Rural 5.21 - 4.43 6.98 15.5 8.27 31.8
Urban 13.70 7.16 15.0 63.6 32.5 35.9
Nadia T 0.36 -8.26 1.48 16.4 36.1 49.8
R 0.34 -9.8 0.71 13.8 29.2 49.4
U 0.52 -0.29 7.51 35.4 78.9 51.5
Murshidabad T 1.71 -8.99 11.9 19.6 4.61 33.4
R 1.20 -9.93 12.5 18.8 4.02 32.4
U 9.98 5.27 4.46 31.2 12.0 44.8
Malda T 15.72 -1.77 4.99 17.1 11.0 30.3
R 16.07 -1.69 4.75 16.6 10.4 29.7
9 Arthur Geddes, “The Population of Bengal, Its Distribution and Changes: A Contribution to Geographical Method, The Geographical Journal Vol 89, No. 9 (April 1937). p.
10 Ibid
U 3.80 -4.81 14.4 38.0 29.3 44.4 Source: Census of India 2001
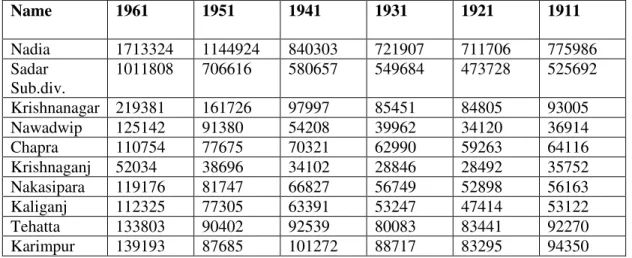
Table 2: Population of Administrative Division of Nadia (Sadar Subdivisions) 1911-1961
Name 1961 1951 1941 1931 1921 1911
Nadia 1713324 1144924 840303 721907 711706 775986
Sadar Sub.div.
1011808 706616 580657 549684 473728 525692
Krishnanagar 219381 161726 97997 85451 84805 93005
Nawadwip 125142 91380 54208 39962 34120 36914
Chapra 110754 77675 70321 62990 59263 64116
Krishnaganj 52034 38696 34102 28846 28492 35752
Nakasipara 119176 81747 66827 56749 52898 56163
Kaliganj 112325 77305 63391 53247 47414 53122
Tehatta 133803 90402 92539 80083 83441 92270
Karimpur 139193 87685 101272 88717 83295 94350
Source: West Bengal District Gazetteers (Nadia), Gazetteer of India, 1965, p. 103 Table 3: Percentage Variation in Population in Nadia (Sadar Subdivision) Name 1951- 61 1941- 51 1931- 41 1921- 31 1911- 21 1901- 11
Nadia + 49.65 +36.3 + 16.4 + 1.4 - 8.3 + 0.4
Sadar Sub.div. + 43.2 + 22.4 + 18.1 + 5.6 - 9.7 - 0.6 Krishnanagar + 35.6 + 72.5 + 20.9 + 5.7 - 7.6 + 4.2
Nawadwip + 36.95 + 68.6 + 35.6 + 17.1 - 7.6 + 4.2
Chapra + 42.59 + 10.5 + 11.6 + 6.3 - 7.6 + 4.2
Krishnaganj + 34.47 + 13.5 + 18.2 + 1.2 - 20.3 - 5.1
Nakasipara + 45.79 + 22.3 + 17.8 + 7.3 - 5.8 - 1.0
Kaliganj + 45.30 + 21.9 + 19.0 + 12.3 - 10.7 + 0.6
Tehatta + 48.01 + 2.3 + 15.6 - 4.0 - 9.6 - 1.7
Karimpur + 58.74 + 13.4 + 14.2 + 6.5 - 11.7 - 6.5
Source: West Bengal District Gazetteers (Nadia), Gazetteer of India, 1965, p. 104
In Nadia the decadal growth has increased steadily from 1921 onwards. In terms of percentage variation in population the Sadar Subdivision jumps from -9.7 in 1921 to + 5.7 in 1931. Perhaps even more outstanding is the increase to + 18.1 by 1941. If on the basis of Geddes’ argument we believe that because many of the people who were meant to die between
1921 and 1931 died in the decade between 1911-21 nothing similar happened between 1931 and 1941 as Table 3 clearly shows. Yet the percentage of population increased by leaps and bounces.
In the decade between 1931 and 1941 both Krishnanagar and Nawadwip registered a growth of +20.9 and + 35.6 respectively. In Nadia the decadal variation of population remained less than that of Bengal as a whole until 1941 after which it became more than that of Bengal as Table 1 suggests. Percentage variation of population in Nadia was at its highest by 1961 and after that year it steadily declined. Although Krishnanagar and Nawadwip registered highest growth rate in the decade between 1941-51. Karimpur and the other police stations areas registered highest growth rate in the decade between 1951 and 1961. From 1921 until 1947 one sees a steady increase in population of Nadia district although the more dramatic increases happen later.
Between 1951 and 1961 the areas of Nakasipara, Kaliganj, Tehatta and Karimpur registers dramatic increases in growth as Table 1 and 2 suggests. But there is another side to this story.
While Tehatta and Karimpur are border areas Nakasipara and Kaliganj are not and yet here the increases are equally dramatic which portrays that in migration from other parts of Bengal and Bihar might also result in increase of population of Nadia district. Also Karimpur and Tehatta registered a much lower growth rate between 1941 and 1951. Yet the growth rate of Nadia did not decrease. This shows that not only Bangladesh border other borders might have been active as well. However, it goes without saying that the years between 1951 and 1961 were years of huge increase in flows into West Bengal.
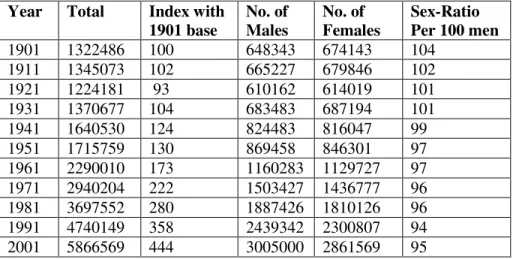
Table 4: Growth of Population by Sex in Murshidabad in Census Years 1901-2001
Year Total Index with 1901 base
No. of Males
No. of Females
Sex-Ratio Per 100 men
1901 1322486 100 648343 674143 104
1911 1345073 102 665227 679846 102
1921 1224181 93 610162 614019 101
1931 1370677 104 683483 687194 101
1941 1640530 124 824483 816047 99
1951 1715759 130 869458 846301 97
1961 2290010 173 1160283 1129727 97
1971 2940204 222 1503427 1436777 96
1981 3697552 280 1887426 1810126 96
1991 4740149 358 2439342 2300807 94
2001 5866569 444 3005000 2861569 95
Source: District Statistical Handbook. Murshidabad, 2007, Govt of West Bengal, p. 7
In the case of Murshidabad the decadal growth rate of 1921-31 was more than that of Bengal as a whole as Table 1 shows. What is even more magnificent is that in the decade between 1921 and 1931 the decadal growth rate of the rural areas of Murshidabad grew more than
that of the urban areas. Murshidabad is one such place where the percentage of rural population is much higher than the urban population. In 1901 the rural population numbered 1246578 to an urban population of 75908 only and until 1951 the rural population formed over 90 per cent of the total population. This is particularly interesting because regions facing sudden migrational onslaughts often have a larger growth rate of urban population as migrants often prefer to live in the cities because jobs are easily available there. In the last few decades that percentage reduced to 87.51 per cent of the total population in Murshidabad. There are evidences that there was population movement prior to 1947 but these trends sharpened after 1947. The sex ratio also slowly declined in the colonial period and that trend continued in the post colonial period. But does migration to rural areas in Murshidabad suggests that migrants were following traditional migrational routes? This is a question of some significance for our study. It should be noted here that as the Table 1 suggests immediately in the aftermath of partition both in Nadia and Murshidabad the urban population growth rate increased dramatically. This increase was matched by the increase of urban growth rate between 1991 and 2001.
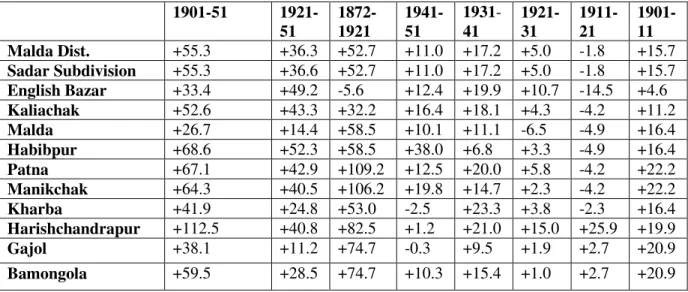
Table 5: Percentage Variations in Population of Malda District from Decade to Decade, 1901-1951
1901-51 1921- 51
1872- 1921
1941- 51
1931- 41
1921- 31
1911- 21
1901- 11 Malda Dist. +55.3 +36.3 +52.7 +11.0 +17.2 +5.0 -1.8 +15.7 Sadar Subdivision +55.3 +36.6 +52.7 +11.0 +17.2 +5.0 -1.8 +15.7 English Bazar +33.4 +49.2 -5.6 +12.4 +19.9 +10.7 -14.5 +4.6 Kaliachak +52.6 +43.3 +32.2 +16.4 +18.1 +4.3 -4.2 +11.2
Malda +26.7 +14.4 +58.5 +10.1 +11.1 -6.5 -4.9 +16.4
Habibpur +68.6 +52.3 +58.5 +38.0 +6.8 +3.3 -4.9 +16.4
Patna +67.1 +42.9 +109.2 +12.5 +20.0 +5.8 -4.2 +22.2
Manikchak +64.3 +40.5 +106.2 +19.8 +14.7 +2.3 -4.2 +22.2
Kharba +41.9 +24.8 +53.0 -2.5 +23.3 +3.8 -2.3 +16.4
Harishchandrapur +112.5 +40.8 +82.5 +1.2 +21.0 +15.0 +25.9 +19.9
Gajol +38.1 +11.2 +74.7 -0.3 +9.5 +1.9 +2.7 +20.9
Bamongola +59.5 +28.5 +74.7 +10.3 +15.4 +1.0 +2.7 +20.9 Source: Census Handbook, Malda, 1951, Government of West Bengal, p.xvi
Table 6: Balance of Migration from Murshidabad to Maldah. 1891-1921 and 1951
1891 1901 1921 1951
Balance of Migration from Murshidabad to Malda
-9,318 -7,162 -20,232 +7,597
Source: Ranabir Samaddar, The Marginal Nation, p. 172
Notes: +shows excess of immigration over emigration.
-shows excess of emigration over immigration.
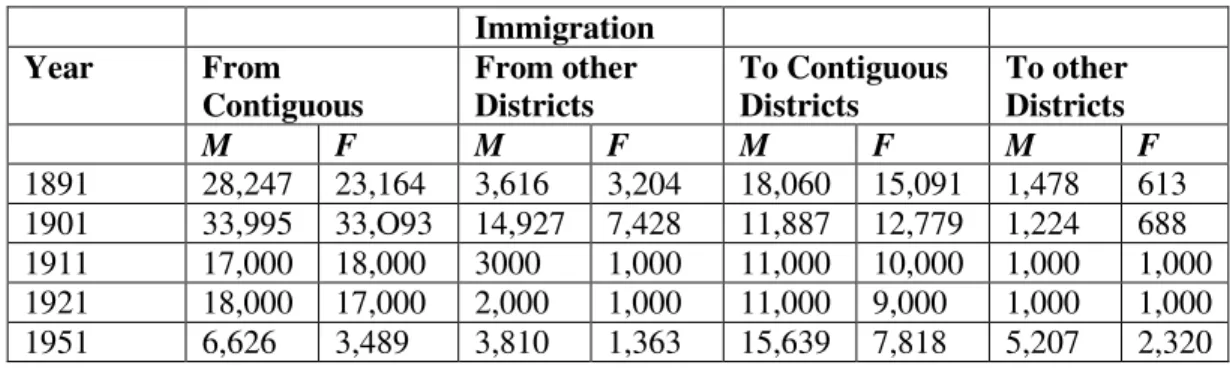
As for Malda a similar pattern can also be observed here. There is a long tradition of both in and out migration from Malda as table 7 suggests. The decadal growth of 1931 to 41 was greater than that between 1941-51 as table 1 shows. In the case of Malda both in migration and out migration is more from contiguous districts. From other districts it is much lesser in the pre 1947 period as can be seen from table 7. The migration of large groups of women may perhaps be due to reasons of marriage. There is no evidence that this might be due to trafficking.
Immigration and emigration between Malda and Murshidabad was a common phenomenon as clear from table 6. By 1951 in Malda English Bazar and Habibpur became the primary entry points. They had been the entry points from 1921 onwards showing linkages between pre and post 1947 migration pattern.
Table 7: Migration between Malda and other Districts of Bengal during 1891-1921 and West Bengal in 1951
Immigration
Year From
Contiguous
From other Districts
To Contiguous Districts
To other Districts
M F M F M F M F
1891 28,247 23,164 3,616 3,204 18,060 15,091 1,478 613 1901 33,995 33,O93 14,927 7,428 11,887 12,779 1,224 688 1911 17,000 18,000 3000 1,000 11,000 10,000 1,000 1,000 1921 18,000 17,000 2,000 1,000 11,000 9,000 1,000 1,000 1951 6,626 3,489 3,810 1,363 15,639 7,818 5,207 2,320
Source: Census Handbook, Malda, 1951, Government of West Bengal, p.xiv
Demographic statistics from the three states suggests that population movement in all these three states is a historical reality. Trends also suggest that migrants came not just from eastern part of Bengal but from other parts as well. In the colonial times there remained some popular destinations that remained popular even in the post-colonial period. Also is it surprising that migrants from a region of very high density of population should come to a region of lower
density of population? Particularly when historically they have been following similar routes because the region of lower density of population also had higher rate of economic development.
The Border Areas Post 1947
Map 1 : Map of West Bengal
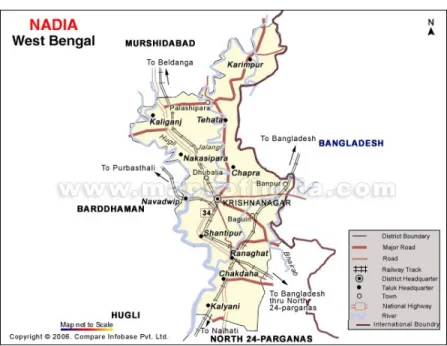
The Radcliff line divided Bengal into two distinct parts. Map 1 shows the border from the western part. The Nadia border was one of those troubled borders where a tribunal had to be appointed. It was the Bagge tribunal in 1949 that solved the Nadia border problem. Migration continued and increased in the post colonial period into Nadia. From the Nadia Gazetteer we come to know that immigrants “form a sizable population of the district. The number of emigrants is also considerable. To avail of the opportunities for economic gain rural people have flocked to the recently grown towns of the district; besides, a good number of migrants have come over from East Pakistan (now Bangladesh) following the partition and have settled in urbanized colonies and urban areas. There are also immigrants from other districts of West Bengal and from other states of India.”11 According to the Census of India 1961, 70122 persons born in other districts of West Bengal migrated into Nadia of whom 26077 were males and 44045 were females. The contiguous Murshidabad and 24-Parganas sent 18300 persons and 16640 persons respectively forming 26.10 and 23.73 per cent of the total number of immigrants.
Bardhaman, Calcutta and Hugli sent respectively 9664, 7531 and 4498 respectively forming 13.78, 10.74 and 7.85 percent of the total number of immigrants into the district.
There were also 27252 immigrants from other states of India in the district. The immigrants from East Pakistan numbered as many as 502645 persons. The Census of 1961 recorded 117269 emigrants from the districts to the other districts of the State. Of these 33107, 23572, 17495, 15553, 11008 and 6565 migrated to 24 Parganas, Calcutta, Bardhaman,
11 West Bengal District Gazetteers, Nadia, Gazetteers of India, 1965, Govt. Documents, National Library, p. 78
Murshidabad, Hugli and Howrah districts. The districts that attracted the immigrants were largely industrialized and urbanised. The Census of 1951 enumerated 424656 persons of whom 218712 were males and 205944 as females belonging to the minority community in East Pakistan. They had come to the district between 1946 and 1951.12
Map 2: Map of Nadia and the Bangladesh Border
In the map 2 given above the Bengal-Bangladesh border is clearly demarcated through the Nadia district. In another report presented in the District Handbook Nadia it was stated that 403804 migrated to the district between 1947 and 1951. Of these 16.76 percent, numbering 67696 settled in urban areas. The migrants mostly came from the ceded portion of Nadia district and other contiguous areas such as Jessore, Faridpur etc. Some also came from Dacca.13 Again people coming from East Pakistan followed their predecessors and often settled in areas just across the border. Table 8 gives details of where these people settled when they remained outside the refugee camp. There is another sinister story within these statistics and that deals with women. In 1965 the Gazetteer comments that there is no evidence of trafficking of women in Nadia but by 2001 this becomes rampant.
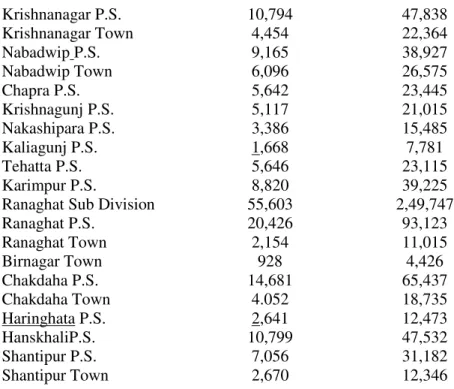
Table 8: Distribution of Displaced Persons in Nadia District, 1955 (Outside Govt. Camps)
No. of Families No. of Members
Nadia District 1,05,841 4,66,608
Sadar Subdivision 50,238 2,16,861
12 Ibid, p. 79
13 A. Mitra Census 1951, District Handbook Nadia, Calcutta 1953, p. XXXVII
Krishnanagar P.S. 10,794 47,838
Krishnanagar Town 4,454 22,364
Nabadwip P.S. 9,165 38,927
Nabadwip Town 6,096 26,575
Chapra P.S. 5,642 23,445
Krishnagunj P.S. 5,117 21,015
Nakashipara P.S. 3,386 15,485
Kaliagunj P.S. 1,668 7,781
Tehatta P.S. 5,646 23,115
Karimpur P.S. 8,820 39,225
Ranaghat Sub Division 55,603 2,49,747
Ranaghat P.S. 20,426 93,123
Ranaghat Town 2,154 11,015
Birnagar Town 928 4,426
Chakdaha P.S. 14,681 65,437
Chakdaha Town 4.052 18,735
Haringhata P.S. 2,641 12,473
HanskhaliP.S. 10,799 47,532
Shantipur P.S. 7,056 31,182
Shantipur Town 2,670 12,346
Source: Source: West Bengal District Gazetteers (Nadia), Gazetteer of India, 1965, p. 80
In the Nadia district as table 8 suggests the largest concentration of the migrants were to be found in the urban centres of Ranaghat and Krishnanagar. This brings us back to our previous supposition that migrants prefer settling in the urban centres which even the District Gazetteer of Nadia, 1965, underscores. The other important centres were Chakdah, Nawadwip and Karimpur.
In Nadia the decadal growth rate kept increasing until 1981, when it was 33.29. This was larger than the decadal growth rate of Bengal that was 23.1. Inter district migrations also continued just as migration from Bangladesh also continued. In the 1971 Census 17328 males and 36160 females from rural areas and 12421 males and 18139 females born in urban areas reported that they were from other districts of West Bengal. Most of these people came from Murshidabad and 24-Parganas. Also a sizeable number also came from Calcutta and Burdwan.14
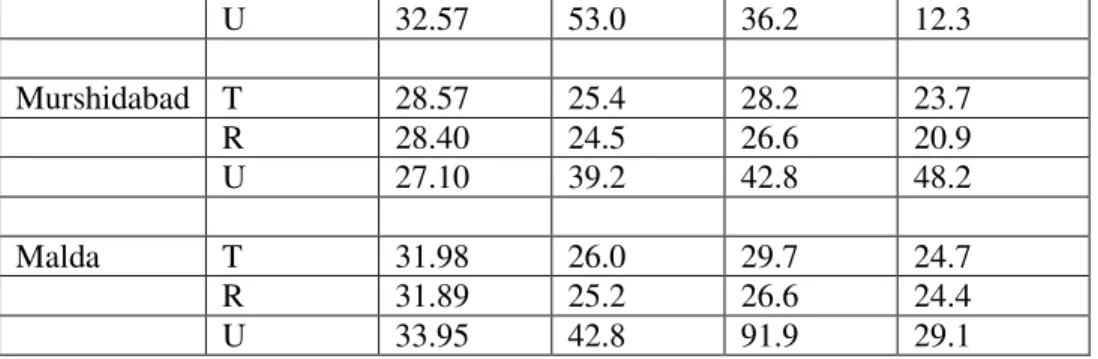
Table 9: Decadal Variation of Population from1961-2001
Name 1961-71 1971-81 1981-91 1991-2001
Bengal/W Total 26.87 23.1 24.7 17.7
Rural 26.38 20.3 23.0 16.9
Urban 28.41 31.7 29.4 19.8
Nadia T 30.14 33.2 29.9 19.5
R 29.77 28.2 28.2 21.6
14 District Census Handbook, Nadia, 1971, Directorate of Census Operations, Govt. of West Bengal, p. 222
U 32.57 53.0 36.2 12.3
Murshidabad T 28.57 25.4 28.2 23.7
R 28.40 24.5 26.6 20.9
U 27.10 39.2 42.8 48.2
Malda T 31.98 26.0 29.7 24.7
R 31.89 25.2 26.6 24.4
U 33.95 42.8 91.9 29.1
Source: Census 2001, Govt. of India
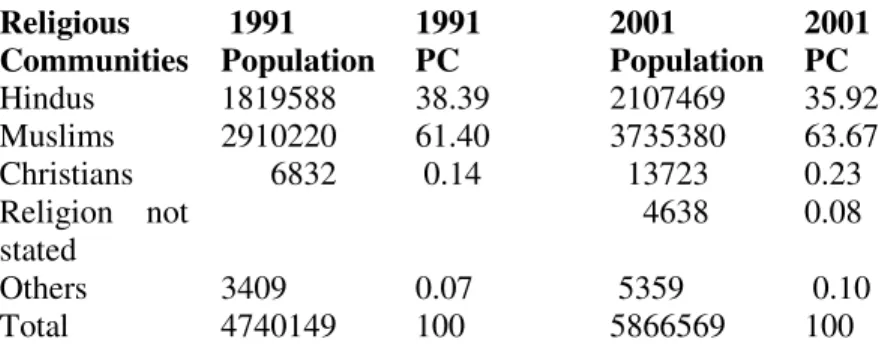
Table 10: Population by Religion, Murshidabad, 1991-2001
Religious Communities
1991 Population
1991 PC
2001 Population
2001 PC
Hindus 1819588 38.39 2107469 35.92
Muslims 2910220 61.40 3735380 63.67
Christians 6832 0.14 13723 0.23 Religion not
stated
4638 0.08
Others 3409 0.07 5359 0.10
Total 4740149 100 5866569 100
Source: District Statistical Handbook, Murshidabad, 2007, Govt. of West Bengal
As for Murshidabad the decadal growth was at its highest in 1961. This was because repression of Bengali speaking people was also severe in that decade in East Pakistan. This is true of all the districts. However, there is evidence to suggest that many who came at that time have eventually gone back. Also this was a time of high inter district migration as people were barely getting used to the partition. Also the decadal growth rate of Murshidabad was never as high as Nadia in the post 1947 period. The decadal growth in fact kept declining from time to time. From 28.75 in 1971 the decadal growth rate declined to 25.4 in 1981. From the 1991 figure of 28.2 the decadal growth rate again declined in 2001 to 23.7. It is still higher than the decadal growth rate of the state of West Bengal. Between 1991 and 2001 the Muslim population of Murshidabad increased. But it did not increase alarmingly. In fact in the same period the Christian population more than doubled. Yet often this 2 percent increase in Muslim population is perceived of as a threat. Although the percentage of Hindus declined between 1991 and 2001 in real terms their numbers increased by 287881.15 One also has to remember that from before 1947 Murshidabad is a Muslim stronghold.
Table 11: Displaced Persons Arriving in Malda By District of Origin, 1946-51
15 District Statistical Handbook, Murshidabad, 2007, Govt. of West Bengal, p. 16
Dist. of Origin Number
Kusthia 36
Jessore 322
Khulna 802
Rajsahi 42,532
Dinajpur 2,609
Rangpur 430
Bogura 580
Pabna 3,056
Dhaka 1,344
Mymensingh 864
Bakhargunj 4,309
Tipperah 2,343
Noakhali 310
Chittagong 301
Sylhet 167
21
Total 60,026
Source: District Census, Malda 1951, Table 1.24, p.79
In Malda the decadal growth rate has declined from 31.98 in 1971 to 24.7 in 2001. The total population of Malda district was 937580 in 1951 increased to 1612657 in 1971 and has become 3290468 in 2001. Malda is still predominantly a rural centre with 92.68 per cent of its population still living in villages. The density of population increased from 706 and 881 from 1991 to 2001. The scheduled caste population of Malda numbered 554165 in 2001. In 1951 the population of Schedule Caste people was over 11 percent and today it is over 15 percent portraying that a large number of lower caste Hindus might have come across the border. The population of Muslims increased from 47.49 percent in 1991 to 49.72 in 2001. Around the same time the Christian population almost doubled from 5118 in 1991 to 8388 in 2001.16 The highest number of in-migrants in 1951 came from Rajsahi as table 11 suggests not for any sinister reason but because people from Rajsahi and Malda speak the same dialect.
From the migration pattern portrayed above it is my contention that migration between Bangladesh and West Bengal continued on the basis of historical routes established in the colonial period. Also this is not the only form of migration. Inter district migration also exists from within West Bengal and from other parts of India. So there is little reason to treat migrants from Bangladesh as an aberration. Neither are they solely responsible for the increase in density of population of West Bengal. In this respect it is necessary to pay heed to the Human Development Report of West Bengal, 2004. This report Suggests:
Contrary to some popular perceptions, it is not very likely that recent increases in population density have resulted dominantly from in-migration from neibouring countries. Out of the nineteen districts (Medinipur has recently been bifurcated) of the State, nine have international borders with Bangladesh. Two such districts – Jalpaiguri and Koch Bihar – show uniformly a declining rate of growth over the decades from 1961 71 to 1991-2001. Nadia, another border
16 District Statistical Handbook, Malda, 2007, Govt. of West Bengal, p. 13
district, also experienced a sharp decline in growth rate from 3.3 per cent in 1971-81 to only 2.0 per cent in 1991-2001. In the cases of 24 Parganas and Dinajpurs, the increase in growth rates from 1971-81 to 1981-1991 was followed by a sharp decline in 1991-2001. The other two border districts Malda and Murshidabad contributed a little over 12 per cent to the decadal (1981-91) growth of population of West Bengal.
All the border districts together account for 44.5 per cent of the 13.4 million population that were added to 1981 census aggregate to make the State population size stands at 68 million in 1991. On consideration of the contribution of natural growth (that is, excess of births and deaths), which is not insignificant, a major concentration of recent migrants in the border districts does not seem to have occurred. Non-border districts accounted for 55.5 per cent of the total population growth of West Bengal in 1981-91. Given the moderate levels of vital rates, this implies that the reported increase in immigration over the decade was not confined to a few border districts, but has possibly undergone a spatial diffusion to other parts of the state.17
Perhaps of greater concern to students of security should be the fact that reportedly there were no trafficking routes through Nadia in 1961 today trafficking is seen as rampant in this area.
Also from the Active Criminal List of December 2009 of Hogalbaria PS another phenomenon becomes clear that is more than 50 percent of the cases are for violation of Arms Act, and that there are daily sacrifices of Indian citizens to bullets, portraying the ever increasing violence of the border areas. Or even the situation of Indian nationals living in the Char beyond fenced areas as in Char Meghna might be a subject of grave concern. Compared to this migration from Bangladesh or increase in density of population seems like a lesser concern.
Changing Patterns of Violence in the Borderland
Population flows itself does not become a security concern unless it is perceived of as affecting law and order. In the colonial period in the region under review the major law and order preoccupation was with gangs that were responsible for dacoity, burglary and theft. Each district had its list of gangs that operated in that area. In Nadia a famous gang in the early twentieth century was the Latif Sardar’s gang. This gang, as we know from police records, consisted of 24 Muslims and 1 Hindu, all from the Ranakhari police station of Mirpur. The field of operation of the gang was not restricted to Mirpur and extended to the jurisdiction of police stations of Krishnanagar, Kushtia and Damurhuda. The gang also worked in Faridpur, Rajshahi and Rangpur. The existence of the gang came to be noticed in 1895 in course of the investigations into the outbreak of dacoities in Mirpur area. Eleven members of the gang including one called Madan Mandal became suspects in seven other dacoities in Rangpur, Faridpur and Rajshahi.
Again in the beginning of 1914 there was an outbreak of dacoities in the Kushtia district and the gang members were suspected. One of the members became the Crown’s witness and four of the gang members including Latif Sardar were sentenced to seven years rigorous imprisonment. The gang was booked under the Criminal Tribes Act in May 1916. Then again in 1918 Jubbar Mandal, the son in law of Madan Mandal was caught after a series of dacoities and confessed to the guilt, thereby implicating thirty other gang members. Twenty one members of the gang were convicted under section 110 of Cr.PC. in 1919 and several others were convicted under section 395 of IPC. There were a few years of lull after which new members joined the gang and the
17 West Bengal Human Development Report, 2004, Development and Planning Department, Govt. of West Bengal, p. 11
gang resurfaced in 1922. A few of these new members were booked under the Criminal Tribes Act in 1923. By 1929 most of the gang were either behind bars or forced to live honestly.
However, by then there were other gangs which were by and large active in the Nadia district including the Broja Bagdi’s gang, the Tamil Shaikh’s gang and others.18
In Murshidabad district among the gangs the more famous was the Bholla gang composed of Bagdis, Haris and Muchis. Initially the gang had 45 members under the leadership of Bara Suchand Bholla of Saora, police station Burwan and district Murshidabad. The gang’s activities were not restricted to Murshidabad but also spread to Birbhum. Nine cases of dacoity were traced to the gang between 1887 and 1903. In three of these cases four members were sentenced between 5 to 7 years of rigorous imprisonment. In December 1903, 15 members of the gang were convicted and sentenced and this stymied much of the gang’s activities. Until 1916 not much was heard about this gang. In 1918 the gang was said to have reorganized itself under the leadership of new and younger members after the original leader died. The new gang was composed of over 147 members. Ten cases of dacoity in Burwan, Mayureswar, Labhpur and Nanoor was traced to this gang and some of the members were convicted. In 1921, twenty nine members of the gang were booked under Criminal Tribes Act. Some of the members were booked in 1924 for a dacoity in Mayureswar under section 395 of IPC. By 1926 many more of the gang members were booked under the Criminal Tribes Act and sentenced to rigorous imprisonment. By the end of 1929 only 7 members were booked under the Criminal Tribes Act and the rest were removed. Although in 1930 none of the gang members were convicted of any crimes and no one was heard to have changed their residence but the police record indicated that the gang was still partially active.19 This was not the only gang in Murshidabad. There were many others such as the Popara – Jugar gang, Mayam Shaikh’s gang, Hiru Ghosh’s gang, Bhugi Shaikh’s gang etc who were all active.
In Malda by 1930 there were sixteen known gangs. Among these gangs there were some like Samir Shaikh’s gang, whose membership was mixed in character and about 50 in number.
They largely operated in the English Bazar area of Malda. Members of this gang were either suspected or convicted in 16 dacoity cases and 17 theft and burglary cases. Some members were convicted under section 110 of the Cr. PC. This gang was an inter-district gang with connections in Dinajpur. The gang did not have a designated adda and met in local hats and bazaars. Their modus operandi varied from crime to crime and the structure of this gang was fairly fluid. There were other gangs such as Kabatulla Shaikh’s gang that had by 1930 expunged much of its membership because of inactivity. Three of its active members were convicted and imprisoned by April 1924 after which the gang became almost defunct. But there were some gangs that were more active than the others such as the Jangli Bind’s gang. This gang operated in the Kaliachak area of Malda. Jangli Bind was originally a member of the Pearpur gang. He came out of his organization and organized a group of criminals into an independent gang. The gang assumed a formidable character in 1924 and started committing crimes in Malda and Rajmahal areas. The
18 List of Active Decoit Gangs in Bengal 1930, Government of Bengal, Bengal Police, Calcutta 1932, pp.
188 – 189.
19 List of Active Decoit Gangs in Bengal 1930, Government of Bengal, Bengal Police, Calcutta 1932, pp.
161 – 162.
members were either suspected or convicted in 27 theft and burglary cases and 5 dacoity cases up until 1930.20 This was one among many of the active gangs in the district of Malda.
Apart from concern over gangs there were concerns with the erstwhile seditionists, who are now known as freedom fighters. But law and order concerns changed drastically after partition during the decade of 1951-1960 with increase in population flows. If one looks at IB files during these years one notices the difference. For one thing in the aftermath of partition the police was expected to make fortnightly reports about the border areas. These reports reveal the changing pattern of violence in the borderlands. In one such report from 1950 it was stated:
It is reported by a D.I.O. that one Samuel Haque s/o Late Mabesuddin Mandal of Kusumpur, P.S.
Mahespur, Dist. Jessore (Pakistan) and some Muslims of Pakistan have formed an unholy alliance with Sri Jai Gopal Ray PUB Bhajanghat, P.S. Krishnaganj and his brother Hajari Lal Ray for smuggling jute from Pakistan to Indian Union. These Muslim Jute smugglers are suspected of collecting information of this side taking the advantage of their movements to our area over smuggling affair. Samuel Haque was an employee of Ordinance Factory, Cownpur before partition. There is a Pak BOP in Kushumpur. On 27/11/50, Samuel Haque passed his night in the house of PUB Jai Gopal Ray and Hajari Lal Ray of Bhajanghat, P.S. Krishanganj and contacted them for smuggling jute from Pakistan. On 28.11.50 Hajari Lal Ray met Sri Badri Narayan Chetlangiak a zamindar and a Crongressite at Krishnanagar and talked with him over this matter.
Jai Gopal Ray is said to be anti police.
(The movements of Jai Gopal Ray and others are being watched. We have got one BOP at Bhajanghat.)
O/C Krishnaganj P.S. reports that on 19.11.50 at about 9:30 hrs. Pak Muslims supported by Pak police took away about 100 heads of cattle from Joynagar field, Krishnaganj after assaulting the cow heards who were tending the cattle.21
In post partition days dacoity was no longer an internal problem. It usually meant dacoity by the Pakistani miscreant. A new category of crime appeared on the horizon and that was smuggling. Something that was legitimate even a few years back became illegitimate. The administration responsible for looking after the border constantly strove to control the flow failing which they had to observe it closely. The most problematic seemed those who were neither here nor there or who lived partly in India and partly in Pakistan due to the nature of their employment or lifestyle. These people were considered as either spies or smugglers, as such security threats that needed to be under constant surveillance. Another category of threat related to land and the next letter to the West Bengal police DIG clarifies this. The letter begins by stating that 1859 Hindu evacuees arrived at Bongaon by train and 549 Muslims left for Pakistan by train. The letter then addresses other issues stating:
On receipt of report from Ranaghat BOP on 29.11.50 (evening) to effect that harvest from another part of Ranaghat Mouza borderlands has been removed by Pakistanis. SDPO along with SDO proceeded to Ranaghat to enquire into it on 30.11.50.
On enquiry SDPO and SDO found that about 25 bighas of land of this side of Indo-Pak border which was situated very near Pakistani village of Pokhrail and 2 1/2 miles from BOP has been devastated of the harvest. The surreptitious removal of harvest took place after night fall on 27.11.50. The special force from 1 – 5 from APB detachment at Bongaon had arrived at BOP in
20 List of Active Decoit Gangs in Bengal 1930, Government of Bengal, Bengal Police, Calcutta 1932, pp.
119 – 121.
21 IB File No. 1238 A/47 (Nadia), p. 493, “Extract from the weekly report of the Superintendent of Police, Nadia, for the week ending 1.12.50, WB State Archives, 43 Shakespear Sarani (hereafter WBSAIB).
the evening of 27.11.50. The removal had been affected before they reinforced and joined in petrol work.22
Land was considered as extremely crucial to the formation of the nation state. Claim to land was to be rigorously upheld even at the cost of alienating ones own citizens. The police were looked upon as protectors of the nation. Pakistani police were marked as trouble makers in the official narratives. In this period the Nadia-Kushtia border continued to be tense. This was blamed on the aggressive attitude of the Pakistani authorities in the Indian official narratives.
Intermittently shots were exchanged between the police of East and West Bengal. In the Rajshahi-Murshidabad border the trouble seemed to be centered on some digging activities by the Pakistani authorities. From its inception the border was tensed. This tension remained until the first few years of Bangladesh. The next report shows how such tensions continued:
Reports of harassment of our nationals while visiting contiguous Pak villages by the Pak Muslims were also received from Nadia and Cooch Bihar. The tension over forcible occupation of a portion of Fulbari garden road, PS Rajganj Jalpaiguri by the Pak authorities has ceased gradually after our police force took possession of the land claimed by Pak authorities without any assistance. The line of demarcation of the disputed road has been agreed upon by the directors of Land Records and survey of both the states.
The Pak authorities are reported to be not in favour of allowing the Hindus to live in border areas and pressure is therefore being given indirectly through the Ansars to leave the border areas.23 There were other causes of tension as well. Pakistani authorities behaviour towards the refugees was one such cause. The other related to the occupation of the Chars. In one report it was stated that, “Pak Muslims aided by the Pak police trespassed into our territory at Char Durbarpur PS Lalgola and forcibly took away paddy to Pak territory by assaulting the labourers who were engaged in harvesting.”24 The Chars are archetypal no man’s land. Claims and counter claims over this were common phenomena. The other causes of concern were incoming flows and the rehabilitation of these refugees. A number of reports discuss meetings and protests by camp inmates of refugee camps. In one such report it was stated that:
On 13.12.53, a meeting (500) organized by the Coopers Camp, Bastuhara Samiti (CPI) was held on the Ranaghat Municipal Ground with Ramendra Narayan Khan in the Chair; the President Shib Shankar Datta (ED-CPI) Sushil Chatterjee (ED-CPI), Gaur Kundu (CPI) and others spoke in the meeting urging the refugees to unite under the banner of the Bastuhara Samiti. They also criticized the mall administration of the camp authority as well as the police action and demanded the removal of the camp administrator, immediate rehabilitation of the refugees in West Bengal and the withdrawal of the cases against the members of the Bastuhara Samiti.25
The 1950s set the tone of what it meant to administer the border land. Even today the main concerns remain with population flow. The fencing is meant to harness that flow. The other area of concern as emerged from the IB files of the 1950s is national security. The fact that remains the main area of concern even today needs hardly any mention. One just need to media reports on the border. In fact there is a new proposal now to install surveillance in border hotels
22 IB File No. 1238 A/47 (Nadia), Memo No. 7491 (5) / 23:50 (Tehatta) “To the WB Police, DIG Central Range, DIGIB, DM 24 Parganas, WBSAIB.
23 IB File No. 1238 A/47, Memo no. 19082/1238 A – 47 / For, date. 7.5.1951, pp. 809-841, “Fortnightly report on Border incidents in West Bengal during 2nd Half of April 1951.” Pp. 809-841. WBSAIB
24 IB File No. 1238 A/47, Memo No. 25522 / 1238 A-47 /For, date- 20.6.1951, p. 867 WBSAIB
25 IB File No. 1355-28, Serial No. NSP XLVI, “Sushil Kr. Chatterjee s/o Upendranath of Basantapur PO Haringhata and Gaori, Krishnanagar, Nadia,” No. 55, WBSAIB.
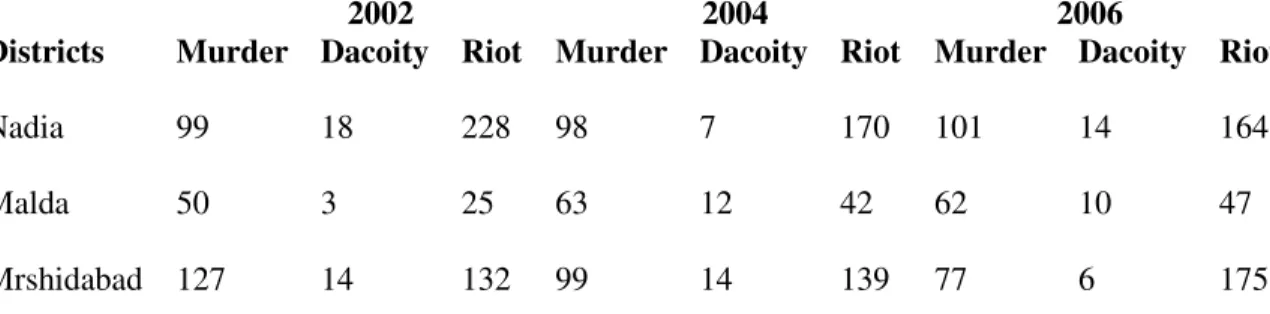
so that one can control population movement from the angle of state security. This is further reinforced by the number of cases brought in the border region under the head of rioting. The table 12 testifies to that fact.
Table 12: Comparison of Types of Offences Committed in Nadia, Murshidabad and Malda
2002 2004 2006 Districts Murder Dacoity Riot Murder Dacoity Riot Murder Dacoity Riot
Nadia 99 18 228 98 7 170 101 14 164
Malda 50 3 25 63 12 42 62 10 47
Mrshidabad 127 14 132 99 14 139 77 6 175
Source: Numbers taken from District Statistical Handbooks of Nadia, Murshidabad and Malda, 2007 In both the districts of Nadia and Murshidabad rioting is a more frequent crime than murder and dacoity. In the case of Malda it is more common than dacoity but slightly less than murder. Concerns over rioting reflect the existent concern over national security in the region.
Such concerns over security issues create a certain kind of atmosphere where concern over women’s security becomes reductive in nature. It is then reducible to concern over trafficking as population movement is marked as the chief concern for the state to address. This obliterates other concerns such as lack of protection of women and their subsequent pauperisation.
Women and Border: A Narrative of Trafficking
Recent newspaper reports from the borders of India and Bangladesh are rife with news of the growing trafficking of women and children in this region. If one looks at the history of the term
“trafficking” it can be traced back to “white slave trade”. Before the great wars it meant the coercion or transportation of Caucasian women to the colonies to service white male officers. At that point the term did not include indentured labourers from the colonies to the plantations where often they were coerced, cheated and abused. From 1904 there were efforts to stop “white slave trade” leading to the Convention for the Suppression of the Traffic in Person and the Exploitation of Others in 1949. By that time trafficking had come to be associated with transportation of women for “immoral purposes” such as prostitution. Social scientists believe that after the wars
“women from developing countries and countries which were experiencing civil and political unrest … were migrating to the developed world in search of a better future.”26 Given the gender inequities in these countries women often entered informal sectors such as prostitution, where labour protection laws are minimal. The international community tried to combat these abuses by humanitarian legislation that addressed concerns of women’s vulnerability. The term used to
26 Bandana Pattanaik, “Where Do We Go From Here?” in Susanne Thorbek and Bandana Pattanaik eds., Transnational Prostitution: Changing Global Patterns (London/New York, Zed Books, 2002) p. 218.
describe the abuse of women in the process of migration was “trafficking”. Efforts to stop trafficking in the 1980s and 90s went hand in hand with efforts to abolish prostitution. Therefore trafficking and prostitution came to be understood as two parts of the same process. In the context of the region under discussion it is likewise understood and the push factors for women’s trafficking even now remain gender inequities in the country of origin, endemic poverty and political persecution.
A few years back in a newspaper report from the northeast India it was stated that, “India was among the seven Asian nations put by US on its ‘watch list’ of countries involved in human trafficking.”27 This is not isolated news but such statements from the West keep recurring. In the same report it was also stated, “not only India is facing this huge problem but also has become a transit point for prostitution from nearby countries like Bangladesh, Myanmar and Nepal.”28 India was also marked as the destination for sex tourism from Europe and United States. These reports portray that human trafficking is a thriving proposition and there are a number of routes through which women and children are trafficked into and out of this region. For a while the Assam- Siliguri route was identified as the main trafficking route through which the victims of flesh trade were transported across Northeast India.29 But routes change and when one route is identified traffickers begin using another. Through these routes in the Northeast women from Nepal, Burma, Bangladesh, the Northeast itself and Bengal are seduced, coerced or forced into flesh trade and trafficked. This is both a procurement area and a transit area. Any report on migration in this region would remain incomplete without a stock taking of trafficking that goes on in this region because it leaves enormous consequences not just for the victims but also for the security of the region. Here we are not speaking of state security but security of people who are affected by trafficking.
To find out why this whole region is vulnerable to traffickers one needs to realize that this is a region of endemic poverty, social imbalance and political violence particularly against vulnerable groups of whom women form a large part. Each part of this region is undergoing certain social and political turmoil where more and more women are getting marginalized. In Bangladesh for example effects of globalisation, growth of fundamentalism, modernization policies such as building of dams etc. have all contributed to violence against ethnic and religious minorities, and against women. Of course minority women are in a double bind. They are attacked both as minorities and as women. The fundamentalists who have increased their control in the political arena strive to maintain a predominantly male-dominant status quo. This strategy puts both minorities and women in general in the receiving end. Religion has come to be used by fundamentalist groups as one of the primary means by which male-dominant values and existing gender-oppressive ideology are imposed and perpetuated. According to Meghna Guhathakurta, “it was advantageous therefore for the fundamentalists to target women who step outside the bounds of social norms since they represented a potential threat to the male-dominant status quo.”30 To compound all of these developments there is endemic poverty and land alienation of poorer
27 “Human trafficking cases in Meghalaya draw US attention,” Shillong Times, 16 June 2004.
28 Ibid.
29 “Assam, Siliguri main trafficking routes in NE,” Shillong Times, 5 June 2004.
30 Meghna Guhathakurta and Suraiya Begum, “Bangladesh: Displaced and Dispossessed,” in Paula Banerjee, Sabyasachi Basu Ray Chaudhury and Samir Das eds., Internal Displacement in South Asia (New Delhi, Sage Publications, 2005)
groups of people in chars (enclaves). Such developments have led to widespread control and destabilization of women in the region leading to their displacement. A fall-out of this is an increase of trafficking of women and children across the border.
To these another cause can be added that directly affects the scenario of trafficking of women from Bangladesh. A number of recent governments have embarked on a policy of brothel eviction. One of the biggest brothels in Bangladesh is in Tanbazar in Narayanganj. This brothel started during the colonial period. Later, many internally displaced women gathered in the area and were dependent on this brothel for their livelihood. In July 1999 sex-workers from this brothel was evicted by the government and sent to vagabond centers where there are evidences that they were severely mistreated. Other than brothels the government has also embarked on a policy of slum eviction.31 In my visit to Bangladesh in 2004 I have had lengthy discussions with women directly affected by these evictions.32 A number of women have tried to resist these developments. But many have not been able to survive such attacks and joined the ranks of the displaced. These women are particularly vulnerable to traffickers. Although any definite data as to how many women are trafficked is almost impossible t gather because of the nature of the problem but the number of brothels in the border areas prove that this is a thriving proposition.
Women from Bangladesh are largely trafficked to India. From India they might then be taken to Pakistan or the Middle East. In a research by Sanlaap in two red light areas of West Bengal it was revealed that most of these women migrate from one place to another. Ninety percent of the red light areas that they have identified as places that they have worked in are situated in the states that border Bangladesh. Most of these are either in the Northeast or in West Bengal. In one particular red light area named Changrabandha about Sixty-six percent women said that they have come from Bangladesh. In Dinbazar many of the sex workers have said that their mothers came from Bangladesh. The report clearly states, “The rate of trafficking in Changrabandha is remarkably higher than Dinbazar. The red-light area of Changrabandha is adjacent to Bangladesh border and women are trafficked through this border like any other commodity.”33 Most of the women in sex work were illiterates. Many of these women entered prostitution when they were younger than eighteen years of age. Most of these women came from families of wage earners and cultivators or their mothers were sex workers as well. The mothers who are themselves sex workers find no alternative except letting their daughters take up the same profession because as children’s of sex workers they are stigmatised and discriminated.
They are deprived of education or even a social environment with any promise or hope. The socio-economic profiles of sex workers of at least Dinbazaar and Changrabandha portray that these women and children did not have too many options to take up other professions.
Even while in the profession their lives are never secure. Basically there are three to four modes of operation. They can work independently, or on contract basis or even under a madam.
Women in the third category had to give up all their earnings to the madam, and they were given room, food and some other necessities in lieu of their payments. Even on contract basis they give half of their payments to madams. The best of them earn about Rs. 5000 per month. This takes
31 ibid.
32 Discussions organized by Research Institute of Bangladesh, Dhaka, 25 November 2004.
33 Project:Linkage, A Situational Analysis on Trafficking and Prostitution in Dinbazaar (Jalpaiguri) and Changrabandha (Cooch Behar), A Sanlaap Initiative Report, supported by Gana Unnayan Parshad and Human Development Centre (unpublished) p. 18.