SIMULTANEOUS IMAGE AND SIGNAL ACQUISITION FOR FOOT FORCE ANALYSIS
A THESIS SUBMITTED IN PARTIAL FULFILLMENT OF THE REQUIREMENTS FOR THE DEGREE OF
Bachelor of Technology In
Biomedical Engineering
Submitted By ANUP PURI
Under the Guidance of Dr. Sirsendu Sekhar Ray
Department of Biotechnology & Medical Engineering National Institute of Technology
Rourkela 769008
NATIONAL INSTITUTE OF TECHNOLOGY ROURKELA
CERTIFICATE
This is to certify that the thesis entitled “SIMULTANEOUS IMAGE AND SIGNAL ACQUISITION FOR FOOT FORCE ANALYSIS” submitted by MR.
ANUP PURI in partial fulfilment of the requirements for the degree of Bachelor of Technology in Biomedical Engineering embodies the bonafide work done by him in the final semester of his degree under the supervision of the undersigned. The thesis or any part of it has not been submitted earlier to any other University / Institute for the award of any Degree or Diploma.
Date: (Dr. S. S. Ray)
Place: Department of Biotechnology and Medical engineering
National Institute of Technology, Rourkela
Contents Page No.
Acknowledgment i
List of Figures ii
Abstract iii
1. INTRODUCTION 1
2. LITERATURE REVIEW 2-10 2.1 GAIT ANALYSIS 2
2.2 METHODS OF GAIT ANALYSIS 3
2.2.1 VIDEO 3
2.2.2 MOTION CAPTURE SYSTEM 4
2.2.3 ELECTROGONIOMETERS 4
2.2.4 EMG (ELECTROMYOGRAPHY) 5 2.2.5 FORCE PLATE 5 2.2.6 TREADMILLS 7 2.2.7 FOOT PRESSURE ANALYSIS 7 2.3 STRAIN GAUGE SENSOR 8
2.3.1 STRAIN GAUGE 8
2.3.2 GAUGE FACTOR 9
2.3.3 STRAIN GAUGE MEASUREMENTS 9
2.4 FORCE PLATE DESIGN 10
3. AIM AND OBJECTIVE 11
4. SCOPE OF THE PROJECT 12
5. MATERIALS AND METHOD 13
6. RESULT AND DISCUSSION 15-24
6.1 CANTILEVER DESIGN 15
6.2 CANTILEVER CONSTRUCTION 16
6.3 FORCE PLATE DESIGN 16
6.4 STRAIN GAUGE FIXATION ON CANTILEVER 17
6.5 CIRCUIT FOR FORCE PLATE 18
6.6 FORCE PLATE OUTPUT 19
6.6.1 CALIBRATION CURVE 19
6.6.2 OUTPUT DATA 19
6.6.3 IMAGE CAPTURE 23
6.6.4 MULTI-THREADING 24
7. SYNCING DIGITAL SIGNAL WITH IMAGE 25
8. CONCLUSIONS 27
9. REFERENCES 28
[i]
Acknowledgement
I would like to take this opportunity to thank my project supervisor Dr. Sirsendu Sekhar Ray, Assistant Professor, National Institute of Technology, Rourkela, for his constant guidance and motivation regarding implementation at every step of the project. Dr. Ray explained the problems we faced repeatedly in the most effortless manner. I would also like to thank my senior Mr. Chandan Kumar, for the initial design and fabrication of the force plate at the Central Workshop, at National Institute of Technology, Rourkela. This design has been adapted from the one created at the Unit Laboratory of physiology and biomechanics of locomotion by Prof. Norman C. Heglund. I am grateful to Mr. Bibhu Kalyan Biswal for helping me in
setting up the data acquisition toolboxes correctly in MATLAB. Besides, I would like to extend my heartfelt gratitude to my alma mater, National Institute of Technology, Rourkela, for allowing me to use its facilities and infrastructure in the best manner possible. Finally, I would like to thank my fellow batch mates for extending their support and cooperation.
[ii]
LIST OF FIGURES
Figure No Title Page No
Fig 1 Bonded Metallic Strain Gauge 8
Fig 2 Wheatstone bridge 9
Fig 3 Design of Cantilever 15
Fig 4 Cantilever Dimension 15
Fig 5 Initial constructed Force plate 16
Fig 6 Circuit for Force Plate 18
Fig 7 NI USB-6008 DAQ card 19
Fig 8 Web-camera used for the experimental setup 23 Fig 9 Schematic diagram of Multi-threading 25
[iii]
ABSTRACT
Gait analysis is the study of locomotion. There are many applications of gait analysis, some of which are, treatment of the pathological conditions (Pathological gait), development of new prostheses and orthoses devices for rehabilitation, and in the field of biometrics for identifying an individual based on gait information. Main goal of most of the gait analysis is to study the kinematics (the position and motion of different joints) and kinetics (Force that causes the motion) of the joints. To analyze the kinematics and kinetics of the different joints during locomotion, many instruments are required such as a force plate. Force plate is used to measure the ground reaction force, the force exerted by body over the ground during locomotion. Using inverse dynamics approach we can measure the moment across the joints through the use of ground reaction forces. In this experiment, we are modifying an existing Force Plate design, which records ground reaction forces using the strain gauge, by fitting an integrated web-camera that will also record foot imprints from below the force plate instrument. The combination of the strain gauge signal and the image helps in determining the area of the foot in contact with the plate, and the type of strain gauge signal recorded at that moment. We hope that this low cost force plate instrument with the integrated web-camera can aid in the better analysis of gait using the force plate instrument.
[1]
CHAPTER 1 INTRODUCTION
Today in this world, health related problems are one of the most challenging problems to be solved, in which gait related problems are of great importance. Gait is the repetitive sequence of lower limb movement so that a person can walk with minimum energy expenditure. For proper execution of gait there should be good co-ordination between central nervous system and the neuromuscular system. In some pathological conditions a deviation in gait pattern is found. Gait analysis is the study of animal locomotion, including locomotion of human. The study includes quantification of measurable parameters of gaits, as well as drawing interpretation about the subject (health, weight, speed, etc.) from his/her gait. Gait analysis is done for two purposes, either for clinical research or for clinical testing. Clinical research differs from clinical testing because the reason is not to make clinical decisions for the individual patient, but to gather data about a pathological condition affecting a group of individuals. The main aim of most gait analysis is the study of joint kinematics and kinetics; other measurements are electromyography (EMG), oxygen intake and foot pressures. For foot pressure measurement either force plate or pressure foot is used, Force plate gives information about ground reaction force while pressure foot gives force field distribution of foot. Gait analysis can be used to extract the information that can be used to know the cause of symptom, in diagnosing the pathological condition, in rehabilitation engineering for new prostheses development and in the field of biometrics individual gait information can be used for identifying individuals. In the present study we are trying to make a low cost force plate which is capable of giving information about force field distribution as well as Ground reaction forces. The experiment makes use of the MATLAB software package for data acquisition from the strain gauges, and the webcam simultaneously for image acquisition from the bottom of the force plate instrument.
[2]
CHAPTER 2 LITERATURE REVIEW
2.1) GAIT ANALYSIS
Gait analysis includes study of measurable parameters of gait as well as interpreting the subject health from his/her gait pattern. According to Brand et al [3], there are four proposed reasons for performing any clinical test for gait analysis, these are
1. To distinguish Diagnosis between disease entities (diagnosis).
2. To determine severity of disease or injury (i.e. assessment or evaluation).
3. To select among treatment options 4. To predict prognosis
According to Brand et al [3], the monitoring of the progress of a patient's condition either following intervention or in its absence might be regarded as an additional reason, so brand modified the four reasons for performing any clinical test, these are
1. Diagnosis between disease entities.
2. Assessment of the severity, extent or nature of a disease or injury.
3. Monitoring progress in the presence or absence of intervention.
4. Prediction of the outcome of intervention (or the absence of intervention).
Brand et al [4], proposed the criteria for assessing the usefulness of biomechanical measurements, which can be used with some modification, as criteria for the usefulness of all clinical gait analysis.
These criteria should be 1. Reproducible
2. Stable (independent of mood, motivation and pain) 3. Accurate
4. Appropriately validated
5. Capable of distinguishing between normal and abnormal 6. Must not alter the function it is measuring
7. Reported in form analogous to accepted clinical concepts
[3]
Murray et al [5] studied the parameters of gait in normal men. He found that the average duration of the gait cycle was 1.03 seconds, cadence was 117 (90–20 steps) and the mean ergonomically walking speed was 2.8 miles per hour. The average stride length was 70-82 cm and the average stride width was 8 cm, with a foot angle of 6.7°.
Ostrosky et al [6], compared gait characteristics in young and old subjects and found that older people demonstrate less knee extension and a shorter stride length compared with Younger people.
2.2) METHODS OF GAIT ANALYSIS
A clinical gait laboratory will usually use these techniques for gait pattern analysis. These techniques can be used independently or in combination, these are:
2.2.1) VIDEO
It is a common method of recording an image digitally, it is used to augment in observational gait analysis and provide a degree of quality control. Slow motion or frame- by-frame playback can be used augment the observational gait analysis. This technique is used to enable an observer to make a decision about an individual’s gait. It allows the clinician to record a person's gait before applying any instrumentation (EMG electrodes, footswitches, motion markers etc.) that might alter the gait patterns. Two cameras are used at least to view a patient Gait pattern, one for sagittal plane and one for coronal plane.
These cameras are synchronized and camera views are integrated into a single image. Slow motion or frame-by-frame playback can be used augment the observational gait analysis enabling quick or imperceptible movements to be more readily detected. [7][8][9]
[4]
2.2.2) MOTION CAPTURE SYSTEM
If there are multiple images of the same object and 3-D position, orientation and Optical characteristics of the camera is known then 3-D position of object can be determined with the help of different 2-D images of same object. This system uses the Video camera and marker system. Video cameras are used to track down the Markers placed at different locations of the patient. Marker system is of two types Active and Passive. Infrared (IR) or light-emitting diodes (LEDs) markers are example of active markers while solid shapes covered with retroreflective tape are example of Passive. The horizontal and vertical coordinates of each marker are recorded from each camera. 3-D coordinates for each marker are calculated based upon the 2D data from two or more cameras and the known location of all cameras. Two or more cameras are needed because markers may become obscured from camera views because of movement of body parts during Gait cycle. In some cases single cameras are used with the assumption of that all motion is occurring perpendicular to the camera axis. But in this case there is loss of signal when any marker will placed outside of camera view. So this type of systems is not recommended for gait analysis and if used then it should be used in a very controlled situation. [7][9][10][11]
2.2.3) ELECTROGONIOMETERS
Electrogoniometers are electro-mechanical devices that span a joint to be measured, with attachments to the proximal and distal limb segments. These devices provide an output voltage proportional to the angular change between the two attachment surfaces. They operate on the assumption that the attachment surfaces move with (track) the midline of the limb segment onto which they are attached and, thereby, measure the actual angular change at the joint. This instrument gives better result for lean individuals than fleshy or muscular person due to skin and muscle movement. Accuracy of this device should be carefully evaluated before using for Gait analysis by testing them on individuals of various heights; this will give a general idea of the kinds of errors the clinician might encounter.
Electrogoniometers available in market are either potentiometer type or Strain Gauge type.
Potentiometer Electrogoniometers are designed to cause a potentiometer shaft to rotate proportionally to the joint angle being measured while Strain gauge Electrogoniometers are
[5]
consist of a small diameter, tightly coiled, flexible spring with plastic end blocks on each end.
The strain gauge is housed inside the spring, whose electrical resistance changes proportionally to the change in angle between the longitudinal axes of the end blocks [7]. 2.2.4) EMG (ELECTROMYOGRAPHY)
The electromyography (EMG) is used to record the activity of muscles during gait, this process is called as dynamic EMG. It can give the clinician an indication of what the muscles are doing during different activity of gait. EMG data can be very crucial because many surgical decisions are based on the EMG data. Therefore it is important to have instrumentation and techniques that provide high quality EMG signals. Two types of electrode are used in EMG Signal acquisition, surface electrode and intramuscular wire electrode. Surface electrodes have gained more acceptance due to their ease of application and because skin penetration is not required. EMG is generally recorded using either passive or active surface electrodes. Active electrodes have a built-in amplifier and are less susceptible to artifacts due to wire motion. EMG electrodes are usually interfaced with the data collection system via a data cable. Telemetered systems are used with some success, replacing the data cable with a small radio transmitter and power pack. The EMG system will typically be set up to monitor a number of muscles simultaneously. Eight- and 16- channel systems are common, and 32-channel systems are available. Surface electrodes cannot readily be used to detect the activity of deep muscles, e.g., the tibialis posterior. In addition, surface EMG is subject to cross-talk, particularly when a rather small muscle is adjacent to larger muscles with overlapping firing patterns. If the EMG of such muscles is required, fine wire electrodes are used. Like video recording, EMG may be captured simultaneously with motion capture or separately. Analysis of EMG can be done on several levels. The most basic level checking is the activity of the muscle is phasic (with clear on and off periods) or constant (either on or off indicating absence of useful control). The next level of analysis involves the checking of is the muscle activity occurring at the normal time in the gait cycle or not. [7][12]
2.2.5) FORCE PLATE
Kinetics is defined as the study of motion and its causes (forces which are responsible for the motion). Kinetic study of human locomotion can be helpful in determining and
[6]
measuring forces which are responsible for human locomotion. Kinetic study parameters can be categorized into internal moments and External moments, in external moment force acting on a joint is a result of ground reaction force. Newton’s third law states that when a body exerts a force on a second body, then an equal and opposite force, called reaction, must act upon first body, so when a person walk on a surface or ground a force is applied by the body on ground and a equal and opposite reaction force is applied by the ground on that person, this reaction force is called ground reaction force. A force plate is used to measure the ground reaction force. Force plates have many application mainly theses are automobile crash tests, clinical gait analysis, and sports technique analysis. [10]
A force plate is rectangular metal plate containing sensors at each corner which are sensing and measuring the applied load. Two types of sensors which are used in force plate are piezoelectric and strain gauge. When a load is applied to the plate it is detected by sensors and converted into electrical signal, from these signals the magnitude and direction of the force is measured. Generally force plates are designed such that it measures the components of ground reaction forces (X, Y, Z force and X, Y, Z moment). [13]
Force plate has a contact surface area where person foot must contact during the ground reaction force measurement. Force plate measurements are generally done with floor fitted force plate to reduce the effect of surrounding vibrations. In order to measure the accurate ground reaction force of a subject, the subject need to place his or her foot or feet completely on the force plate but deliberate loading will give false data so to capture the correct data, starting point should be chosen such that subject foot during walking will be placed exactly on the force plate. At least two force plates are required to measure the ground reaction force because if subject stands on a single force plate then force plate output can’t discriminate that ground reaction force is of which foot because force plate measures the total ground reaction force. [14]
Selection of force plate depends on the applications. Chosen force plate must be of appropriate size and should have a linear response over a range of forces. Before recording any data the calibration should be done by placing a known weight at different locations that is similar in magnitude to the loads that will be applied during normal use. The same
[7]
vertical force should be recorded independently of the location and position of load should be detected accurately. [11]
2.2.6) TREADMILLS
Treadmills can be used to allow gait to be observed for prolonged times and at higher speeds than can be achieved on a gait laboratory walkway. Kinematics can be also obtained if the treadmill is positioned in the motion capture system viewing volume. Treadmills with instrumentation to measure the vertical component of the ground reaction force are commercially available. Recently, treadmill force plates have been developed, which may permit analysis of both the kinematics and kinetics of treadmill gait. [7]
2.2.7) FOOT PRESSURE ANALYSIS
Force plates measure the total force due to the contact of the foot with ground, but do not measure how the total weight pressure is distributed over the plantar surface of the foot.
This information is necessary in dealing with patients with neuropathies and in defining the extent of and risks associated with foot deformities. [7]
Two technologies are used to measure the plantar surface load distribution.
First is a floor mounted device similar in appearance to a force plate, but divided into many small regions. The vertical force applied to each region is measured and used to calculate the pressure on the portion of the plantar surface above that region. As with a force plate, the measurement is made only when the foot is on the plate.
Second technology uses flexible inserts between the foot and the shoe. The insert is again subdivided into a number of regions and each region is instrumented to measure the local force. The resolution of these devices is generally lower than that of the fixed plates. The measurements are affected by how the foot, shoe, and insert fit, and the load sensors tend to be less precise and less uniform than those used in the floor-mounted platforms.
[8]
2.3) STRAIN GAUGE SENSOR 2.3.1) STRAIN GAUGE
A strain gage is simply a pattern of thin wires or foil. It works on the principle that when the wire is put under strain it either get elongated or shortened, so due to change in dimension it changes its electrical resistance. The resistance of a wire (R) is a function of three parameters, all of which are effected by strain.
Most widely used gauge is the bonded metallic strain gauge. The metallic strain gauge consists of a very fine wire or, more commonly, metallic foil arranged in a grid pattern. The grid pattern maximizes the amount of metallic wire or foil subject to strain in the parallel direction (Figure 1). The cross sectional area of the grid is minimized to reduce the effect of shear strain and Poisson Strain. The grid is bonded to a thin backing, called the carrier, which is attached directly to the test specimen.
Therefore, the strain experienced by the test specimen is transferred directly to the strain gauge, which responds with a linear change in electrical resistance. Strain gauges are available commercially with nominal resistance values from 30 to 3000 W, with 120, 350, and 1000 W being the most common values.
Fig 1: Bonded Metallic Strain Gauge
[9]
2.3.2) GAUGE FACTOR
A fundamental parameter of the strain gauge is its sensitivity to strain, expressed quantitatively as the gauge factor (GF). Gauge factor is defined as the ratio of fractional change in electrical resistance to the fractional change in length (strain)
The Gauge Factor for metallic strain gauges is typically around 2.
2.3.3) STRAIN GAUGE MEASUREMENTS
Strain gauge used mainly for strain in the range larger than a few millistrains (e *10–
3). Therefore, to measure the strain requires accurate measurement of very small changes in resistance. To measure such small changes in resistance, and compensate for the temperature sensitivity, strain gauges are almost always used in a Wheatstone bridge configuration (Fig 2) with a voltage or current excitation source. [15]
Fig 2: Wheatstone bridge The output voltage of the bridge, VO, will be equal to
[10]
An initial steady state voltage exists unless the numerator above is zero. Such a configuration with zero output voltage is termed a ―Balanced Bridge‖ and is provided when
R2 * R4 = R1 * R3
Any change in resistance in any arm of the bridge will result in a nonzero output voltage
2.4) FORCE PLATE DESIGN
Norman C. Heglund et al (1981) [16] proposed a simple inexpensive design of a force Plate which can measure Ground reaction force in two planes. In his design the transducer element is composed of two strain-gauge instrumented spring blades orientated at 90 ° to each other; the horizontal blade is sensitive to the vertical force, and the vertical blade is sensitive to the horizontal force.
[11]
CHAPTER 3 AIM AND OBJECTIVE
AIM
Simultaneous Image and Signal acquisition for foot force analysis
OBJECTIVE
1) Construction and Optimization of electrical circuit for Strain Gauge Sensor.
2) Calibration of Force Plate Instrument.
3) Acquiring the signals from the strain gauge using Data Acquisition card.
4) Capturing image frames that are of interest using the integrated webcam.
[12]
CHAPTER 4
SCOPE OF THE PROJECT
1st important point about project is that we are trying to develop low cost Force Plate because Force Plates available in market are costly.
2nd important point about project is that we are trying to measure the Ground Reaction Force as well as Foot print simultaneously (with help of Camera) because all the force Plates available in the market show only Ground Reaction Forces.
[13]
CHAPTER 5
MATERIALS AND METHOD
5.1) Materials
1. Stainless Steel 4 cm square rod ( 50 cm)
2. Stainless steel blade ( 4 mm height , 4 cm width, 100 cm) 3. Power saw blade
4. Welding electrode 5. Glass Sheet 18 mm
6. Stain gauge (360 ohm) (40 piece)
Power Supply Unit (+ 5v, + 12 v) (5 amp), O-PAMP (741), Resistors (1 - 1 M ohm), Bread Board, Vero Board( line), Multimeter, Hook up Wire, Soldering Unit, Electrolytic Capacitor(470uF/40V, 1000uF/40V, ,250uF/40V), Disc Capacitor(.01uF,.001uF,22 pf), Cutter, Twizer, Hand Drill, Solder Wire, Transistor( BC547,BC557,SL100), Microcontroller Atmega 8535, Crystal 8Mhz, LED -10, MAX-232(ic), TRIMPOT—(1K, 500 ohm).
5.2) Methodology
The cantilever has been designed and fabricated by my senior Mr. Chandan Kumar at the central workshop at National Institute of Technology, Rourkela. The force plate is suspended according to design, by attaching the one end of cantilever at force plate surface and other end at the fixed base end. A strain gauge has been fixed to the cantilever so that both combine to make a sensor. A strain gauge gives signal when it undergoes deflection due to load, these signal are then filtered, amplified and then passed to an Analog to Digital converter, which converts the analog signal to digital. These digital signals are transferred to PC where further processing of signal is done and then the force plate Instrument will be calibrated and standardized.
[14]
[15]
CHAPTER 6
RESULT AND DISCUSSION
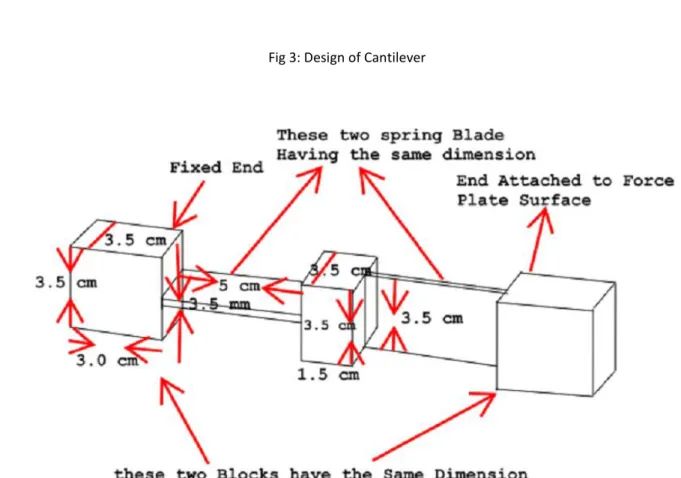
6.1) CANTILEVER DESIGN
Fig 3: Design of Cantilever
Fig 4: Cantilever Dimension
[16]
6.2) CANTILEVER CONSTRUCTION
Steps involved in cantilever construction:
1. Cut the stainless Steel rod and blade into 3.5 cm*3.0 cm, 3.5 cm*1.5 cm and 5 cm*3.5 mm size blocks using power saw machine.
2. Then drill the 3.5 cm*3.0 cm rod and 3.5 cm*1.5 cm Stainless Steel rod using drilling machine in workshop.
3. Then weld the Stainless Steel Rod and Blade According to Design.
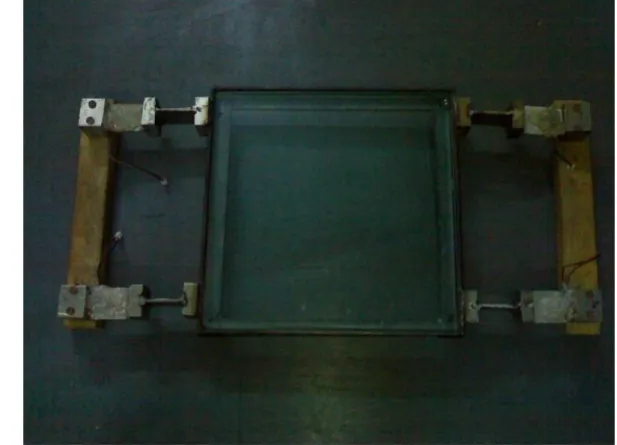
6.3) FORCE PLATE DESIGN
This design is consisted of a rigid plate surface suspended at 4 points (4 corners) by a transducer element (Fig 5). The transducer element is composed of two strain-gauge instrumented spring blades orientated at 90 ° to each other; the horizontal blade is sensitive to the vertical force, and the vertical blade is sensitive to the horizontal force. Each spring blade is modelled as if it were two identical cantilevered beams joined at their distal ends.
Fig 5: Fabricated force plate
[17]
6.4) STRAIN GAUGE FIXATION ON CANTILEVER Steps in strain gauge fixation
1. First clean the surface with acetone and water
2. Then place the Strain gauge at the appropriate place using Tweezers.
3. Now fixed the strain gauge with the araldite (fixing agent) 4. Place a cello tape over the strain gauge
Then leave it under a constant load for 24 hours.
[18]
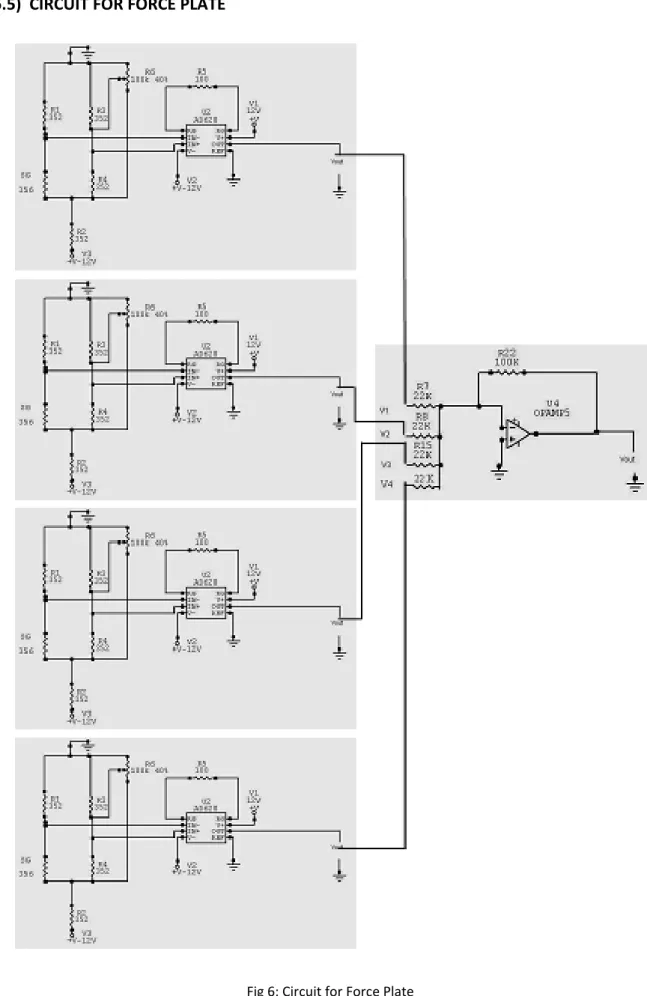
6.5) CIRCUIT FOR FORCE PLATE
Fig 6: Circuit for Force Plate
[19]
Wheatstone bridge is used for measuring the change in resistance of strain gauge. Output of Wheatstone bridges are transferred to Instrumentation amplifier (AD620) for amplification of signal (Fig 6), we are using Instrumentation amplifier instead of op-amp for amplification because of Noise. Four Wheatstone bridge circuits are used because we are using four strain gauges in our force plate. Output of each Wheatstone bridge is transferred to separate AD620. Now we have four output signals so we have added these four signals with the help of adder. Output of the adder is the final output.
6.6) FORCE PLATE OUTPUT 6.6.1) OUT PUT DATA
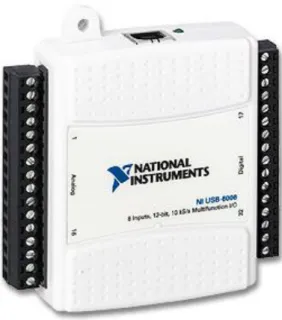
Data was captured from the Wheatstone bridge circuit using the National
Instruments (NI USB-6008) data acquisition (DAQ) card. The digital signals from the A/D converter were picked up by the DAQ card and I was able to access the data in real-time by feeding it into MATLAB through the Data Acquisition Toolbox.
Fig 7: NI USB-6008 DAQ card
[20]
To make the process easier and to be able to control the parameters during acquisition, I had written a MATLAB script (.m file) in which we can change the following parameters during Data Acquisition:
1. Sampling Frequency (Fs)
2. Blocksize (For showing data in real time) 3. Duration of acquisition
4. Logging mode (Disk/Memory or both)
The following MATLAB script was used for the data and video acquisition simultaneously.
clc
clear all close all;
if (~isempty(daqfind)) stop(daqfind)
end
daqhardwareinfo = daqhwinfo ; %toolbox name and matlab version no
daqinstalledadaptors = daqhardwareinfo.InstalledAdaptors ;
%installed drivers (dll)
daqregister('nidaq') %'advantech' 'nidaq' 'parallel' 'winsound'
daqwinsoundinfo = daqhwinfo('nidaq')
[21]
ai =analoginput('nidaq','Dev1');
daqhwinfo(ai);
set(ai);
%For a complete listing of all object properties, with their current settings, use the get function.
get(ai);
ao=analogoutput('nidaq','Dev1');
daqhwinfo(ao);
%Adding & Renaming Channels
%addchannel(ai,[1:2],{'ch0','ch1'});
addchannel(ai, 0,'ch0');
Fs = 1000;
Ts=1/Fs;
blocksize =2000; % Specifying Sample Window size duration=40
% Setting Engine Properties---
set(ai,'SampleRate',Fs);
%Fs samples per second data will be acquired set(ai,'SamplesPerTrigger',Fs*duration);
%Fs*duration no of samples will be acquired set(ai,'TriggerType','immediate');
%ai.TriggerType = 'Immediate';
filename='file.daq';
%Assigning daq file name in variable filename
set(ai,'LogFileName',filename);
% Renaming the daq file name
set(ai,'LoggingMode','Disk&Memory');
% storing data in both Disk & Memory
% starting our engine start(ai);
% Creating the data window figure;
%% Loop Structure for acquiring & displaying the data--- vid = videoinput('winvideo',1,'YUY2_320x240');
set(vid, 'TriggerRepeat', Inf);
preview(vid);
start(vid);
[22]
i=1; prevE=0; prevmdb=0;
% initializing the loop
while ai.SamplesAcquired < ai.SamplesPerTrigger
% Loop condition
while ai.SamplesAcquired < i*blocksize % Ensuring optimum data
end;
odata=peekdata(ai, blocksize); % Assingigning the latest available data to variable pd1
fsHalf=Fs/2;
lpf= fir1(30,10/fsHalf,'low');
odata=filter(lpf,1,odata);
hpf= fir1(30,1/fsHalf,'high');
odata=filter(hpf,1,odata);
data=odata(50:length(odata));
% peekdata function collects 'blocksize' amount of data tmax=Ts*(length(data)-1);
tsec=0:Ts:tmax;
plot(tsec,-data,'-r'); grid on
% To plot the acquired data
xlabel('Seconds'); ylabel('Amplitude');
title('emg','FontSize',12);
axis([min(tsec) max(tsec) 1.5 2.5]) pt = 1.5*(length(data)/Fs);
% calculating pause time pause(pt);
% applying pause time
drawnow; % To animate the data
i=i+1;
% incrementing the loop counter end;
%% stopping the analog input engine--- stop(ai)
stop(vid)
[23]
6.6.2) IMAGE CAPTURE
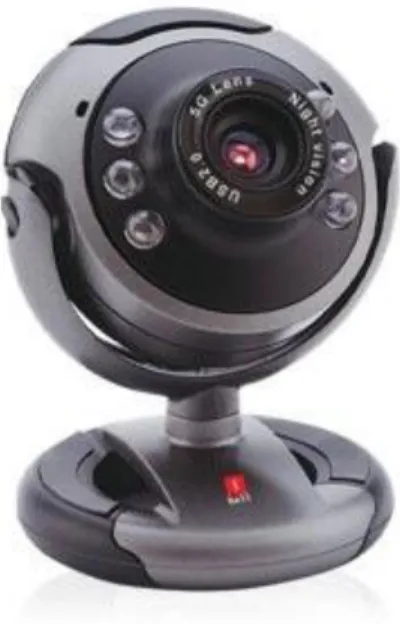
The webcam used for the experiment was “iBall Face2Face C12”
Fig 8: Webcamera used for the experimental setup
The webcamera was configured to acquire image frames through the Image Acquisition Toolbox in MATLAB. The web-camera was placed below the force plate instrument for recording the images while the subject walks over the force plate instrument.
Following parameters were used for the configuration of the Webcamera:
1. TriggerRepeat: Infinite 2. TriggerDelay: Immediate 3. FrameRate: 60fps
4. Video Format: YUY2_320x240
The following code was used for the image acquisition process
[24]
vid = videoinput('winvideo',1,'YUY2_320x240');
set(vid, 'TriggerRepeat', Inf);
preview(vid);
start(vid);
6.6.3) MULTI-THREADING
MATLAB support for multithreaded computation was first incorporated into MATLAB 2007a and is enabled by default in MATLAB 2008a and later. We have used MATLAB 2009a for our experiment, and hence had the advantage of using Multi-threading for running the code.
As mentioned in the MATLAB documentation, multithreading in MATLAB speeds up element wise computations such as those done by the sin and log functions, and computations that use the Basic Linear Algebra Subroutines (BLAS) library, such as matrix multiply. Multi- Threading is useful, if you have a cluster of machines that are available for processing, or if there are multiple processor cores on the same machine, or also on a single processor machine.
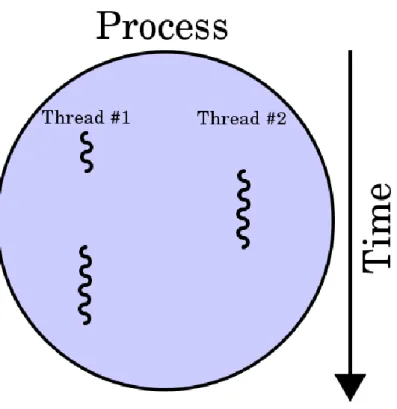
During multi-threading, the compiler breaks down the code into individual processes, which are each knows as independent threads. The threads are capable of being processed by any processor, which is either a part of a cluster, or is one of the cores on the same machine.
Due, to multi-threading, there is a possibility of executing programs such as ours, which requires the running of two Data Acquisitions systems at one and the same time.
Consequently, we have made use of MATLAB multi-threading for the execution of our code.
The two Data Acquisition systems each share processor execution time among themselves.
Due, to this, even though theoretically we have compiled a single program, the compiler breaks the code into a number of fragments specified, and takes up thread execution with a number of processors, or also a single processor. The end result, which matters for us, is that we were able to run two Data Acquisition systems (signal & image acquisition) at the same time which was essential for our experiment.
[25]
Fig 9: Schematic diagram of Multi-threading
7
.
SYNCING DIGITAL SIGNAL WITH IMAGEMATLAB data acquisition packages allow us to capture data from both systems (Digital signal from strain gauge, and image data from the web-camera) simultaneously. While using the Data Acquisition Toolbox (DAT) and the Image Acquisition Toolbox (IAT) in MATLAB, data can be logged into Memory, or on the Disk, or on both the mediums. It is however advised to use disk logging, for the purpose of data analysis for repeated number of experiments.
The EventLog function of both DAT & IAT provide timing for each event conducted by the toolboxes.
[26]
[data time ] = getdata(vid);
The variable time is a vector that contains the time each frame was logged, measured in seconds, relative to the execution of the first trigger. Check the first value in the time vector.
It should reflect the duration of the delay before data logging started.
time time = 4.9987 5.1587 5.3188 5.4465 5.6065 5.7665 5.8945 6.0544 6.2143 6.3424 trigdata =
AbsTime: [2011 04 29 16 40 52.5990]
FrameMemoryLimit: 139427840 FrameMemoryUsed: 0
FrameNumber: 0 RelativeFrame: 0 TriggerIndex: 1
The time vector is relative to the initial trigger (here, 1st frame). By adding the time vector to the AbsTime vector we can get the Absolute system time of each frame as it was acquired by the Image Acquisition Toolbox.
Similarly, we also get absolute time information for each digital data acquired by the Data Acquisition Toolbox. By correlating the absolute time of both the Toolboxes, we can come to know of each of the values at a particular time of the experiment. After the duration of the signal, where heel strike has occurred is identified, we can identify the image frames for this particular duration, and correlate the two data acquisition systems.
[27]
CHAPTER 8 CONCLUSION
Main objective of our experiment was to provide a low-cost alternative for foot force analysis. We developed the force plate with integrated imaging capabilities. In the market, the force plate instruments currently have only load measuring capabilities. Imaging systems in such force plate measurements are cameras that are located at a distance from the experimental setup, and measure joint movements with the help of specific imaging marker points on the limbs etc.
On the other hand, we have constructed this instrument with an integrated web-camera which is placed below the glass surface of the force plate instrument. This instrument helps us in obtaining the imprint of the foot while the subject is walking on the glass surface from below of the instrument. With suitable image registration algorithms, we can find out the area of contact of foot on the force plate, and associate it with the strain curves that we obtain. The combination of data and image simultaneously, gives a new method of conducting force plate experiments.
[28]
CHAPTER 4 REFERENCES
1. Inman VT, Ralston HJ, and Todd F: Human walking. Baltimore: Williams & Wilkins 1981.
2. Perry J. Gait analysis; normal and pathological function. Thorofare, N.J.: Slack, 1992.
3. Brand RA: Can Biomechanics contribute to clinical orthopaedic assessments: Iowa Orthopaedic Journal; 9:61-64, 1987.
4. Brand RA and Crowninshield RD: Comment on criteria for patient evaluation tools:
Journal of Biomechanics; 14:655, 1981.
5. M. Pat Murray, A. Bernard Drought and Ross C. Kory: Walking Patterns of Normal Men: J Bone Joint Surg Am; 46:335-360, 1964.
6. Karen M Ostrosky, Jessie M, VanSwearlngen, Ray Q Burdett, and Zena Gee: A Comparison of Gait Characteristics in Young and Old Subjects: Physical Therapy; Vol 74 Num 7, 1994.
7. Ernest L. Bontrager: Section Two, Instrumented Gait Analysis Systems: Gait Analysis in the Science of Rehabilitation; 1998.
8. Staff of Pathokinesiology Service, Physical Therapy Department. Normal and pathological gait syllabus. Downey, CA: Professional Staff Assoc of Rancho Los Amigos Hosp; 1981.
9. P Allard, IAF Stokes, and JP Blanchi: Three-dimensional analysis of human movement: Human Kinetics; 1995.
10. Henry G. Chambers, MD, and David H. Sutherland, MD: A Practical Guide to Gait Analysis: Journal of the American Academy of Orthopaedic Surgeons; Vol. 10, No 3, 2002
11. Clayton, H.M. and H.C. Schamhardt: Measurement techniques for gait analysis:
Equine Locomotion; p. 55-76, 2001.
12. Joanne K Gronley and Jacquelin Perry: Gait Analysis Techniques: Physical Therapy;
Vol 64, Num 12, 1984.
13. R. G. Morris and S. E. M. Lawson: A review and evaluation of available gait analysis technologies, and their potential for the measurement of impact transmission.
[29]
14. Peter H, Veltink Christian Liedtke and Ed Droog: Ambulatory Measurement of Ground Reaction Forces: IEEE International Conference on Systems, Man and Cybemetics; 2004.
15. Skinner HB and Barrack RL. Ankle weighting effect on gait in able-bodied adults.
Arch Phys Med Rehabil; 71:112–5, 1990.
16. Norman C. Heglund: A Simple Design for a Force-Plate to Measure Ground Reaction Forces: J.exp. Biol; 93, 333-338, 1981.