2.4 (a) UV-Vis absorption spectra of (i) L-glutamine and (ii) CD synthesized from L-glutamine. b) excitation (i) and emission (ii) spectra of CD synthesized from L-glutamine. 2.5 (a) UV-Vis absorption spectra of (i) glycine and (ii) CD synthesized from glycine. b) excitation (i) and emission (ii) spectra of CD synthesized from glycine.
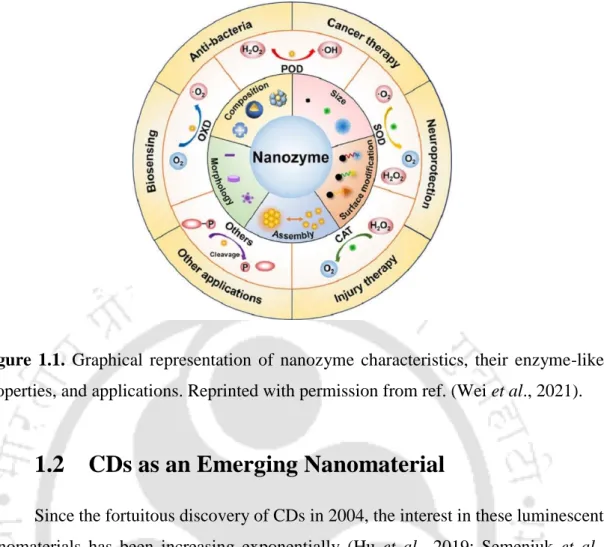
CDs as an Emerging Nanomaterial
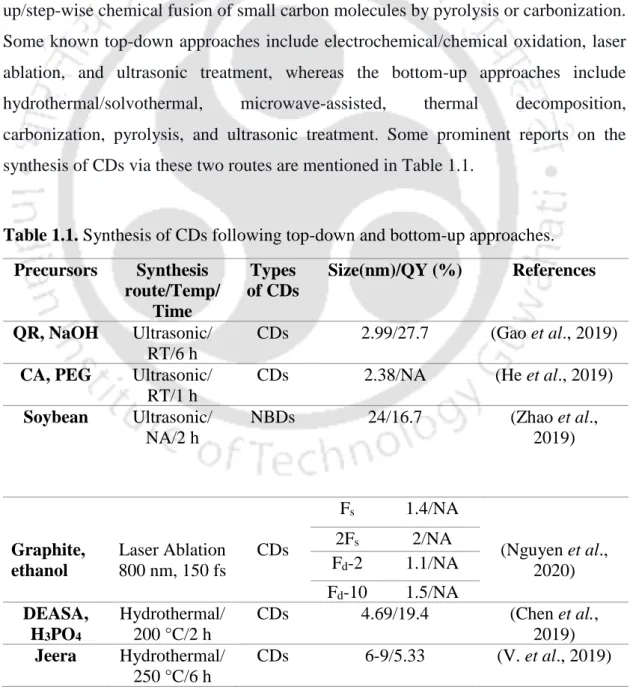
- Synthesis of CDs
- Heteroatoms Doped-CD Synthesis
- Surface Passivation and Functionalization of CDs…
- Characterization of CDs
- Properties of CDs
- Physical property
- Chemical and Optical Property of CDs
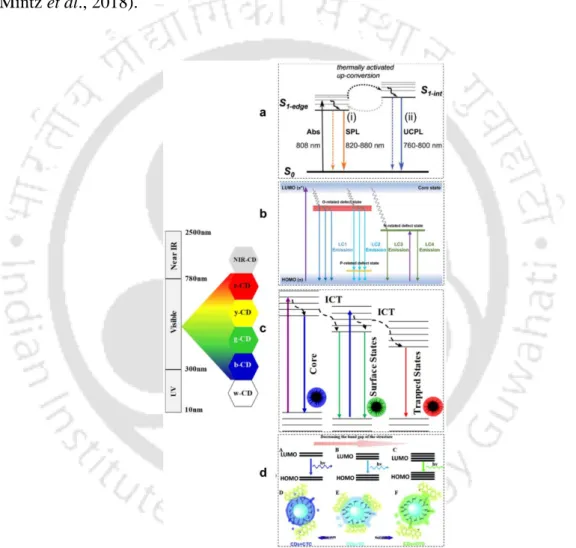
- Photoluminescence (PL) Mechanism of CDs
- CDs in optical-based analytical applications
- Photoluminescence
- Chemiluminescence
- Electrochemiluminescence
- CDs as Smart Materials
- pH Sensitive
- Temperature Sensitive
- Light Sensitive
- Pressure Sensitive
- Multi-Sensitive
- Phase Sensitive
- Solvent Sensitive
- Sensitivity due to Molecular Interactions…
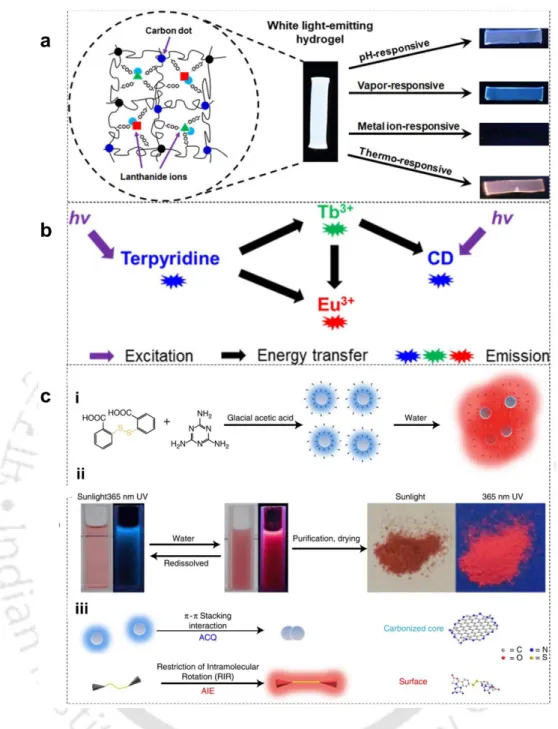
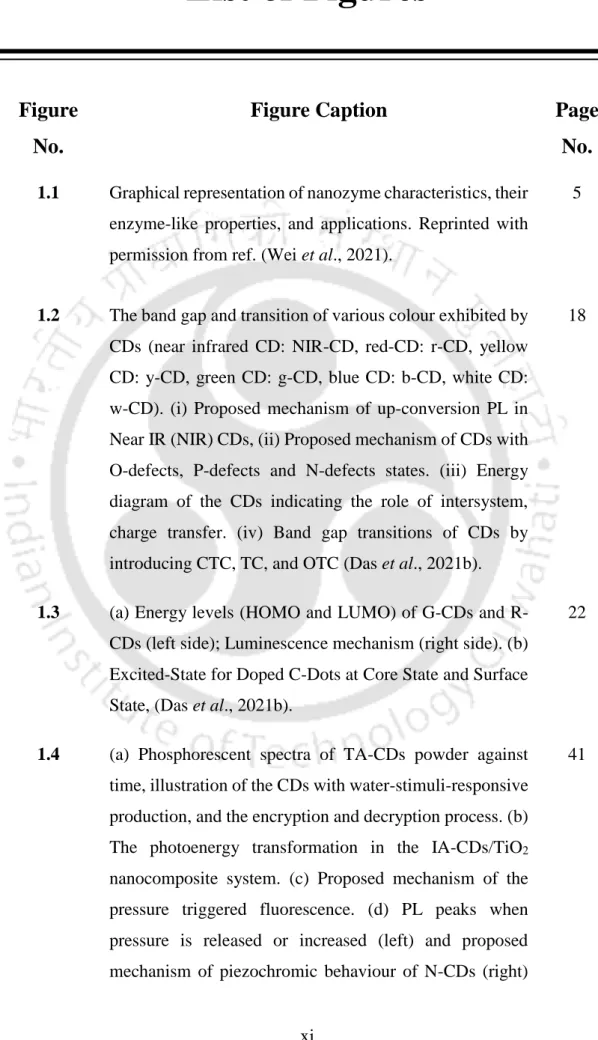
Interestingly, the strategy did not depend on the chirality of the carbon source (Rao et al., 2019). The energetically different associated structures in the ground state of the CD determine the fluorescence response (Roy et al., 2018). a) Energy levels (HOMO and LUMO) of G-CDs and R-CDs (left side); Luminescence mechanism (right side). This characteristic of the CDs was used as a thermometer in the HepG2 cancer cell line.
Therefore, this property of the CD was used to investigate water contamination in various solvents (Senthamizhan et al., 2019).
Significant Gaps in the Research
However, the confusion regarding the involvement of the specific oxygen functional group in the catalytic activity still persists. The emphasis on the existence of any relationship between the CD's peroxidase-like activity and its photophysical property has not been focused. The literature has well documented the investigation of CD's photoluminescence for the detection of bioanalytes in numerous applications.
However, its interaction with biomolecules, especially proteins, and the resulting photophysical behavior for bioanalytical applications have not been sufficiently studied. In most studies related to the peroxidase-like activity of CD so far, the study has been limited to only determining kinetic parameters of the peroxidase mimic and the subsequent monitoring of color development with increasing peroxide concentration. The evolution of CD's geometry during its interaction with the peroxide has not been focused, which is of key relevance to predict the change of CD's material properties during the catalytic activity.
Objectives of the Study
Significance of the Study
Experimental Section
- Materials
- Microscopy
- Synthesis of CDs
- Determination of Band Gap Energy
- Theoretical Studies
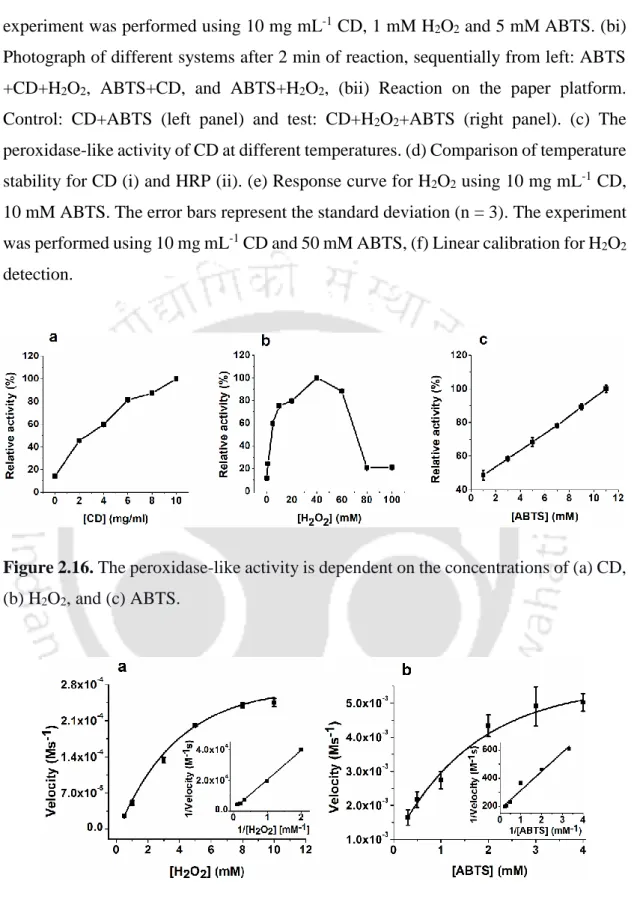
- Peroxidase-like Activity Assay
- Preparation of Paper-Based Platform
- Electrochemical Study of the CD
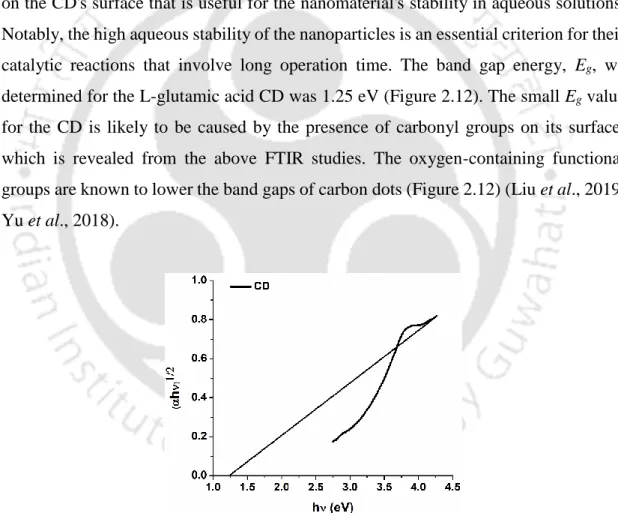
The size and morphology of the CDs were characterized using a field emission transmission electron microscope (FETEM) (JEOL JEM-2100F) at an accelerating voltage of 200 kV. The reaction mixture was placed in a capillary glass tube that was transferred to the ESR cavity, followed by a recording of the spectra. We determined the band gap energy, e.g., of the synthesized CD by plotting Tauc's plot between (αhν)1/2 vs.
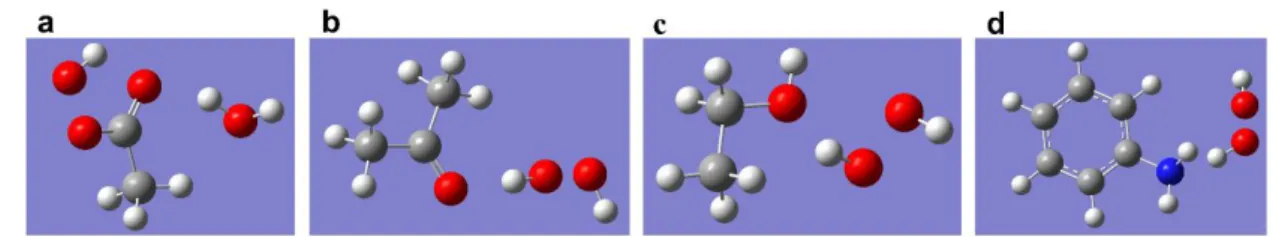
The value of Eg was calculated by extrapolating the linear portion of the curve intersecting the x-axis at the zero absorption coefficient value. First, the geometry of the model molecules, as well as the H2O2, was optimized and their energies obtained. To investigate the peroxidase-like activity of the synthesized CD, the oxidation of ABTS substrate was monitored in the presence of H2O2.
The experiment was performed by changing the concentration of one substrate while keeping the concentration of the other substrate fixed and then monitoring the change in absorbance at 414 nm. The reaction rate at different substrate concentrations was determined by calculating the slope of the absorbance change. The progress of the reaction was then monitored by the color change on the surface of the paper.
Results and Discussion
- Functional Groups for Peroxidase Activity
- Synthesis and Characterization of CDs
- Peroxidase-like Activity of the Synthesized CDs
- Characterization of CD Aggregation
- Mechanism of Peroxidase-like Activity of CDs
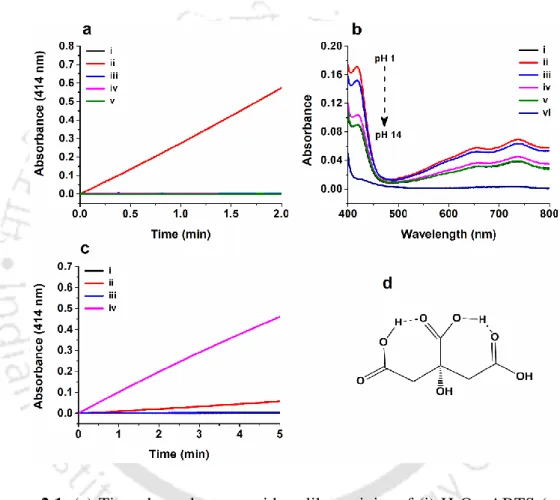
We recorded UV-Vis absorption spectra and excitation-emission spectra (Figure 2.4-2.8) of CDs. Peroxidase-like activity of CD synthesized from (ii) L-glutamic acid, (iii) succinic acid, (iv) glycine, (v) L-glutamine and (vi) citric acid. The selected area electron diffraction (SAED) pattern illustrated the amorphous nature of the synthesized CD (Figure 2.10 c). a) FETEM image of CD synthesized from L-glutamic acid.
We observed that the reaction of the peroxidase substrates (H2O2 and ABTS) increased (at λmax 414 nm) in the presence of CDs and followed a rate of 1.12 x 10⁻⁶ Ms-. We monitored the interaction of the CD with H2O2 by UV-Vis spectroscopy after a time delay of two minutes. A FETEM study showed that the size of the CD particles increased with increasing concentrations of H2O2 and transformed into agglomerated form (Figure 2.20 A).
With the addition of ABTS to the CD+H2O2 reaction system, the intensity of the peak at 3500 cm-1 decreased to a significant level. We find that the H2O2 led fluorescence quenching of the CD also occurred in the absence of ABTS. The result implies the depletion of H2O2 in the mixture containing both substrates due to the CD-catalyzed peroxidase reaction.
Conclusion
Experimental Section
- Materials
- Synthesis of CDs
- Fluorescence Measurement
- UV-Vis Absorbance and Circular
- Zeta Potential Measurements
- Field Emission Transmission Electron Microscopy
- Molecular Docking Investigation
- Statistical Analysis of Data
Circular Dichroism study was performed at room temperature on a Jasco J-815 spectropolarimeter (Japan) using a 10 mm path length cuvette. Using the DichroWeb online server and the SELCON3 analysis program, secondary structures were predicted. All measurements were performed at room temperature and each experiment was repeated three times.
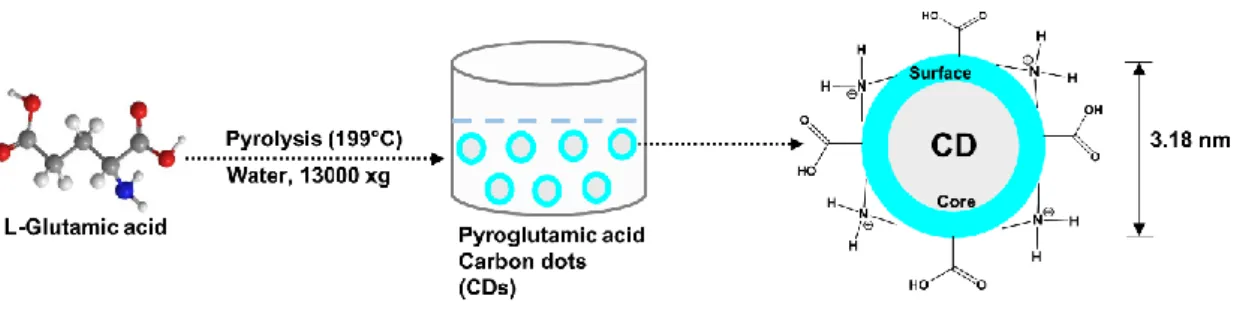
Prior to the docking study, the overall energy of the structures was first minimized using the Swiss PDB Viewer, followed by removal of any water molecule and heteroatoms, addition of polar hydrogen, and finally charging of the enzymes using Kollman and Gasteiger charges. The molecular structure of the synthesized CD is pyroglutamic acid (PGA), as determined from the previous study (Das et al., 2021c). For the docking experiment, energy minimization was performed for all these structures using the UCSF Chimera program, followed by determination of their torsional roots.
To demonstrate the practical applicability of CDs as a signaling probe, 5 mg mL-1 CD was diluted in different dilutions (5-fold, 10-fold and 50-fold) of human blood serum sample. The guidelines of the Human Ethics Committee of the Indian Institute of Technology Guwahati, India, were followed for the use of blood samples. The limit of detection (LoD ) was calculated using the formula 3σ/m, where σ is the standard deviation of the absorbance of the blank sample and m represents the slope of the calibration curve.
Results and Discussion
- Effect of Reaction Components and Media on the
- Effect of Enzyme Reaction Components on the
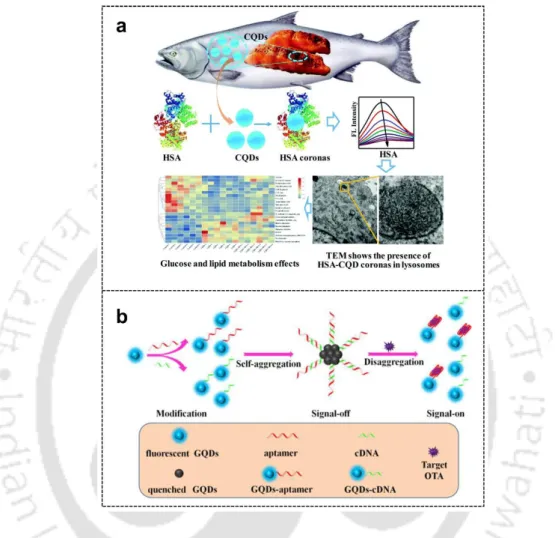
- Effect of HSA, BILI, and Serum on the
- Effect of CD on the Fluorescence of Proteins
- Sample Particle Separation to Minimize the Background
- Colorimetric Detection of the Substrate
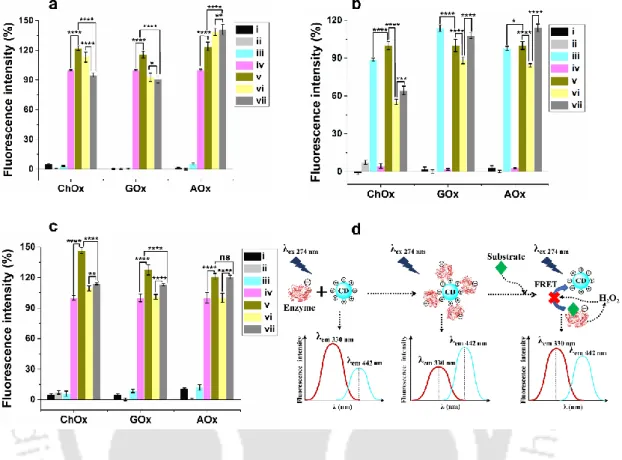
Not significant (ns).(d) Schematic representation of interactions. a) Change in fluorescence of different reaction systems at the CD excitation wavelength (λ354 nm). Upon BILI interaction, the CD fluorescence lifetime increased from 7.68 ns to 7.83 ns. At the CD excitation wavelength, the CD+HSA+BILI system exhibited similar fluorescence enhancement as observed in the case of the CD+HSA system (Figure 3.10 c); however, the peak emission intensity of the latter was ∼12.
When CD was mixed with blood serum, the fluorescence of CD was significantly increased compared to CD in the buffer system. Different PGA functional groups involved in amino acid binding of (a) ChOx, (b) GOx, and (c) AOx. The effect of CD on the optical property of HSA protein was also studied.
Addition of CDs to the HSA resulted in the variation of the absorbance band of the HSA, indicating that the CDs interact with the HSA (Figure 3.19 a). A similar blue shift of the fluorescence of HSA, as observed for ChOx, was found upon the binding of the CD (Figure 3.19 b). This may be due to alteration of the GOx secondary structure after its binding to the CD.
Conclusion
Experimental Section
- Materials
- Characterization
- Synthesis of CDs
- Peroxidase-like Activity Assay
UV-Visible absorption spectra were monitored using a dual-beam Cary 60 UV-Visible spectrophotometer (Agilent Technologies). The FETEM images and SAED pattern were observed using JEOL JEM-2100F with an accelerating voltage of 200 kV. The energy dispersive X-ray spectroscopy (EDS) attached to JEOL JEM-2100F was used to determine the relative content of carbon and oxygen in the synthesized carbon dots. The FTIR measurements were obtained with PerkinElmer FTIR spectrometer at room temperature using spectroscopic grade KBr pressed disk.
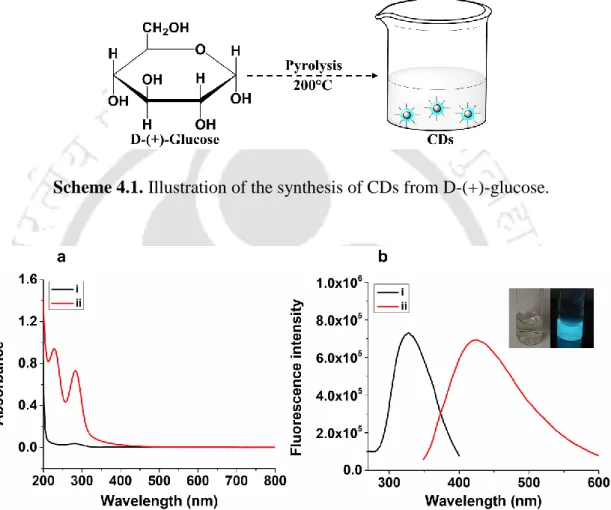
The circular dichroism spectra were recorded by Jasco J-815 spectropolarimeter (Japan) at room temperature using 10 mm path length cuvettes. The spectra were measured between 170 nm to 300 nm in continuous scan mode with 10 nm bandwidth and a scan speed of 100 nm min-1. Briefly, 1 g of D-(+)-glucose was heated at 200 °C until it melted and the colorless liquid gradually changed to a dark yellow solution.
The peroxidase-like activity of the CDs synthesized from D-(+)-glucose was tested for the catalytic oxidation of ABTS in the presence of H2O2. The reaction mixture was incubated for 5 minutes and was then monitored by recording the absorbance at λ= 414 nm corresponding to the oxidation product of ABTS.
Results and Discussion
- Synthesis and Characterization of CDs
- Peroxidase-like Activity of the Synthesized CDs
- Characterization of CD Agglomeration
The d-spacing of the rings corresponds to the hkl (reciprocal lattice perpendicular plane) values (101) and (112). The surface functional groups of the CD were monitored by Fourier Transform Infrared (FTIR) spectroscopy. Therefore, we evaluated the intrinsic peroxidase-like activity of the CDs in the presence of H2O2 and ABTS.
By integrating the results of Figure 4.7 a and 4.7 b, we suggest that the C=O functional group plays an important role in the peroxidase-like activity of the CDs derived from D-(+)-glucose. Since the peroxidase-like activity of the CDs is H2O2 concentration-dependent, we used the CD synthesized from D-(+)-glucose for the label-free H2O2 detection. With increasing H2O2 concentrations, the C=C absorption peak disappeared, together with a slight hyperchromic shift of the C=O peak (Figure 4.9 a).
Furthermore, the increased intensity of the hump at 44.35° is due to increased molecular ordering within the agglomerated structures. Moreover, the increase in size of CDs due to agglomeration is thought to be responsible for the narrow peaks in contrast to the broad peaks of the synthesized CD (Londoño-Restrepo et al., 2019). This observation proved the formation of a CD-H2O2 hybrid accompanied by an increase in the size of CDs.
Conclusion
Dong, Y., Zhang, J., Jiang, P., Wang, G., Wu, X., Zhao, H., Zhang, C., Superior peroxidase mimetic activity of carbon dots–Pt nanocomposites relies on synergistic effects. Duan, Y., Huang, Y., Chen, S., Zuo, W., Shi, B., Cu-doped carbon tips as catalysts for the chemiluminescence detection of glucose. He, C., Yan, H., Li, X., Wang, X., In situ fabrication of carbon-tip-based lubricants using a facile ultrasonic approach.
Jiang, K., Gao, X., Feng, X., Wang, Y., Li, Z., Lin, H., Carbon Dots with Dual-Emissive, Robust and Aggregation-Induced Room Temperature Phosphorescence Characteristics. Li, C., Qin, Z., Wang, M., Liu, W., Jiang, H., Wang, X., Manganese oxide-doped carbon dots for temperature-responsive biosensing and target bioimaging. Pan, M., Xu, Z., Jiang, Q., Feng, J., Sun, J., Wang, F., Liu, X., Interfacial engineering of carbon dots with benzenediboronic acid for fluorescent biosensing.
Ren, G., Meng, Y., Zhang, Q., Tang, M., Zhu, B., Chai, F., Wang, C., Su, Z., Nitrogen-doped carbon dots for the detection of mercury ions in living cells and visualization of latent fingerprints. Wang, T., Chen, G., Li, L., Wu, Y., Highly fluorescent green carbon dots as a fluorescent probe for detecting mineral water pH. Xu, S., Zhang, F., Xu, L., Liu, X., Ma, P., Sun, Y., Wang, X., Song, D., a fluorescence resonance energy transfer biosensor based on of carbon dots and gold nanoparticles for the detection of trypsin.