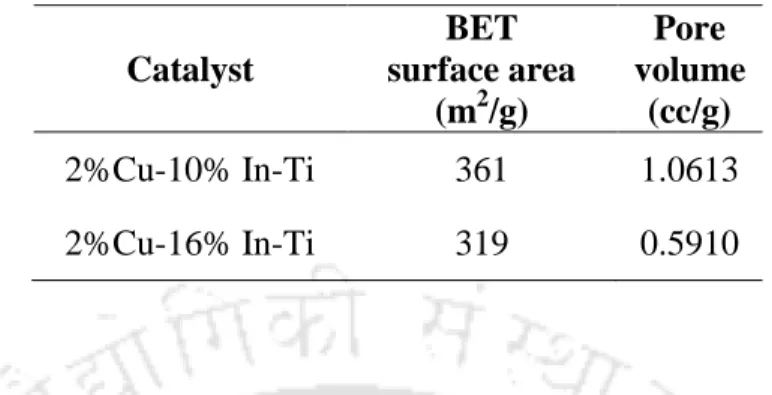
The effect of varying the amount of nitrogen was studied for a copper-modified titanium dioxide catalyst. The photocatalytic rate of hydrogen evolution for titanium dioxide modified with copper, iron, and nickel was found to be 938, 269, and 250 µmol/g/h. The higher activity of copper-modified titanium oxide can be attributed to the larger surface area and the significant absorption of visible light. The increase in hydrogen production can be attributed to increased absorption of visible light and trapping of photogenerated electrons.
Publications from this work
Conferences
Additional publications
Page No
Energy demand
Global Energy Use (http://www.eia.gov/forecasts/ieo/) Carbon-based fossil fuels, such as petroleum, coal and natural gas, are the world's largest energy sources and are expected to continue to provide the majority of energy. energy that will be used in the near future (fig. 1.2). In recent years, global energy consumption from additional sources such as nuclear energy and renewable energy has been increasing rapidly. The main goal of alternative energy sources is to develop techniques to achieve clean and sustainable energy carriers that solve both the energy crisis and environmental problems.
Hydrogen as energy carrier
Hydrogen production methods
Comparison of the higher calorific value (HHV) and energy content of hydrogen with other fuels (Rajeshwar et al., 2009). Solar energy has been used to produce hydrogen mainly through water splitting reactions (Fujishima et al., 2008). However, water splitting is difficult to achieve due to the large positive standard Gibbs free energy change (237 kJ/mol) (Chen et al., 2010).
Thesis objective
Photocatalytic hydrogen production
- Charge carrier trapping
- Visible light activity
- Effect of alcohol
The stabilization of the charge carriers can be achieved by trapping the photogenerated electrons and holes. One of the most effective ways is to convert UV active photocatalyst into visible light active catalyst by doping with metal ions. Doping metal ions introduces additional energy levels within the band gap of the photocatalyst to facilitate absorption of visible light.
Photocatalytic systems
- Titania based photocatalysts
- Modification with nonmetals
- Comodification with metal and nonmetals
- Indium oxide based photocatalysts
- Coupled semiconductor based photocatalysts
Cationic S doped TiO2 was studied by Ohno et al b) for the degradation of methylene blue under visible light irradiation. The improved photocatalytic activity was attributed to the strong absorption of visible light and the higher separation efficiency of photogenerated electron-hole pairs. Majrik et al., (2013) recently reported the hydrogen production activity of SnOx-TiO2 using Pt as a co-catalyst from aqueous methanol solution under UV and visible light.
Photocatalytic reaction kinetics
The authors found that the reaction rate constant for rhodamine B increased with increasing light intensity. It was reported that reaction rate constant increased with increase in titanium content and then decreased, while adsorption rate constant decreased with increase in titanium content. They also observed increase in the reaction rate with increase in the light intensity (up to 2.3mW cm-2) at lower methanol concentration.
Materials used
Preparation of TiO 2 based catalysts
- Preparation of TiO 2
- Preparation of cerium and nonmetal doped TiO 2
- Preparation of transition metal and nitrogen doped TiO 2
For the preparation of transition metal-doped titanium dioxide catalysts, iron nitrate nonahydrate, copper nitrate trihydrate, and nickel nitrate hexahydrate were used as precursors for Fe, Cu, and Ni, respectively. To prepare transition metal and nitrogen codoped catalysts, the required amount of urea was added as nitrogen precursor to the solution containing the respective metal nitrate salt. The preparation steps for transition metal and nitrogen co-doped TiO2 samples are shown in Appendix A (Fig.A.2). Transition metal and nitrogen co-doped TiO2 samples were designated as M-1N-TiO2 (M= Cu, Fe, Ni).
- Preparation of In 2 O 3
- Preparation of indium-titanium coupled oxide
- Preparation of copper doped indium-titanium oxide
- Preparation of indium-transition metal coupled oxide
For the preparation of indium-titanium coupled oxides, aqueous solution containing required amount of indium nitrate was added dropwise to the titanium tetra isopropoxide solution and stirred for 30 min. Subsequent steps such as filtration, washing, drying and calcination were similar to those used for the preparation of indium oxide. In the case of preparation of In-Cu, D-glucose (0.1 mol/l) was added to aqueous solution of copper nitrate.
Characterization of catalysts
- BET surface area and pore size measurements
- X-ray diffraction studies
- Field emission scanning electron microscopic studies
- Energy dispersive X-ray spectroscopic analysis
- UV-Visible diffuse reflectance absorption studies
- Photoluminescence spectroscopic analysis
The diffuse reflectance UV-Vis spectra of the photocatalysts were measured on a Perkin Elmer Lambda 750 instrument equipped with a 60 mm labsphere specular reflectance accessory at room temperature. The photoluminescence (PL) measurements were performed in a Thermo Spectronic (Aminco Bowman Series 2) instrument with a Xe lamp as the excitation source at room temperature. The same amount of sample quantity was used for recording PL spectra of all the samples.
Photocatalytic studies
- Experimental setup and procedure
- Product analysis
The hydrogen production activity of the catalyst was investigated at different light intensities in the range of 5000 to 25600 lux. The hydrogen production activity of the catalyst was investigated at different catalyst amounts in the range of 0.1 to 1.0 g. The effect of the type of alcohol on the photocatalytic activity of the catalyst was studied using methanol, ethanol and propanol.
Preliminary studies .1 Effect of stirring
- Variation of light intensity
The light source (500 W tungsten halogen lamp) was placed approximately 15 cm away from the luxmeter, and measurements were taken as a function of time. The results show that in the first 10 minutes, the light intensity gradually increased with increasing irradiation time and then reached a maximum of 25600 lx and stabilized. Therefore, before starting the photocatalytic reactions, the lamp was turned on for about 20 minutes to achieve a stable light intensity.
All photocatalytic reactions were performed at stable light intensity unless otherwise stated.
- Cerium doped titania .1 Effect of cerium loading
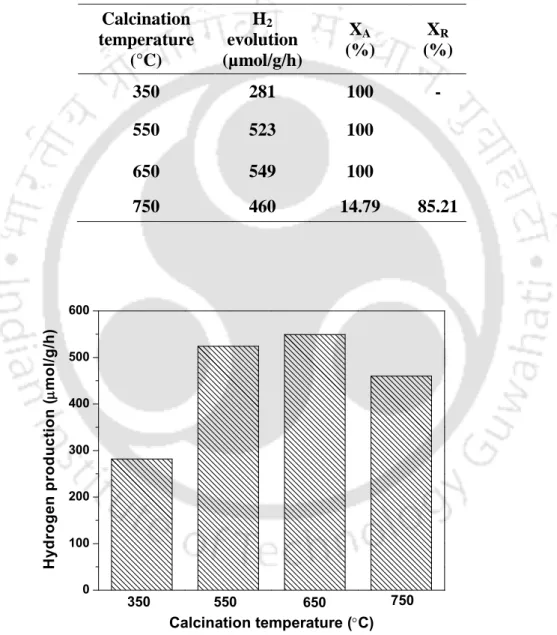
- Effect of calcination temperature
- Effect of cerium and nonmetal codoping
- Transition metal doped titania
- Effect of transition metal doping
- Effect of transition metal and nonmetal codoping
- Effect of variation of nitrogen doping
- Indium-titanium coupled oxide
- Indium-transition metal coupled oxide
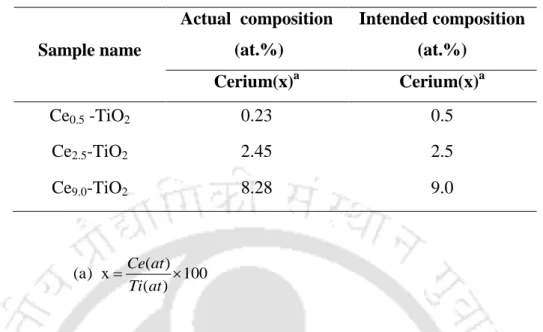
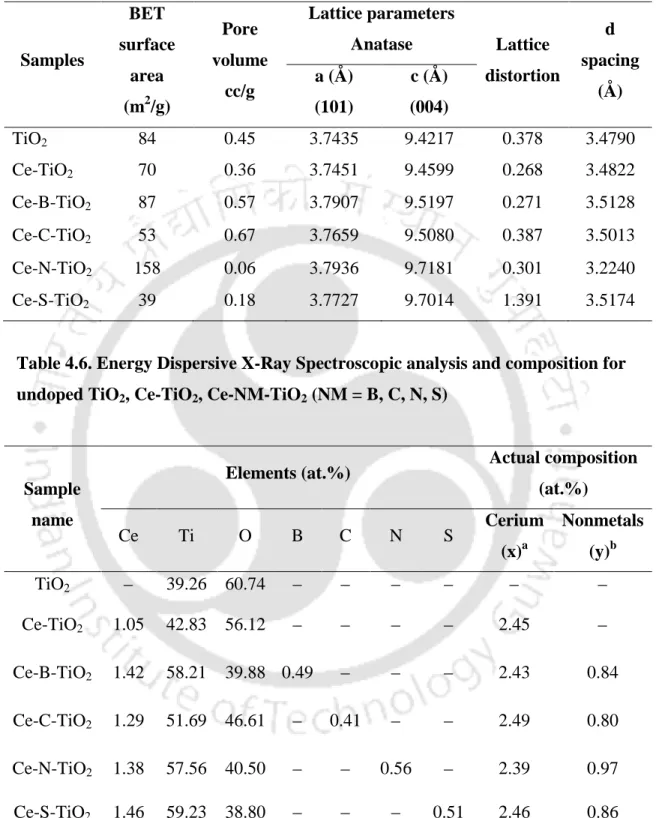
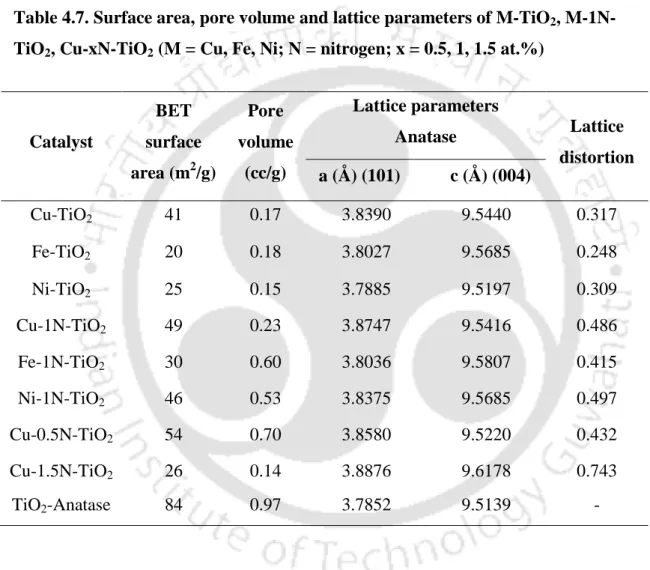
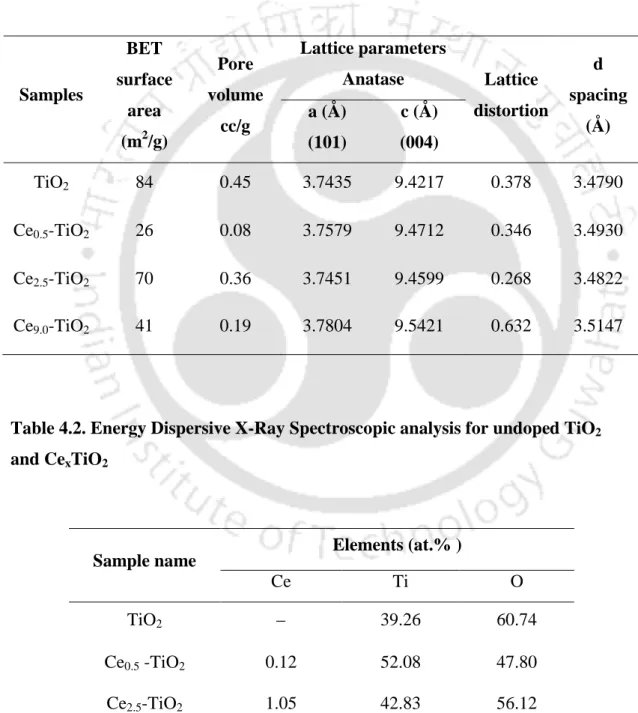
The actual composition of the prepared photocatalysts was determined by EDS and results are shown in Table 4.2 and 4.3. Fig.4.6 shows the room temperature photoluminescence spectra of the CexTiO2 catalysts in the range of 350-600 nm. The actual composition of the prepared photocatalysts was determined by EDS and results are shown in Table 4.6.
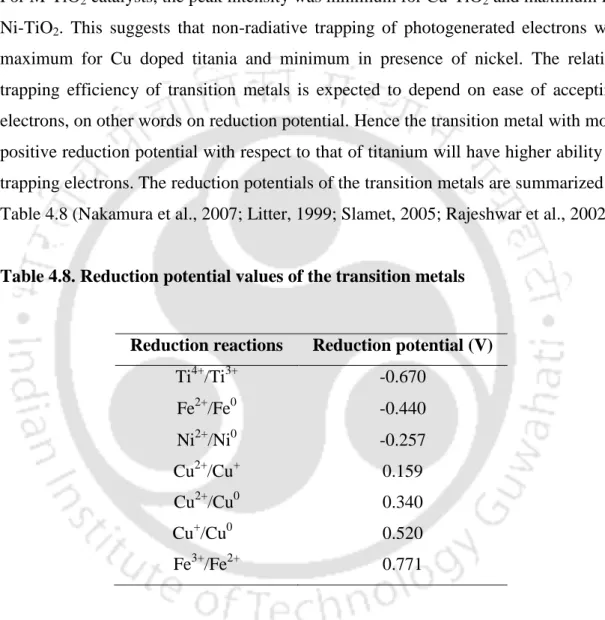
Fig.4.14 shows the room temperature photoluminescence spectra of TiO2, Ce-TiO2 and Ce-NM-TiO2 samples in the range of 350-600 nm respectively. The surface area of M-TiO2 samples varied in the range of 20-41 m2/g, depending on the type of contaminant metals. The addition of nitrogen to the transition metal doped titania appeared to further enhance the aggregation nature of the catalysts as shown in Fig.4.20 (b, d, f).
The FESEM images of the copper and nitrogen co-doped samples, at different nitrogen loadings, are shown in Fig.4.30 (a-c). Fig.4.34 shows the nitrogen adsorption-desorption isotherms of the indium-titanium oxides with different indium content and 2 %Cu-10%In-Ti sample. The photoluminescence spectra of the indium-titanium oxides and 2%Cu-10%In-Ti are shown in Fig.4.38.
The improved performance of indium-titanium coupled oxides can be attributed to several factors. The lower activity of 2%Cu-16%In-Ti can be attributed to its smaller surface area and absorption of visible light compared to 2%Cu-10%In-Ti. As the content of indium oxide increased, the surface area and visible light absorption of the binary catalyst increased.
O 3 cell (rhombohedral
- photocatalyst h h + e vb cb
- Effect of operational parameters
- Kinetic studies
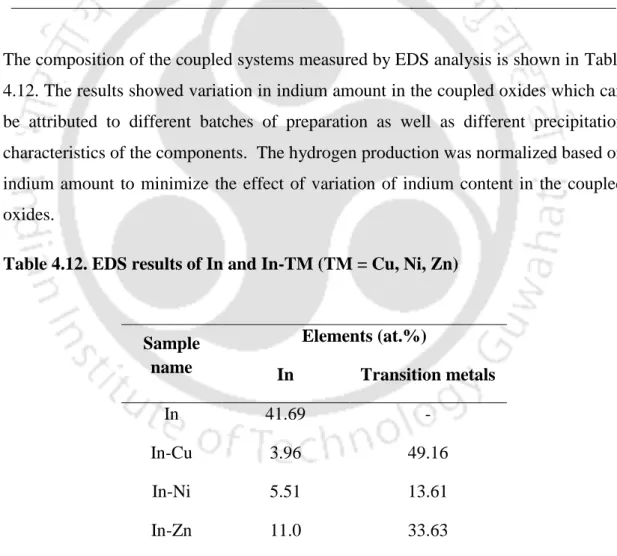
Hydrogen production was normalized based on the amount of indium to minimize the effect of variation in indium content in the coupled oxides. Photocatalytic hydrogen production from an aqueous solution of methanol was performed over indium oxide and indium transition metal-coupled oxides under visible light irradiation. Hydrogen production for In and In-TM (TM = Cu, Ni, Zn) based on indium per gram.
The hydrogen production for In-Ni of 6731 μmol/g indium/h was lower with respect to In-Cu but slightly higher compared to that of In-Zn. The improvement was lowest for In-Zn coupled oxide with hydrogen production of 4972 μmol/g indium/h. Hydrogen production for In and In-TM (TM = Cu, Ni, Zn) based on per gm of catalyst.
Accordingly, the highest hydrogen production was observed for bound indium copper oxide 17314 μmol/g indium/h compared to indium oxide (1528 μmol/g indium/h). The second highest hydrogen production was for indium nickel bound oxide with 6731 μmol/g indium/h. The variation of hydrogen production with the amount of catalyst was determined in the range of 0.1 to 1 g.
The hydrogen production at different concentrations of methanol was determined in the range of 2.3 to 7.4 mol/liter.
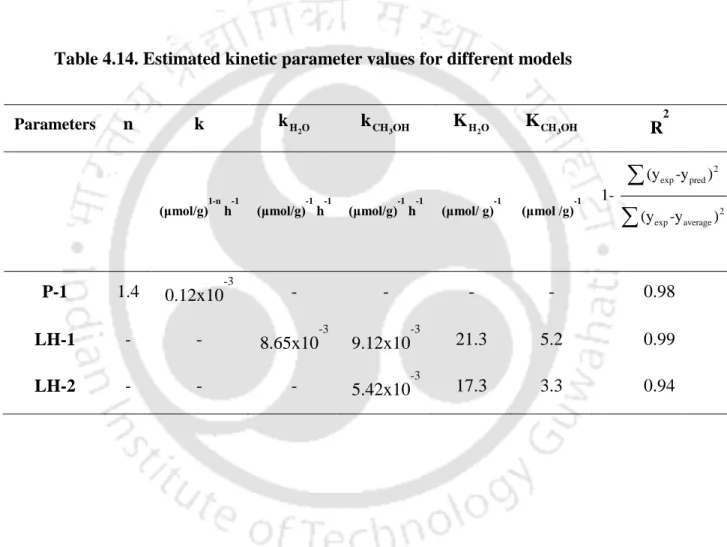
Power law model (P-1)
Production of hydrogen and formaldehyde at different concentrations of methanol (amount of photocatalyst 0.2 g; irradiation time 1 h; light intensity 25600 lx). L-H models were developed for the simultaneous occurrence of the hydroxyl-mediated oxidation pathway and the hole, and only for the hole-mediated pathway. For each model, the optimal values of the kinetic parameters were estimated by minimizing the residual sum of squares between the calculated and experimental methanol oxidation rates.
Model 2: Langmuir-Hinshelwood model based on hydroxyl radical and hole mediated oxidation path (LH-1)
6] HCHO
HCHO
Model 3: Langmuir-Hinshelwood model based on hole mediated oxidation path (LH-2)
- Kinetic analysis of rate equations
- Conclusions
- Recommendations
A systematic methodology for the evaluation of alternative thermochemical cycles for hydrogen production, International Journal of Hydrogen Energy. An economic review of hydrogen production from conventional and alternative energy sources, International Journal of Hydrogen Energy. Cu2O decorated CdS nanostructures for highly efficient hydrogen production by visible light, International Journal of Hydrogen Energy.
Hydrothermally stabilized Fe(III) doped titanium active under visible light for water splitting reaction, International Journal of Hydrogen Energy. Cu2O/Cu/TiO2 nanotube Ohmic heterojunction arrays with enhanced photocatalytic hydrogen production activity, International Journal of Hydrogen Energy. Water splitting reaction on NiO/InVO4 under visible light irradiation, International Journal of Hydrogen Energy, 32, 86-92.
Hydrogen production by water splitting with 18% conversion efficiency, International Journal of Hydrogen Energy. Enhanced Visible Light Photocatalytic Activity of Titanium Dioxide Doped with Tin and Nitrogen, Journal of Material Chemistry. Comparison of thermochemical, electrolytic, photoelectrolytic and photochemical solar-to-hydrogen production technologies, International Journal of Hydrogen Energy.
Cu-enhanced TiO2 photocatalysis in hydrogen production from aqueous methanol solution, International Journal of Hydrogen Energy.
Appendix A: Preparation steps for various catalysts
Preparation procedure of cerium and nonmetal codoped TiO 2
Preparation procedure of copper doped indium-titanium coupled oxide
Appendix B: Calibration plots
- Calibration plot for Hydrogen (GC)
- Calibration plot for methanol (GC)
- Calibration plot for formaldehyde (HPLC)
- Lattice parameters
The lattice distortion of the prepared catalysts was calculated using Stokes and Wilson's formula; = β/ (4 tan θ), where β is the full width at half maximum of the diffracted peak and θ is the Bragg angle for the [h k l] planes (Llordés et al., 2012).
Appendix D: Calculation of band gap energy
The (αhν)1/2 was plotted against hν and the linear region of the graph was extrapolated to intersect the photon energy axis. A line is drawn tangent to the slope in the linear region of the start of absorption. The line can be extrapolated to meet the photon energy axis, which corresponds to the best estimate of the bandgap energy.
Appendix E: Calculation of apparent quantum efficiency
Total incident light intensity Area under the curve for wavelength in the range 450-550 nm Area under the curve for the entire emission profile. Apparent quantum efficiency (AQE) can be calculated as 2 x the number of moles of hydrogen evolved in 1 hour x(6 23.
Appendix F: Derivation of rate expression