INTRODUCTION
THE CONTEXT
According to Gorchev, (1996), in third world countries, 80% of all diseases are directly related to poor drinking water and unsanitary conditions. Thus, continuous monitoring of water quality of rivers and groundwater is needed to record any changes in quality and outbreak of health disorders, as well as for water quality management (Olajire & Imeokaparia, 2001).
NEED FOR MODELING
The growing problem of degradation of our river ecosystems has necessitated the monitoring of water quality in various rivers to evaluate their primary production capacity, utility potential and to plan restoration measures. The industrial units located on the outskirts of cities, intensive agricultural practices and indiscriminate disposal of household waste and municipal waste are the sources of pollution of the river water and ground water.
DATA DRIVEN MODELS
- Rule based models
- Artificial neural network model
- Multiple linear regression model
Coefficients of the regression equation are trained on the available existing data and then, for a new value of an independent (input) variable, gives an approximation of the value of an output variable.
THE PRESENT STUDY
OBJECTIVES OF THE PRESENT STUDY
River dissolved oxygen is greatly affected by physical and meteorological factors, but whether dissolved oxygen concentration can be predicted from such factors with any accuracy was unknown. The objective of this study was to determine the extent to which dissolved oxygen concentration in the Bharalu River can be predicted solely from the selected sensitive parameters that have a comparatively higher correlation with dissolved oxygen using fuzzy rule base, multiple linear regression and artificial neural network modeling techniques and to obtain a comparison between different methods.
THE APPROACH
The use of the WQI (water quality index) and the dissolved oxygen deficiency (D) as simple indicators of a watershed pollution was investigated and compared in the municipality of Las Rozas (northwest of Madrid, Spain) by Sanchez et al., (2006). The SSD values allow classification of the variables according to their increasing contribution to the output variable in the model.
LITERATURE REVIEW
INTROUCTION
Dissolved oxygen is an important indicator that describes the overall health of water bodies, and it can be used to estimate community metabolism of a stream in terms of gross photosynthesis and respiration rates. Fluctuation of DO near saturation, with diurnal variation due to temperature and metabolism, implies relatively healthy waters.
STUDIES ON WATER QUALITY ASSESSMENT
It turned out that the WQI was very useful for the classification of the monitored waters. A strong linear relationship was found between the WQI and the oxygen deficiency (D) of the samples.
ECOLOGICAL MODELING
- Mathematical models
- Fuzzy models
- Artificial neural network models
Artificial Neural Networks (ANNs) are non-linear mapping structures based on the function of the human brain. In a study conducted by Daliakopoulosa et al., (2005), the performance of different neural networks in a groundwater level prediction is investigated to identify an optimal ANN architecture that can simulate the decreasing trend of the groundwater level and make acceptable predictions can provide. up to 18 months in advance.
PARAMETRIC STUDIES
From the contribution profile patterns, it was clear that the predicted density of reds closely corresponds to the ecological reality. The contribution of variables that were not significantly differentiated by PaD was revealed by PaD2.
CONCLUSIONS
A modification of partial derivative method PaD2 was implemented by Gevrey et al (2006) to analyze the contribution of all possible pairwise contributions of input variables, taking into account the two-way interactions between the variables using simulated ANN model for an ecological data. Multilayer feedforward neural network with a backpropagation algorithm was used for modeling and PaD2 was applied to study the two-way interactions of the input variables.
THE ENVIRONMENTAL SYSTEM CONSIDERED FOR THE STUDY
MATERIALS AND METHODS
- Analytical methods and instruments
- Recommended water quality criteria
- Calculation of correlation coefficient
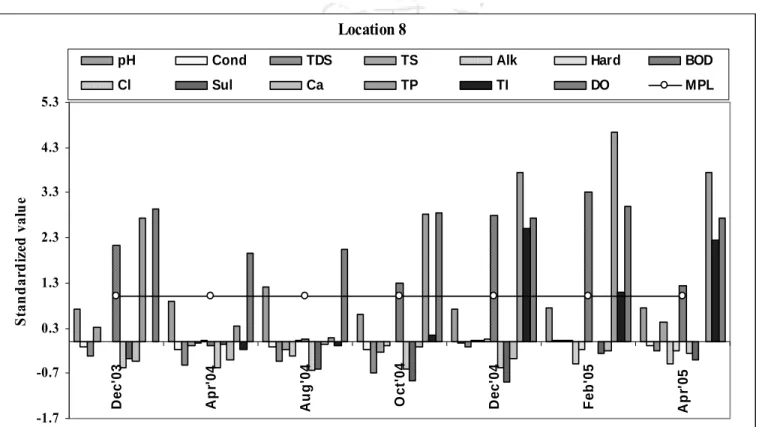
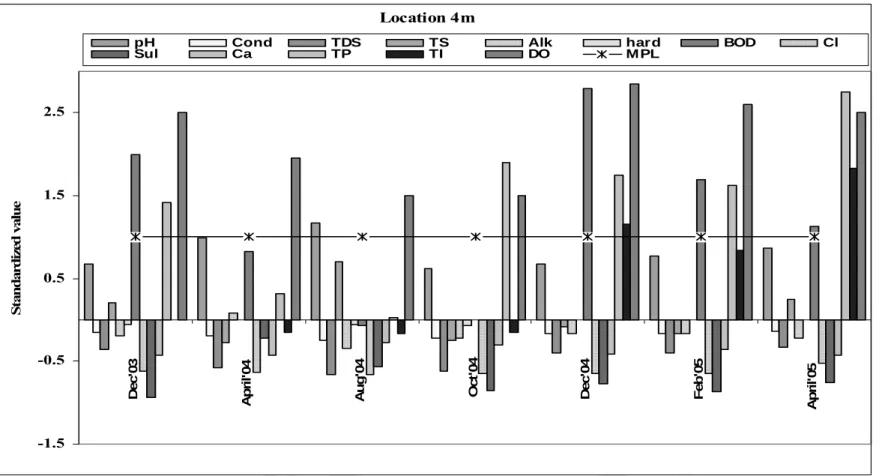
Blocks on the negative side represent concentrations below the desired level that meets the requirement for Class A water or the purest water quality. A value of 0 indicates that the linear model is inadequate, that there is no linear relationship between the variables.
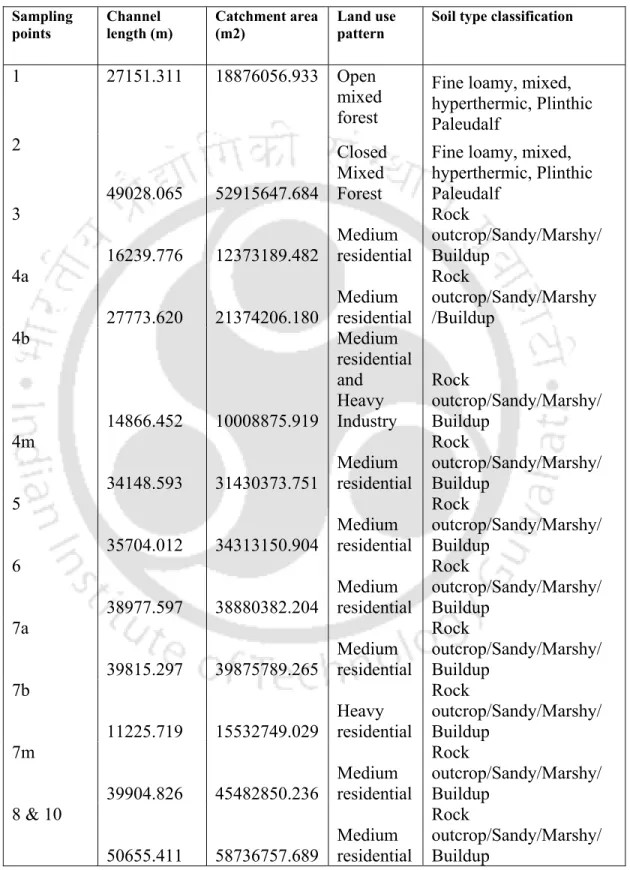
LAND USE CLASSIFICATION
- Geometric correction
- Image enhancement
- Image classification
- Field verification
- GIS model developed
Alkalinity was observed to be very low during the monsoon season in August 2004 (11 mg/L) with the highest concentration during the pre-monsoon shower in April 2004 (328 mg/L) exceeding the desirable level of 200 mg/L. The alkalinity value exceeded the desired level only in the month of April ’04 with a value of 215 mg/L. The same trend was observed for total dissolved solids with a peak value of 354 mg/L in April 2005.
SUMMARY
RESULTS AND DISCUSSION ON WATER
WATER QUALITY ANALYSIS
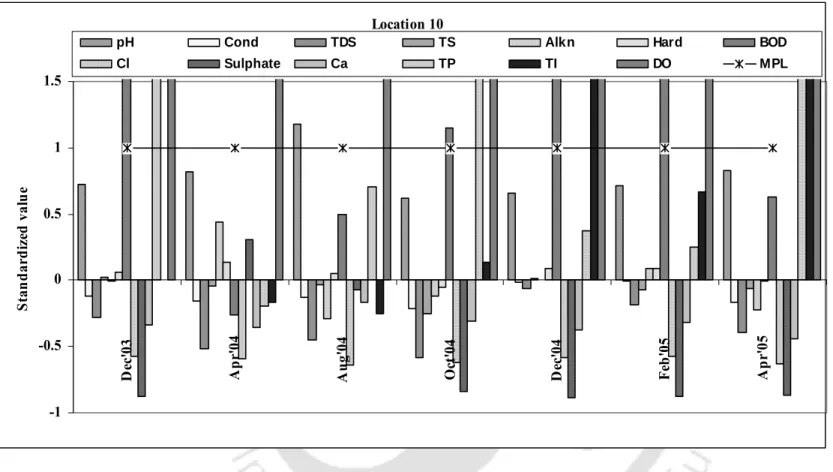
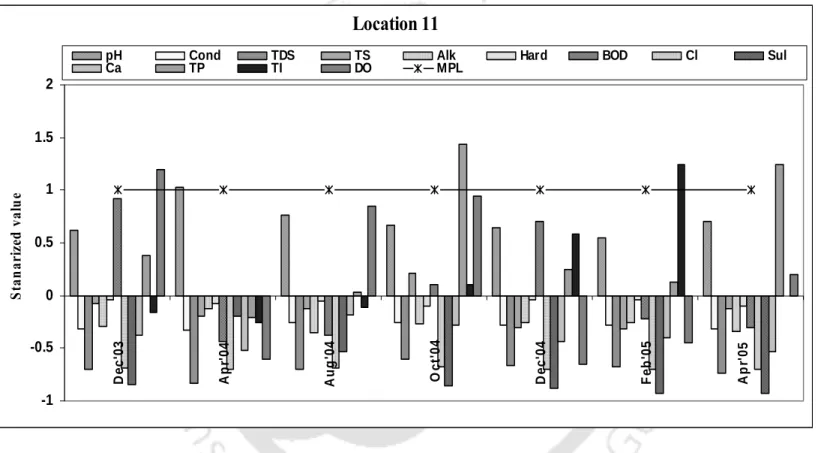
The TDS concentrations were also below the desired limit of 500 mg/L, with a maximum value of 61 mg/L in the month of February 2005. The total dissolved solids was at a maximum (326 mg/L) in the month of April ' 05 during the premonsoon, which is within the desired level of 500 mg/L. Hardness values ranged from 70 mg/L mg/L to 106 mg/L, highest during the April 2005 premonsoon storm.
During the monsoon season, the pH seemed to be in the acidic range, which could be due to the presence of humic substances. As at the previous sites, sodium and potassium were observed to be well below target levels with a maximum of 25.7 mg/L in February '05 and 14.2 mg/L in April '05. The conductivity values were within the desired limit with a maximum value of 733 µS/cm in the month of February '05.
The maximum value of conductivity was within the desirable limits with a value of 733 µS/cm in the month of February ’05.
DESCRIPTION OF THE MOST POLLUTED STATION
CORRELATION COEFFICIENTS OF PARAMETERS
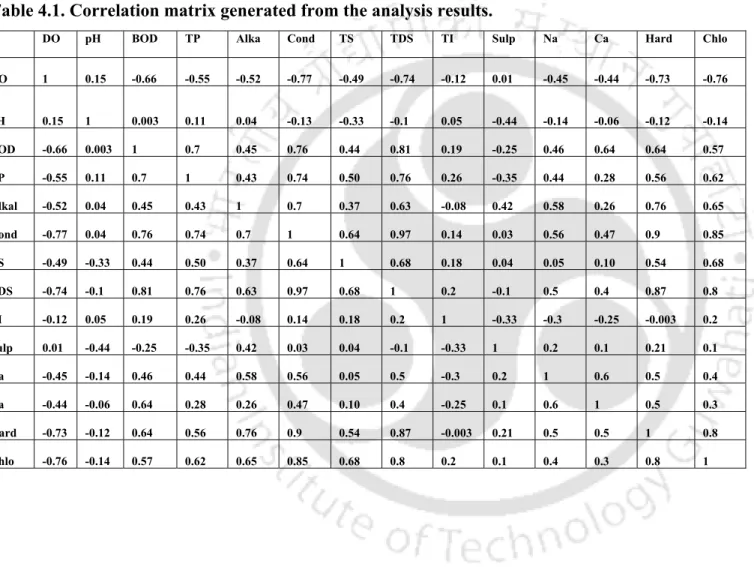
- Correlation matrix
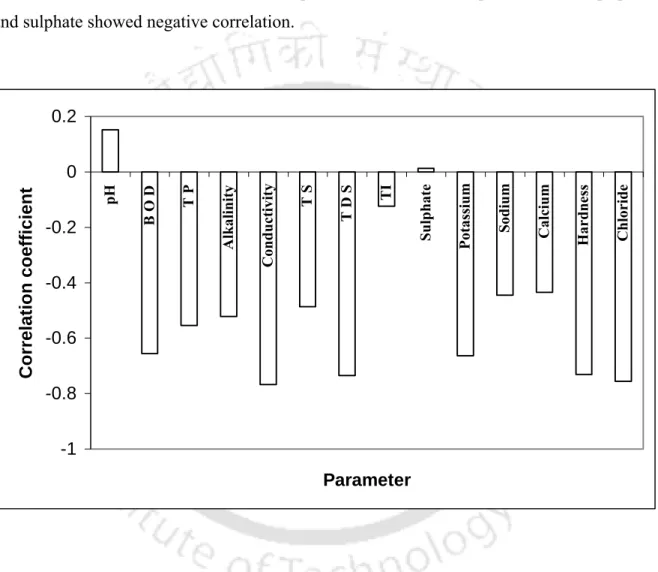
As shown in Figure 4.17, conductivity was observed to have the highest correlation with dissolved oxygen with a value of -0.77 followed by chloride (-0.755). The graphical representation of average concentrations of parameters with relatively higher correlation (above 50%) with dissolved oxygen is shown in Figure 4.18. Dissolved oxygen was observed to be well below the maximum permissible level of 4 mg/L with average concentrations ranging from 0.34 mg/L to 7.7 mg/L.
CONCLUSION
Where Dj is the derivative of the output neuron with respect to its input and is given by D =y2 (1-y2) and. When D is the derivative of the neuron's output with respect to its input, an is given by D =y2 (1-y2) and. SSD values allow interactions to be classified according to their increasing contribution to the output variable in the model.
This is done to check the reliability of contour sketches in variable optimization. Successful optimization of variables can be achieved using contour plots.
MODELING METHODOLOGY
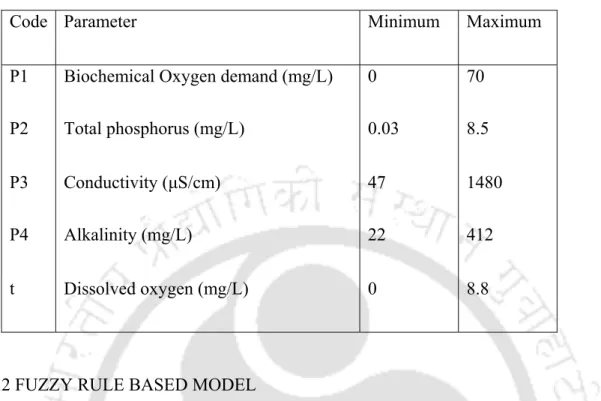
INPUTS AND OUTPUT VARIABLE
FUZZY RULE BASED MODEL
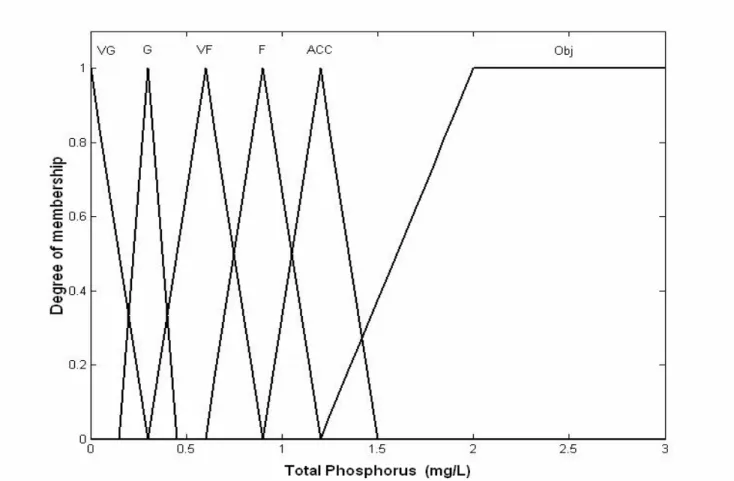
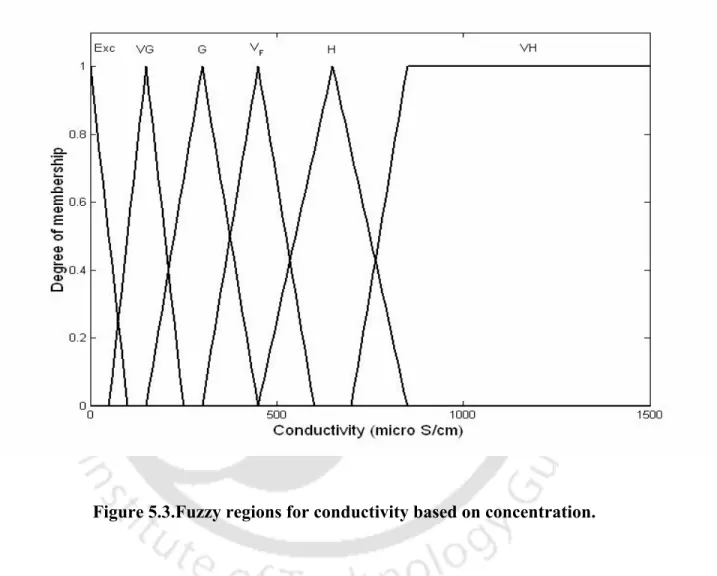
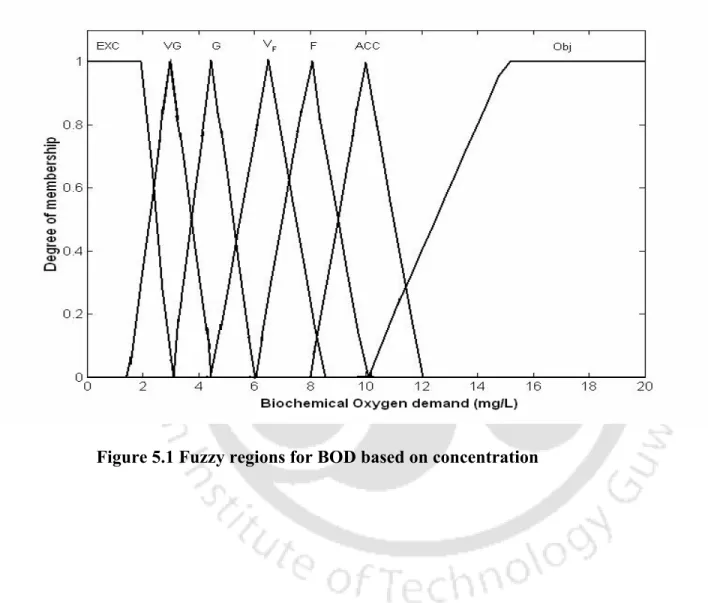
- Description of fuzzy regions
- Defuzzification
- Performance of the model
The centroid or centroid method was used as a means of defuzzifying the output membership function to determine the clean set. After defining the language variables and rules, the next step is to determine the degree of membership of the input to the predecessors of the rules. Where xi is the observed value of the ith data set and xim is the corresponding model result.
ARTIFICIAL NEURAL NETWORK MODEL
- Data normalization
- Training algirithm used
- Generalization
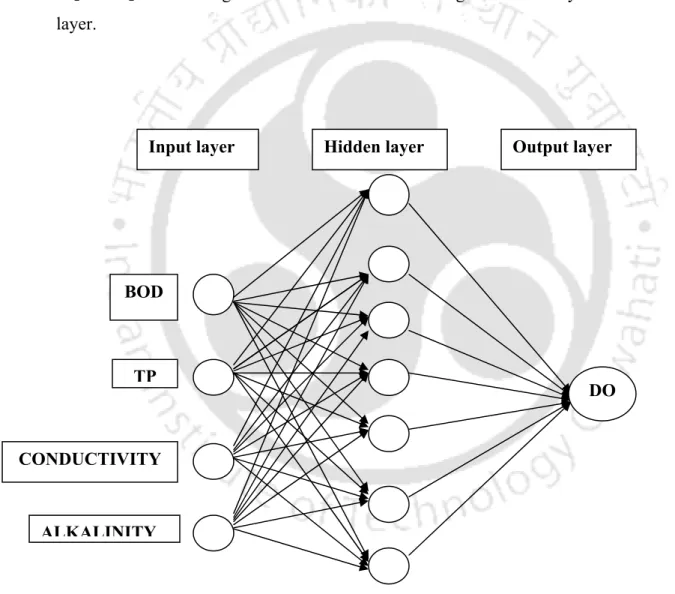
Once that is done, performance should be checked for a third set of data (test data), which is not included in the training data or the validation data. An over-fit neural network typically mimics the data in the training set very successfully, but generates a poor estimate for the data not included in the training. In this way, the neural network architecture with 7 hidden neurons and with tangential sigmoidal function (tansig) in the input layer and logarithmic sigmoidal function (logsig) in the output layer was finalized. The neural network topology used for the prediction of dissolved oxygen is shown in Figure 5.7.
MULTIPLE LINEAR REGRESSION MODEL
In the following trial relationship, the following form was used to check whether it could give better performance. The results were compared with the results of the ANN model in terms of R2 value, RMSE value and efficiency coefficient of the Nash-Sutcliff model.
USE OF ANN FOR PARAMETRIC STUDIES
- Assessment of contribution of input variables
- Variable optimization using contour plots
By considering two-way interactions, the PaD2 algorithm uses the calculation of the partial derivatives of the ANN output with respect to the two inputs. The first is a profile of the output variation for small changes of two input variables, and the second is the relative contribution of a paired input variable to the network output perturbations. For a network with ni inputs, a hidden layer of nh neurons and an output, the partial derivatives of the output yi with respect to inputs xij and xi+1 j (with j=1,.
SUMMARY
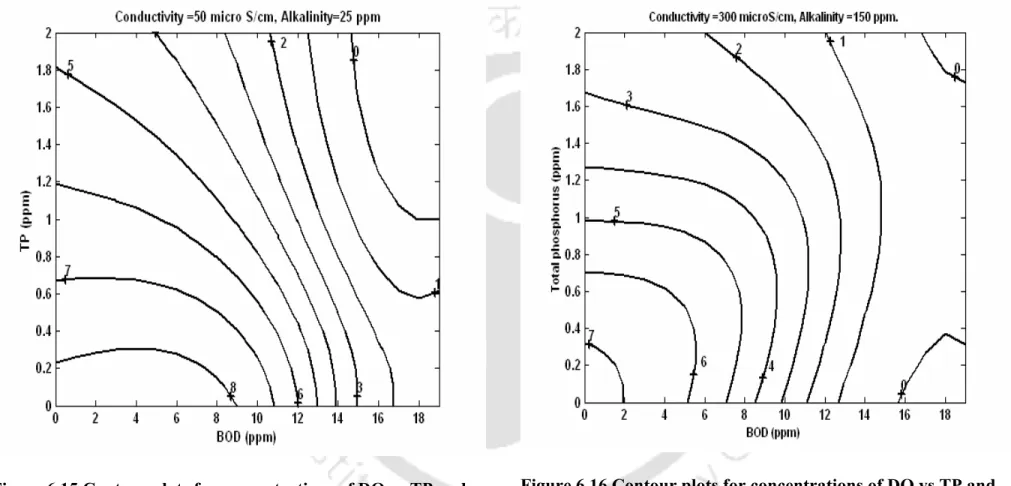
It was observed that the output of data set 14 corresponds to the contour plot which holds conductivity 50 µS/cm and alkalinity 30 mg/L (Figure 6.29). In the contour plot for the same values of BOD and TP and conductivity of 50 µS/cm and alkalinity of 30 mg/L the DO was observed as 8 mg/L. A relationship was developed linking BOD, TP, conductivity and alkalinity to dissolved oxygen in the system studied using artificial neural network model.
PERFOMANCE STUDIES OF THE MODELS AND
RESULTS OF FUZZY RULE BASED MODELING
- Conclusions
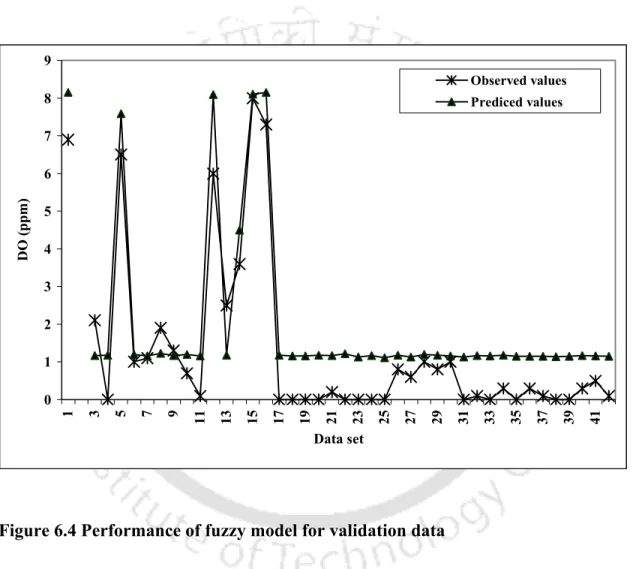
Of the generated data sets, those used to create the rule base for the fuzzy logic model were taken as training data and the remaining 46 data sets were taken as test data. Graphs of the observed data and estimated values obtained from the fuzzy model are provided in Figures 6.1 and 6.2 for training data and test data, respectively. It was observed that the accuracy of the model results mainly depends on the number of fuzzy regions and the fuzzy rules based on all possible combinations.
ARTIFICIAL NEURAL NETWORK MODEL PERFORMANCE
DO PREDICTION USING MULTIPLE LINEAR REGRESSION MODEL . .131
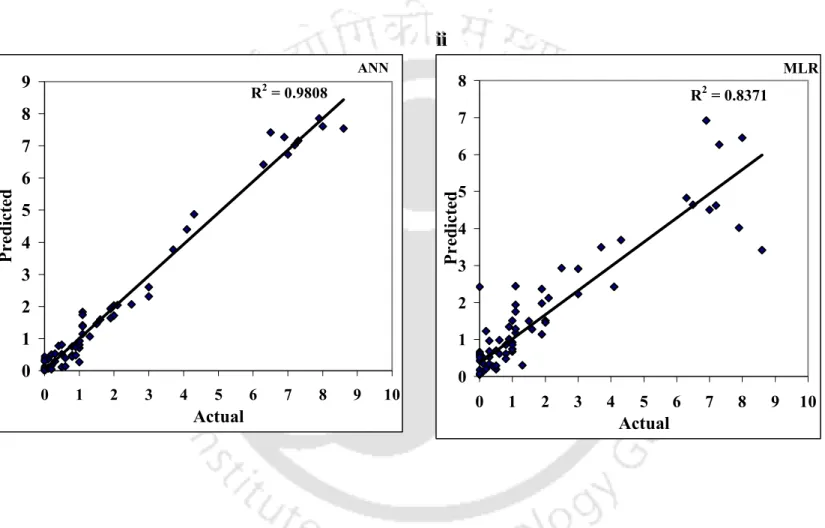
Thus, ANN model predictions were able to follow the trend better, compared to those with MLR model prediction as shown in Figure 6.10. This lack of response may indicate that the fuzzy logic approach is only appropriate when the enumeration of all possibilities can be included, as in the case of some mechanical or electronic instrument, but it may not be entirely reliable when dealing with of natural phenomena where the number of possible combinations can be extremely large. The best performing network was the one with 7 hidden neurons, tangent sigmoidal function in the hidden layer and logarithmic sigmoidal function in the output layer.
CONRIBUTION OF VARIABLES USING SIMULATED NEURAL
- Conclusions
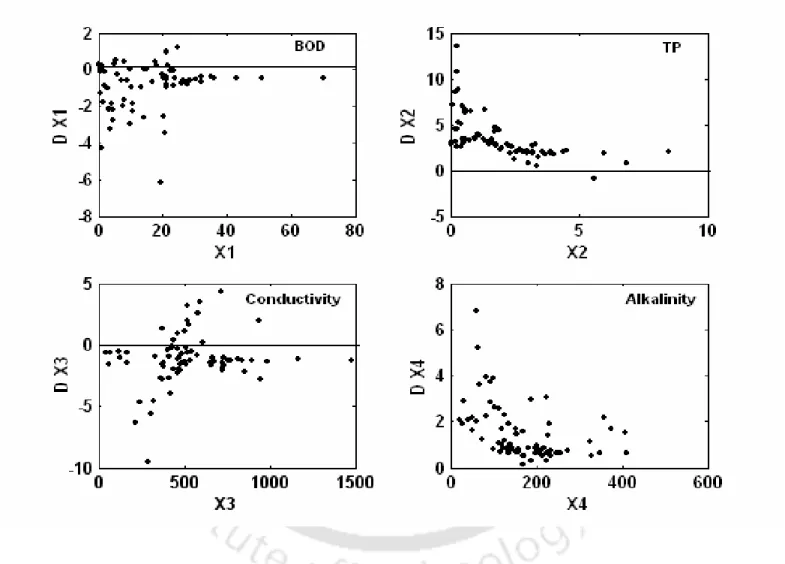
Partial derived values of DO are mainly negative for BOD-alkalinity interaction and DO remains stable for higher values of BOD and alkalinity, meaning that dissolved oxygen decreases with an increase in BOD and alkalinity. In the case of TP-conductivity interaction, negative values were observed for all values of TP and high conductivity values, and with decrease in conductivity, it was observed to approach zero value. Negative values were observed in the case of interaction between conductivity and alkalinity, indicating a decrease in DO for an increase in conductivity and alkalinity values.
OPTIMIZATION OF VARIABLES USING CONTOUR PLOTS
- Comparison of inference of the contour plots with
- Conclusions on contour plots
Contour curves of DO concentration as a function of conductivity and alkalinity when BOD = 6 mg/L and TP =0.5 mg/L. Figure 6.26 shows contour curves of DO versus conductivity and alkalinity when BOD = 1 mg/L and TP = 0.2 mg/L. The water quality of the Bharalu tributary was found to be generally poor, with large seasonal and spatial variations.
MAJOR CONCLUSIONS