According to the experiments of the study, it was concluded that interpolation methods have perfect accuracies close to the interpolation of a surface. It is a unique closed water basin that plays an important role in the creation of the climate.
Conclusion
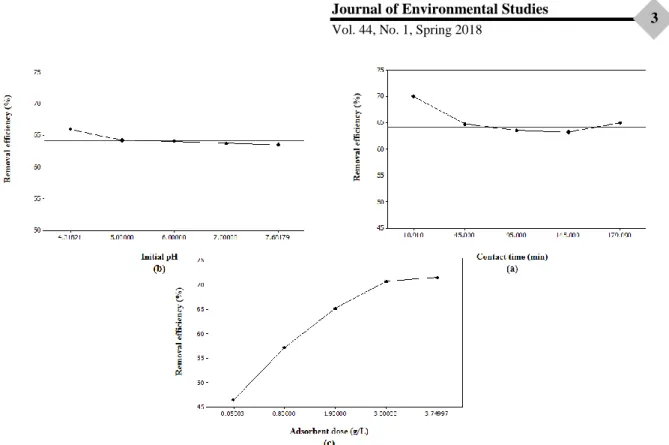
Average concentrations of Hg in the muscles of Ctenopharyngodon idella, Cyprinus carpio, Hypophthalmichthys molitrix, Hypophthalmichthys nobilis, Schizocypris altidorsalis and Schizothorax zardunyi were 0.36 mg/kg, respectively (Table 1). Average concentrations of Pb in the muscles of Ctenopharyngodon idella, Cyprinus carpio, Hypophthalmichthys molitrix, Schizocypris altidorsalis and Schizothorax zardunyi were and 0.81 mg/kg, respectively (Table 1). The HQ of consumption of Schizocypris altidorsalis and Schizothorax zardunyi was higher than 1 (for mercury), indicating that there is a potential health risk associated with the consumption of these fish from the hamun wetland.
The results for lead concentration show that there is no HQ value > 1, which means that humans would not experience a significant health risk if they only consumed metals from these hamun wetland fish species. It should be noted that the maximum consumption of 0.020 kg/day Schizocypris altidorsalis and 0.019 kg/day Schizothorax zardunyi has no potential health risk (CRlim).
Investigating the effect of industrialization on environment quality in Iran emphasizing the moderating role of social capital (Kalman filter approach)
Expanded Abstract 1. Introduction
Materials and Methods
Results and Discussion
Investigating the effect of industrialization on environmental quality in Iran emphasizing the moderating role of social capital (Kalman filter approach). The coefficient of the energy consumption intensity in the estimated model is 0.0005 and indicates that if the energy consumption intensity increases by one unit, the carbon dioxide emission per unit increases. capita with 0.0005 units. The coefficient for urban population in the estimated model is 0.0027 and indicates that if the urban population increases by one unit, the carbon dioxide emission per person increases. capita with 0.0027 units.
The coefficient for industrial value added per per capita (industrialization index) in the estimated model is 0.8176 and indicates that if the industrialization index increases by one unit, the carbon dioxide emission per capita increases. capita with 0.8176 units. According to the estimated coefficients of restricted vectors, there is a long-term negative relationship between social capital and the industrialization coefficient in environmental quality function.
Estimating the preservation value of environmental resources of Abar area of Shahrood by using individual’s willingness to pay
Matherials and Methods
The results presented were 60% of respondents male and 80% of respondents married. The average number of visits to the region was estimated at 3.4 times. Based on the results, 63 individual respondents (18%) are willing to pay for the preservation of the Abar basin.
Based on the results, the expected value of WTP for the individuals was obtained 10574 RLs/month (126889 RLs/year). The estimated economic conservation value does not represent the value of the entire ecosystem of the region.
Estimation the Shadow Price of Pollution in Iran's Wheat Production and Distribution Chain
Expended Abstract 1. Introduction
Result
The shadow value in the distribution sector of real prices was higher than the value of shadow prices in the production sector. The first step is to calculate the amount of environmental impacts in the supply chain. The emission of carbon dioxide, which is the result of energy consumption, is one of the major pollutants released into the environment.
The results of the research showed that the shadow price of CO2 emissions in the manufacturing sector is much lower than in the distribution sector. Therefore, environmental considerations must be taken into account when producing and distributing wheat.
Investigation of factors affecting on land use change in Khorasan Razavi
The first stage of Hackman's two-stage method is the stage of deciding on a change of land use. In other words, it is the degree of intention. It is based on the final effects of significant variables with a positive effect, with an increase in the number of farmers in the family, assuming other factors are constant. The price of the most important agricultural produce and the amount of precipitation is negatively related to the change in the use of agricultural land. By strengthening these three factors, the willingness of the farmer to change the purpose of agricultural land will be reduced. of the results obtained from the probit model, the coefficient of determination of the Mac-Faden model is 0.48 and the dummy R2 is 0.61, indicating a good fit of the model.
Therefore, in the second stage of the model, these variables are estimated using the OLS method. In the second Hackman stage, the presence of the Mills Image Ratio (IMR) in linear regression eliminates the heterogeneity of the model and uses the linear pattern and serves as a variable in the model.
Economic valuation of air and noise pollutions abatement performance
Extended abstract 1. Introduction
Discussion of Results and Conclusion
Also, the annual value of the benefits and the capital value of this species are calculated to be 1,167 Rial and 1,852 B respectively. Also, using the results of this study and the figures obtained, it is possible to improve social awareness of the real value of the functions of this species, increasing their sense of responsibility to protect it and prevent their unnecessary cutting. Also, the results of this study can be used as a basis to fine citizens who violate the law of cutting down trees.
Another use of the results of this study is in the field of economic-ecological evaluation of urban projects. The figures obtained from this study can be used to evaluate projects that may require felling of trees.
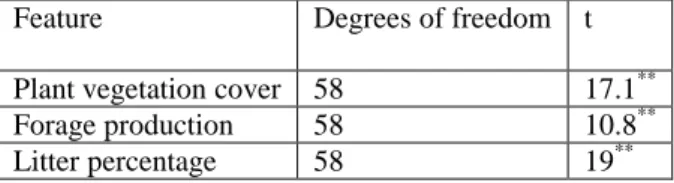
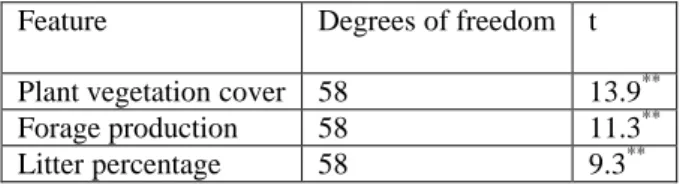
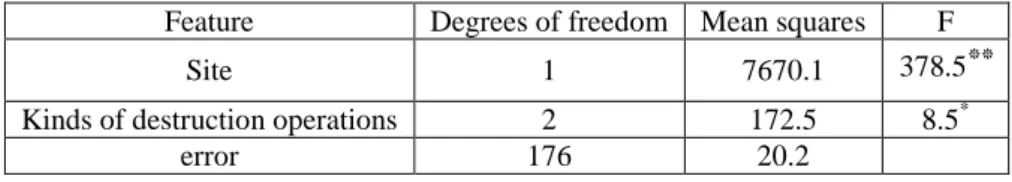
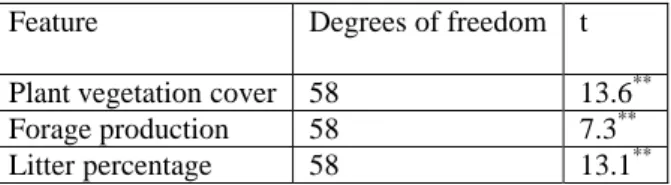
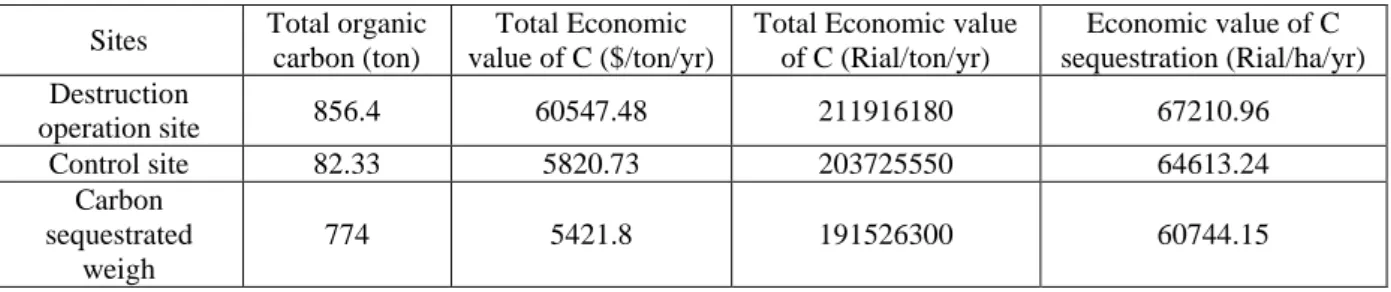
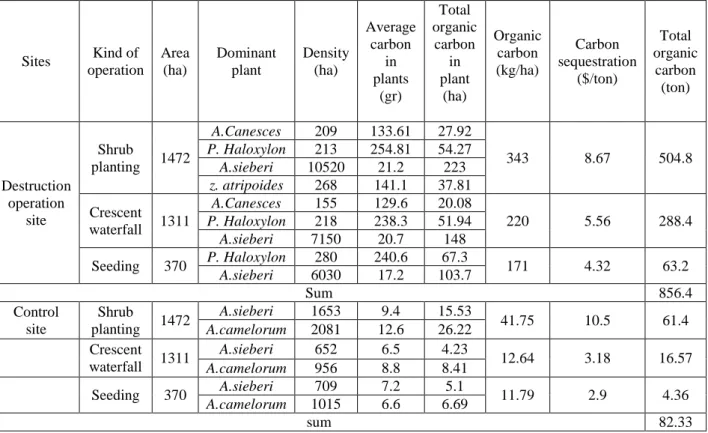
Investigation and Comparison of the Economic Value of Carbon Sequestration Function of Vegetation Cover in Biological Operations (Case
Conclusions
In this study, to estimate the amount of carbon sequestered in the plant, taking into account the cost of measurement, only the dominant species of the ranges of the region were measured. Also, in the selection of suitable species for destruction operations, the ability of the species to sequester carbon is one of the indices for the selection of suitable species. Considering the different assessment methods, it is suggested that the economic value of carbon sequestration in the study area be compared with other economic assessment methods and their results with each other.
Evaluation and Determination of Resilience to Urban Land Use Based on Sustainable Development Approach (Case Study: District 1 of Tehran.
Evaluation and determination of urban land use resilience based on sustainable development approach (Case study: district one of Tehran
Theoretical principles of research
Structural-natural dimension is one of the most important measures of a resilient community, and describes the different structural-natural capacities of a city or a district that affect its ability to prevent and withstand the crisis and its rapid return to normal status after the crisis. Paying proper attention to this aspect increases the quality of normal city life before the crisis, reduces the damage and casualties in the event of crisis, and accelerates the return to normal conditions after the crisis by speeding up the relief and relief efforts. Another benefit of socio-cultural dimension of resilience is its ability to increase the mental, psychological and spiritual readiness of citizens against the events that happen before, during and after the crisis.
Economic resilience describes a region's economic capacity to prevent and withstand the crisis and to quickly return to normal status after the crisis. Any city that lacks economic resilience will be highly vulnerable to natural and unnatural disasters and will not be able to quickly return to equilibrium after the crisis.
Materials and Methods
- Results and Discution
Paying due attention to the socio-cultural aspects of urban land-use resilience increases environmental quality and improves citizens' lives. Ultimately, District 1 achieved an average resilience score of 0.53 in this dimension, indicating medium resilience (or medium vulnerability) with respect to this dimension. This dimension consisted of 8 criteria including population density and land use related to health care, education, culture, tourism, sports, law enforcement and religion.
After overlaying all layers corresponding to criteria, district 1 obtained an average resilience score of 0.69, indicating the resilience of this district in relation to this dimension. Assessments against this dimension revealed that District 1 has an average resilience score of 0.47, indicating this district's medium resilience (or medium vulnerability) against this dimension.
The affecting factors on forming and development of Tehran with an emphasis on relationship between city and nature
On the macro scale
These gardens were formed in the Nasseraddin Shah period, mainly in the north and west of the city. By overlapping the maps, it is seen that there is a balanced relationship between the natural and historical context of Golestan Garden and this relationship led to the early development of the city at the primary settlements of Golestan Garden. This relationship between the garden's structure and the city's growth continued until the Pahlavi period in the 1950s.
In general, the development of the city began from the east and west of the Golestan Garden and then continued to the north and northeast. It is clear that the amount of gardens in the city decreases over the years and increases the density of the city.
On a middle scale
As can be seen, at that time, vast fields in the east and west of Tehran, connected by the fence, were covered by gardens and farms. 34 "Map of Darul Khalafeh Tehran" was drawn in 1858 by August Kreshish, the Austrian teacher of Dar Al Fonon. Comparison of this map with the Barazi Map shows that for almost 20 years, all free land of Tehran was under construction , leaving scattered pieces from the city's gardens.
These changes first appeared in the map of Abdul Ghafar in 1890, and then in the map drawn in 1944, which shows the most orientation to the north. The share size of gardens, especially the Golestan garden, changed within the enclosure by developing city and political-social changes, and gradually decreased.
On the micro scale, interaction of the garden with decorations
The primary core of Tehran is the garden and vegetation and the route of the water network (Qanats) in the Alborz mountain range. On the macro scale, the garden led to the construction of the city and the creation of urban changes and its orientation. The priority of the construction and modification within, it is the preservation of the geometry of the garden in the form of square and rectangle (the principles of Iranian gardening); and by maintaining the priority of its construction, it has influenced the architectural spaces.
On the other hand, the change in the landscape of the gardens in the city towards the slopes of the Alborz Mountains and the remote landscapes during the Qajar period led to the orientation of the growth of the buildings in the garden, and in turn the change led to the growth of the buildings in the garden. orientation of the city's growth towards the north and the hill. Analysis of the effect of spatial configuration of land cover and physical characteristics of buildings on the surface urban cool island phenomenon.
Analysis of the Effect of Land Cover Spatial Configuration and Physical Characteristics of Buildings on the Surface Urban Cool Island Phenomenon
- Retrieval of LST
- SUCI intensity
- Indicators to analyze the effect of landscape composition and spatial configuration and building characteristics on LST
- Discussion and Results 1. SUCI intensity
- The effect of landscape composition on LST
- The effect of shape complexity and fragmentation of built-up areas on LST
- The effect of building characteristic on the intensification of SUCI
Indicators for analyzing the impact of landscape composition and spatial configuration, as well as building characteristics on LST building characteristics on LST. The impact of landscape composition and spatial configuration on SUCI intensification was studied using composition indices and landscape metrics. The influence of building characteristics was also studied by checking the building density (ratio of floor plan areas) and the size of plots in each census area.
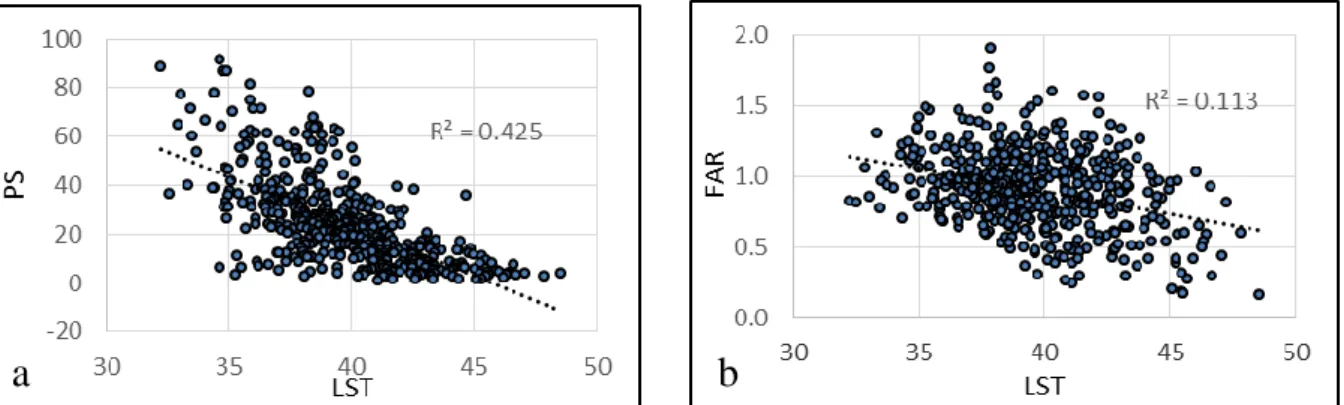
On the other hand, the NDBI presented a significant effect of the built-up area on the reduction of surface temperatures (Figure 1b), in contrast to urban heat island studies. Scatterplot with regression line for LST and composition indices. a) Normalized Vegetation Index (NDVI), b) Normalized Enhanced Difference Index (NDBI).