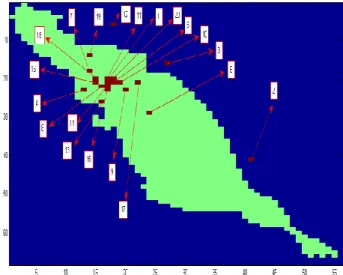
In the first step, the concentration of each pollutant is the input to the AQI calculation algorithm, and the result will be the air quality index for each pollutant. The correlation coefficient values mean that the correlation between the estimated model values for the Tajrish station and the observed air quality data at the same station is greater than that of the Gholhak station.
Determination of Mercury Levels in Different Tissues of Common Coot ( Fulica atra ) and Common Teal ( Anas cerecca ) Associated with Age and
Sex in the Fereydoonkenar International Wetland
Also, there was no significant difference in Hg concentrations between different tissues of teal. In this study, the liver and kidneys of both species had a greater amount of Hg than their pectoral muscle. We also compared the differences in Hg concentrations in both species based on the effects of sex.
In addition, we compared the changes of Hg concentrations in both species according to age effects. With the sampling season (autumn, end of molt for both species) more amount of Hg was excreted from the adult body of both species. Thus, it may be the reason for the high similarity of Hg concentrations in the organs of both species.
The results of correlation of Hg concentrations in various organs with biometric data showed, there was no statistical correlation for the amounts of Hg in different organs of common coot.
Development of pressure management analytical equations in water distribution networks
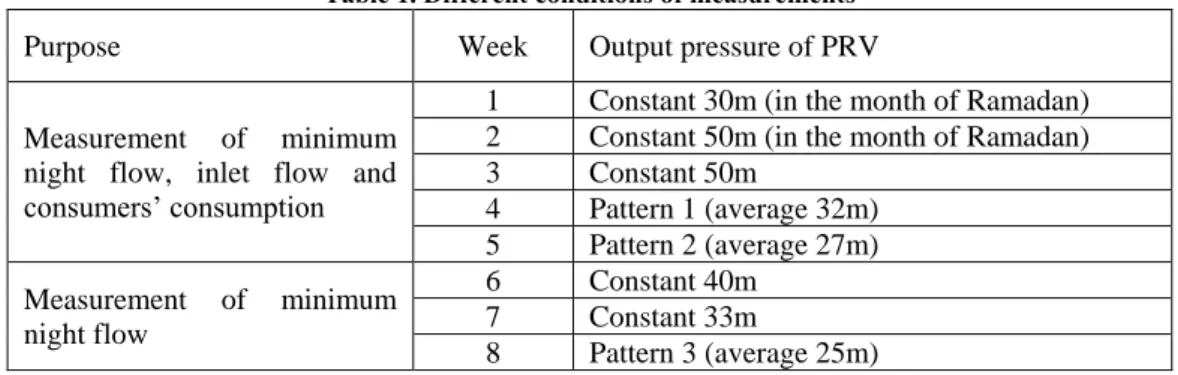
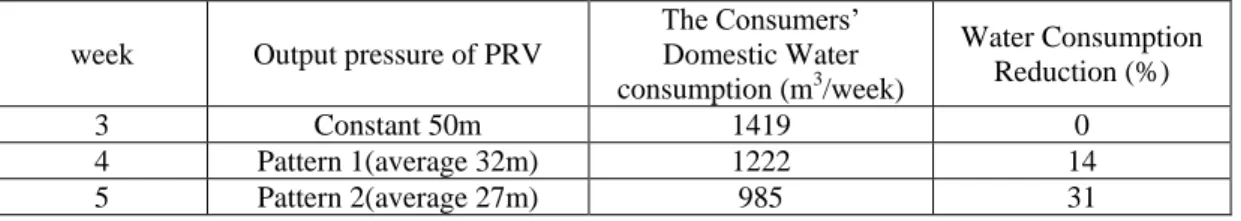
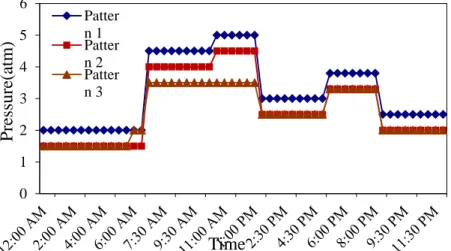
On the other hand, it might be possible to monitor changes in nighttime flow with variations in water pressure, by having different pressure patterns and measuring the nighttime flow for each. To study the effects of pressure control on consumers' consumption, 64 consumers were selected as a sample of the total number of consumers and their household water consumption measured by reading their flow meters in different weeks during the study period. The household water consumption and the saved water values of the consumer in the different weeks of water consumption.
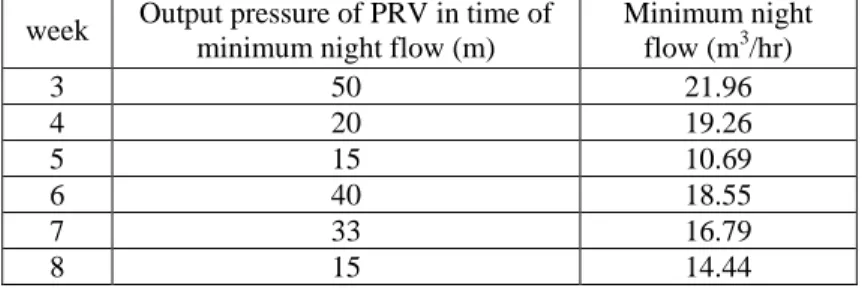
Since the amount of the consumer's night consumption is almost constant, the minimum night flow can be a suitable indicator for network leakage estimation. The trend results show a reduction in nighttime minimum flow with pressure reduction and a potential for nighttime flow reduction of more than 30 percent. In the present study, the results of pressure management in the distribution network show that without consumer complaints, some benefits such as reduction of leakages and consumer consumption are practically achievable.
A new analytical method was recommended to estimate the pressure exponent (N) in the FAVAD equation as well as analytical equations to estimate the effects of pressure management on leakage and water consumption.
Simultaneous Removal of Salinity and Organic Loading Rate using Phytoremediation
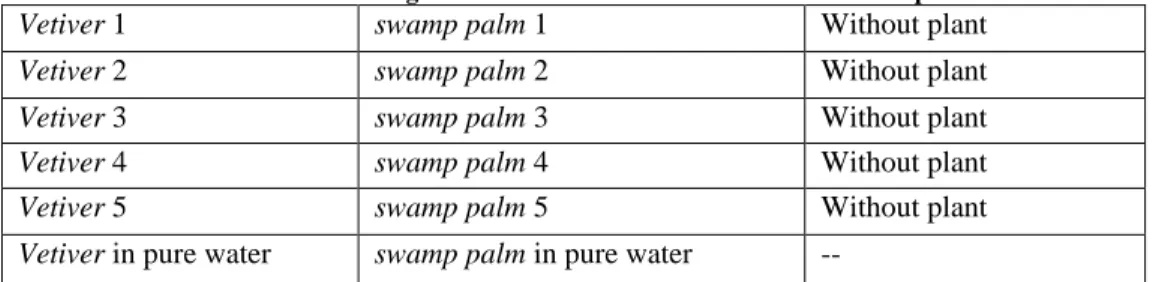
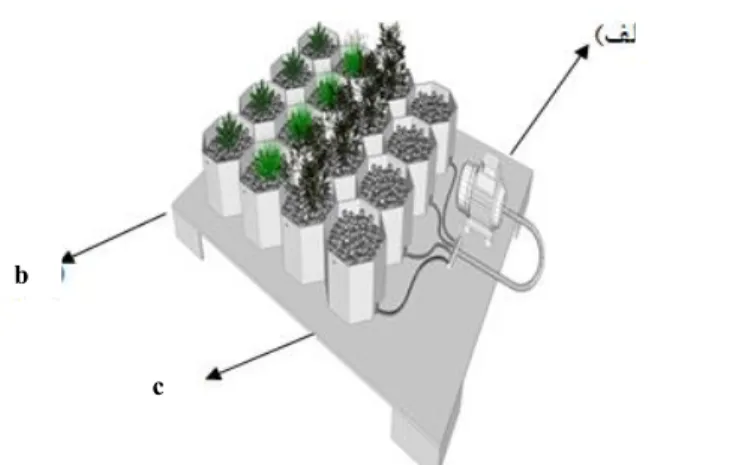
Five wastewaters with different amounts of electrical conductivity and organic matter were artificially produced in the laboratory. Both swamp palm and Vetiver plant were irrigated with distilled water as the control in addition to treatment with 5 mentioned wastewaters. Up to 5 of the reactors without plant were irrigated with said wastewater to investigate the effect of aeration in reducing the amount of electrical conductivity and COD parameters.
The process of reducing the amount of electrical conductivity in both species reduced the increase in salinity. The highest amount of salt intake by planting swamp palm in the electrical conductivity was observed 2500 micro Siemens per centimeter and about 30% and about 53% for Vetiver. The process of reducing organic matter in both species decreases with increase in salinity level with the highest efficiency of COD reduction by planting swamp palm in the electrical conductivity was observed 0 and organic matter mg / L 300 about 50% and for Vetiver plant about 58%.
Finally, the Vetiver plant was diagnosed in comparison with swamp palm for phytoremediation of saline wastewater with suitable organic matter.
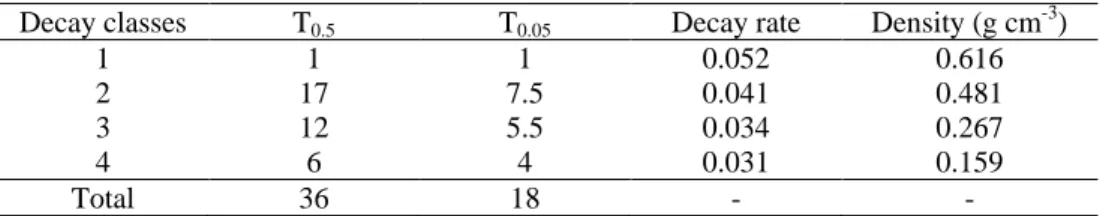
The decay time and rate determination in oriental beech ( Fagusorientalis Lipsky) deadtrees, Asalem forests, Iran
Diameter at breath height was measured on dead trees in the early stages of decay. Tukey's HSD procedure was used to determine significant differences in the mean density of wood with years at α =0. The tree species of E.radiata and E.elata showed differences in the rate of decomposition of the wood.
In addition, coniferous and broadleaf tree species also differ in the chemical properties of the wood that caused differences in decay rates. Studies showed differences in decay of tree species due to changes in moisture content and tree density. According to the results in maintaining dead wood as a source of biodiversity in forest ecosystems, the dynamics of the density and volume of dead wood should be taken into account.
The maintenance of dead trees can guarantee species diversity, especially in the population of birds, insects and fungi in the forest ecosystems.
Application of environmental risk assessment in the sustainability of marine protected areas, Case study: Nayband Marine National Park
Application of environmental risk assessment in the sustainability of marine protected areas, Case study: Nayband Marine National Park. Other factors include land use changes, road development and construction, and military border activities that cause serious disruptions to the hydrological system in mangrove habitats. Population is another risk factor; based on the census in the year 2011, the population growth rate is 11.3 percent, which is one of the highest growth rates in Iran.
The construction of loading docks between Bidkhon and Assaluyeh in the northern part of the Gulf of Nayband damaged reefs and larval habitats. It is predicted that waste generation in the study area will be between 124 and 205 kg of waste per day. This research has shown that there is a practical limit to the application of conceptual models; these models are very abstract and general.
Periodic monitoring of air pollution with an emphasis on measuring the amount of particles in the Marine National Park at a distance of 100 meters.
Estimation of Aerosol Optical Depth Using MODIS sensor Images over Persian Gulf Surfaces
This best suits or an. the mean' of the set of best fits is the solution to the inversion. The trick, however, is to determine which of the (4 x 5) twenty combinations of fine and coarse modes and their relative optical contributions best mimics the spectral reflectance observed by MODIS. AERONET's “sun-measured” definition of FW is distinct from any MODIS definition (land or ocean), but should be linked to one or the other.
The number of matching points between the two data sets can become sufficient to attempt to reduce the current uncertainties. To further evaluate the performance of the algorithm in comparison with AERONET measurements, we used an RGB image from MODIS. Overall, the comparison with AERONET data revealed a similar performance of both satellite datasets with a tendency for simulation AOTs to underestimate and MODIS overocean AOTs to overestimate AERONET values.
These limitations can be linked to the extreme sparseness of the marine AERONET data, uncertainties related to local conditions at the marine stations, and regression accuracy limits imposed by natural aerosol variability.
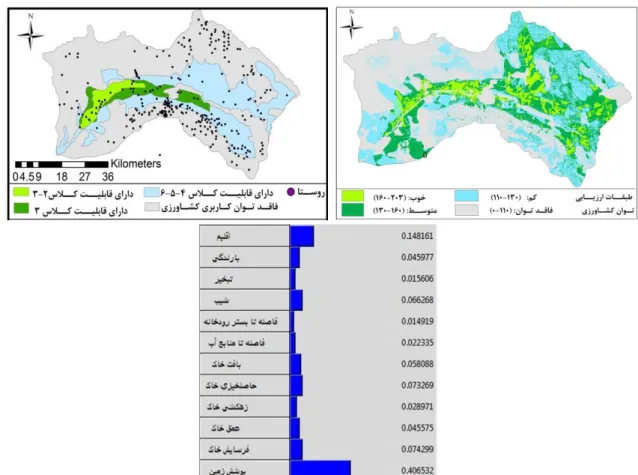
Troubleshooting the Independent Factors and Uncertainty of Agricultural Capability Evaluation Using the AHP FUZZY Method
At this stage, for each of the factors identified in the previous stage, a map was provided based on the utility of the objective (areas suitable for agriculture) to be studied. Areas with a slope above 70%, protected areas of the Ministry of the Environment and flood-prone areas (image) that can be protected cannot be used and must be removed from the research area. According to the factors affecting the land, the ability to develop agriculture is identification and drowned in the software.
At this stage, the layers of the raster weights are based on the equation (1) to obtain the final suitability map. In this study, initially, based on 12 environmental and infrastructure factors and also the constraints, the value of each pixel of the study area, the ANP FUZZY technique in agriculture was achieved. Thus, by comparing the two methods of the Iranian Model and the ANP FUZZY technique, the conclusion is that the Iranian Method was a simpler approach to nature and its interactions.
In the current method we have a more comprehensive identification of impact factors, entering uncertainty of the "Fuzzy" Technique and also see interactive network analysis techniques to design more realistically and to look forward to a more detailed process closer to the situation of villages come.
Determining the ecological sustainability of Kalshoor Basin using the Ecological Footprint method
The instability of the Kalshoor basin is due to overexploitation of the current resources. Also, due to the presence of tourists in this area and subsequent environmental impacts, the EF rate increases. Three comprehensive solutions have been presented to reduce the level of EF: 1- expansion of the planet Earth.
Wakernagel et al (2000), believe that technology can improve the ability of countries to increase the efficiency of the resources. One of the most important factors in reducing EF is scientific management, especially in urban residential areas that guarantees the achievement of sustainable urban facilities. Many environmentalists believe that the continuity of the traditional economic patterns and excessive consumption of materials and natural resources in a region will endanger human survival.
Therefore, informing about the extreme use of ecosystems and the reduction of waste production and their recovery uses effective technologies to reduce the level of exploitation of ecosystems and control industrial pollution of modern technologies to ensure the ecological sustainability of various ecosystems.
Tourism Development in Kandovan Village
Among the economic attractiveness of the village we can mention garden and dairy products, honey and mineral water. One of the results of this research is to investigate the presence of a culture of tourist acceptance among people who want internal and external tourists from all study groups (women, young people, people who work for the municipality, men, etc.). As a result, the development of basic services, including transport, the construction of tourist accommodation and the necessary training for women and youth in the groups, may be necessary.
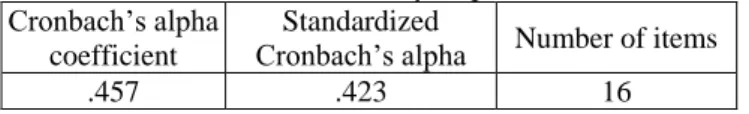
Other results of this study are that most of the visitors are from different provinces and less foreign visitors. Due to the arrival of tourists in the last 7 years, more than half of the population is employed in the service sector, which may also reduce immigration compared to other cities. According to the results of the study, Cronbach's alpha test was used to calculate the reliability of the questionnaire.
Establishment of quality restaurants for the use of visitors to ensure the comfort of tourists and the return of tourists to rural areas; thereby creating job opportunities and improving the economic condition and development of Kandovan's rural district.
Investigation about the relationship among economic growth, environmental pollution, financial development, and trade openness in 8