Singh reports that the concentration of heavy metals in the vermicompost decreases with the increase in time of the decomposition process (Singh et al., 2011). In this study, at the end of the process, it was observed that the concentration of copper increased in all the treatments.
Kinetic and thermodynamic study of cadmium (Cd) adsorption by grape and apple pruning residues biochars
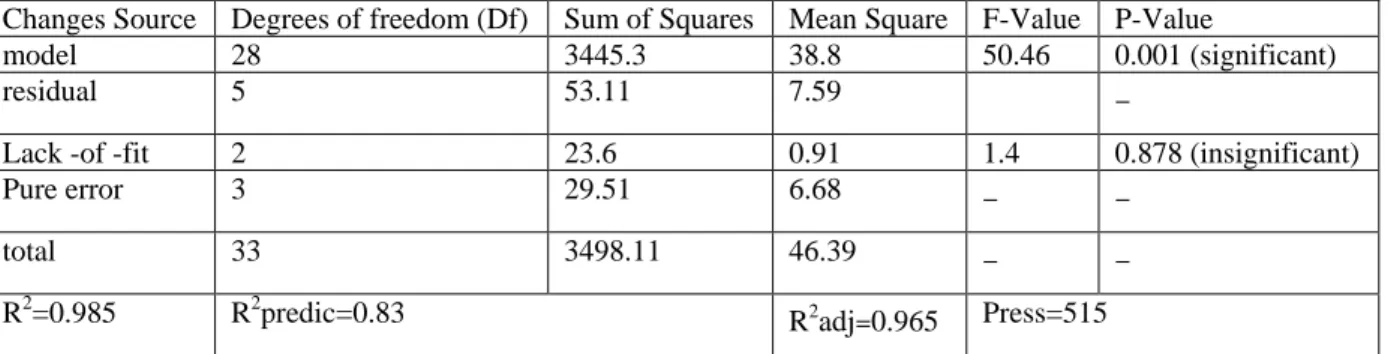
Kinetic and thermodynamic study of cadmium (Cd) adsorption from grape and apple pruning biochar residues. Experimental data showed that Cd adsorption increased with increasing contact time and the equilibrium time is reached at 40 minutes for grape and apple pruning residue biochar. Among the adsorption kinetics models, the pseudo second-order model was the best fit to the experimental data (R2=1) and the predicted equilibrium sorption capacity values showed good agreement with the experimental equilibrium uptake values. Adsorption capacities (qe) obtained from the second-order pseudo-model were 9.8 and 9.0 mg g-1 for grape and apple pruning biofuel residues, respectively.
In this study, biochars of grape and apple pruning residues, produced in large quantities in orchards of West Azerbaijan province, were evaluated as a low-cost alternative adsorbent for the removal of Cd2+ ions from aqueous solution. The results showed that cadmium adsorption increased with increasing contact time and the equilibrium time was reached at 40 minutes for grape and apple pruning residue biochars, respectively. It was observed that cadmium adsorption for grape pruning residue biochar was higher than apple pruning residue biochar.
Results from this study suggest that grape and apple pruning residue biochars were able to substantially remove Cd2+ from aqueous solutions.
Comparison of artificial intelligence and geostatistics methods abilities for spatial prediction of Arsenic anomaly in Chahardoli plain
Lithology of the Rhyolite and Rhyodacite is related to the Jurassic and Cretaceous exposed in the central highlands to the west of Chahardoli. The last magmatic phase relates to the early Quaternary and it covers the study area from the east of Vinsar village to the south of Daskasan village. From a hydrological point of view, study area is located on a tributary of the river Taluoar.
The high correlation of arsenic with these elements is due to their common origin and the role of these elements in increasing arsenic concentrations in watercourses in the region. In this model, a reduction method was used for data classification and membership determination. Three sets of functions were used as the main operators to compare the results of the program.
The main reason for this can be found in the heterogeneity of the study area and the special conditions of the data that cause the nonlinear and unclear overall trend.
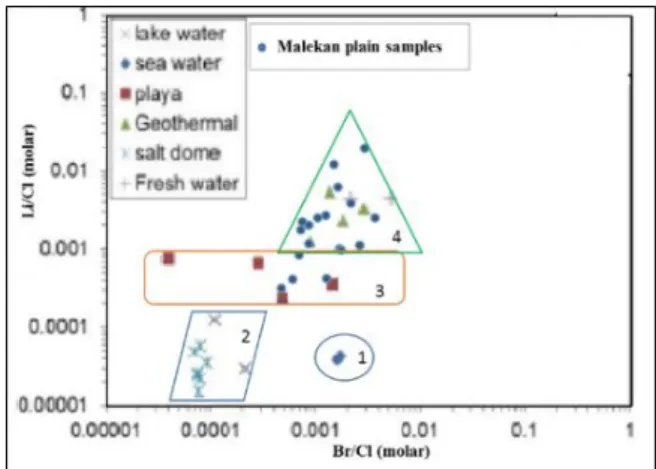
Evaluation of groundwater salinization and delineation of ion offspring in Malekan Plain Coastal Aquifer using ionic ratios
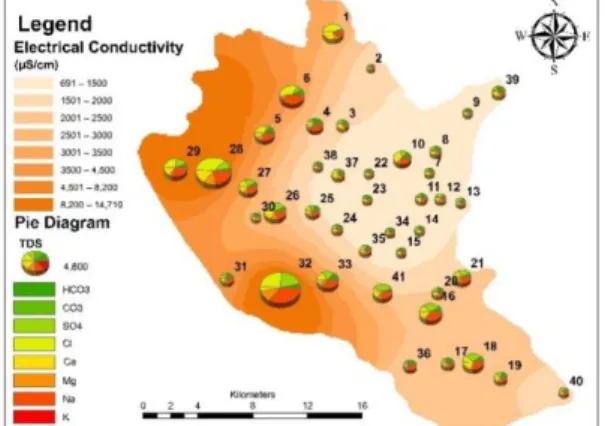
Related to total dissolved solids (TDS) gave a variable response between the northwestern and southeastern parts of the study area. However, relatively low values of TDS (less than 1500 mg/l) were recorded in the eastern and southeastern part of the study area (Fig. 1). The order of abundance of the main cations and anions is as follows: Ca2+ > Na+ + K+ >.
The evaporation of surface and groundwater has had significant effects on the increase in salinity and dissolved solids at the end of the plain. The hydrogeochemical ratios and saturation index resulting from geochemical modeling indicate that dissolution of evaporite deposits and cation exchange are the main processes affecting the chemical composition of groundwater. The Li+/Cl- ratio is one of the most important ratios used to separate different salinity origins.
Based on the results of this study, factors such as cation exchange, saline intrusion form the evaporated brines, modern playas, and also leaching of saline-clay layers from the northwest of the aquifer adhering to the southeast of Lake Urmia, and groundwater evaporation at the end of the plain could be the main reasons for salinity in relation to the techniques used.
The investigation of absorbing heavy metals self-purification in Watershed of Kaleibarchay River
The results show that the amount of Pb metal in the water is significantly below the standard of all countries and with the standards of the Environmental Protection Agency, the World Health Organization for Standardization and Industrial Research of Iran otherwise. Cd metal content in the water under the standard of all countries and with the standards of the Environmental Protection Agency, the World Health Organization and the Standards and Industrial Research of Iran differ significantly. Cu metal content in the water is significantly different from standard water standard for all countries and lower than EPA standard, World Health Organization and the Standards and Industrial Research of Iran.
Cu in sediments is significantly different and lower than EPA standard, International Oceanic and Meteorological Organization standard, Canadian International Standards Organization, World Health Organization and International Food Standard, Standards and Industrial Research of Iran. We can conclude that in the years 1384 to 1391 the concentrations of Pb in water and lead in our country decreased. Finally, it can be noted that the presence of vegetation around the edge of the Kalibir tea river and the amount of sediment accumulated in the bed and on the sides, as well as the amount of river flow, can affect the degree of self-pollination of the river. .
Therefore, this could be a research area in connection with screening other heavy and toxic metals in water and sediment samples, investigating the effect of these metals on plants, aquatic animals and birds, studying the rate of self-healing of heavy elements in the river and vegetation, assessing heavy metals in the soil around rivers.
Good governance role and size of government on environmental performance in selected countries
On the other hand, more government presence may be associated with problems such as weak institutions, government inefficiency, lower quality standards, weakening of regulatory agencies, extensive administrative bureaucracy, lack of accountability, corruption, research of rent, weakening public participation, undermining public control and participation and so on. Therefore, more attention should be paid to the effect of government size and good governance and their interrelationships on environmental quality. So, based on the above discussion, the current study discussed the role of government in society (including for example corruption control, accountability, public participation, rule of law and regulatory quality) and socio-economic performance of governments (such as .the size of government in the economy) on environmental performance.
The results show that all these indices have a significant positive impact on environmental quality. In short, on the other hand, the types of corruption are often relevant in the government sphere. The results also show that government size, population density and GDP per capita had a significant and negative impact on the EPI and that the effect of economic openness on the EPI was positive.
This means that in the early stages of economic growth, this reduces the quality of the environment; but continue along the path of economic development by providing resources to communities to improve environmental performance.
Predicting the impacts of climate change on Persian oak ) Quercus brantii ( using Species Distribution Modelling in Central Zagros for conservation
Field studies include obtaining the geographical coordinates of the presence of this species in the central Zagros. For example, in the second step, the tree is adapted to the remnants of the initial tree. In this study, we used ensemble model predictions within Biomod and R software.
This research showed that annual precipitation (49.7%) and average temperature of the driest quarter (27.7%) played the most important role in habitat suitability of these species. Similar results have been obtained in many of the studies in which the movement of species has been affected by climate change. This research showed annual precipitation and average temperature of the driest quarter played the most important role in habitat suitability of this species. These models can also predict the geographic shift of given species under climate change scenarios (RCP4.5).
According to the results, the Persian oak is expected to move towards higher altitudes, reducing the area of its current distribution.
Monitoring and prediction of urban growth by using multitemporal images and GIS techniques (Case study: Bojnourd City)
Land change models can be very useful tools for environmental and urban growth research on land use change. IDRISI Andes was used to determine land change using three different land use maps from and 2015. Maximum likelihood classification was used to derive three land use categories in the study area. This way is based on the probability density function associated with a specific training site signature. .
The land use maps were produced by supervised maximum likelihood classification and three classes (settlement areas, vegetation and barren land) were taken into account. In this study, three major land use categories have been identified and mapped after field research, literature review and visual interpretation. The analysis of land use changes for the coming period indicates that the area of residential areas has increased.
Land use maps are very important for decision makers and for environmental management purposes to assess land changes and the causes of land degradation.
Assessment of landscape quality of urban public spaces (Case study: Imam Square in Hamedan)
Sidewall Activity & Land Use”, “Vendors and Hawkers”, “Vehicle Movement”, “Pedestrian Movement”, “Discipline & Arrangement”, “Sense of Security” and “Noise Condition”. This factor includes 11.83% of the total variance and is related to "Urban Facilities and Equipment", "Paintwork", "Urban Advertisements" and "Decoration". This factor includes 6.15% of the total variance and is related to "Central Statue", "Valuable Buildings" and "Cultural and Artistic Events".
The standardized beta coefficient” and the “average dissatisfaction of each variable” being multiplied together and the priority variables are specified. Other aspects such as "Noise condition", "Feeling of safety" and "Cleanliness" do not have a favorable condition. Also, this variable has a direct effect on other variables such as "Noise Condition" and "Feeling of Safety".
Hence, at Imam Square, pedestrian facilities including "Urban Furniture" and "Guidance Signage" are the landscape organization priorities of Imam Square.
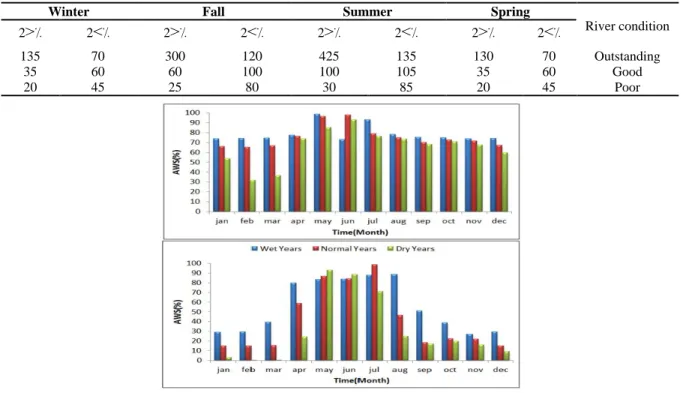
Development of Environmental Flow Assessment Method for Rivers in Southern Caspian Sea Basin
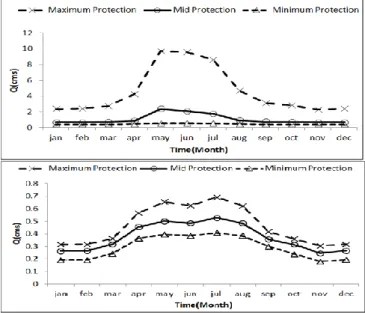
Therefore, the development of flow index for environmental flow is carried out based on these two types of rivers. According to habitat time series, the environmental flow regime in two habitats is assessed in three phases. The first stage was maximum protection or excellent condition where maximum area-weighted suitability is available for aquatic life in the river.
Based on the ecological negotiation, the minimum acceptable AWS was 50% of the maximum AWS, so 75% and 50% of the maximum area-weighted suitability are available in Phases 2 and 3. Time series of habitats in simulated habitats (top image is Absefid and bottom image is Elarm).